| Param | Original file | Final file |
|---|---|---|
| Filename | modeM0/AS1A06_003T04_9000004866_34026cztM0_level2.evt | modeM0/AS1A06_003T04_9000004866_34026cztM0_level2_quad_clean.evt |
| Size (bytes) | 555,068,160 | 61,738,560 |
| Size | 529.4 MB | 58.9 MB |
| Events in quadrant A | 2,582,662 | 404,379 |
| Events in quadrant B | 3,639,819 | 391,706 |
| Events in quadrant C | 3,638,680 | 390,036 |
| Events in quadrant D | 6,568,328 | 289,597 |
| Mode M9 | |||
|---|---|---|---|
| Quadrant | BADHDUFLAG | Total packets | Discarded packets |
| A | 0 | 23 | 0 |
| B | 0 | 23 | 0 |
| C | 0 | 23 | 0 |
| D | 0 | 24 | 0 |
| Mode M0 | |||
|---|---|---|---|
| Quadrant | BADHDUFLAG | Total packets | Discarded packets |
| A | 0 | 11378 | 2 |
| B | 0 | 14480 | 1 |
| C | 0 | 14469 | 1 |
| D | 0 | 23298 | 1 |
| Mode SS | |||
|---|---|---|---|
| Quadrant | BADHDUFLAG | Total packets | Discarded packets |
| A | 0 | 114 | 0 |
| B | 0 | 114 | 0 |
| C | 0 | 114 | 0 |
| D | 0 | 114 | 0 |
| Quadrant | Total seconds | Saturated seconds | Saturation percentage |
|---|---|---|---|
| A | 5615 | 9 | 0.160285% |
| B | 5615 | 248 | 4.416741% |
| C | 5615 | 132 | 2.350846% |
| D | 5615 | 1453 | 25.877115% |
Noise dominated data is calculated using 1-second bins in cleaned event files. If a bin has >2000 counts, and if more than 50% of those come from <1% of pixels, then it is considered to be noise-dominated and hence unusable.
| Quadrant | # 1 sec bins | Bins with >0 counts | Bins with >2000 counts | High rate bins dominated by noise | Noise dominated (total time) | Noise dominated (detector-on time) | Marked lightcurve |
|---|---|---|---|---|---|---|---|
| A | 7228 | 5616 | 0 | 0 | 0.00% | 0.00% |  |
| B | 7227 | 5615 | 208 | 208 | 2.88% | 3.70% | 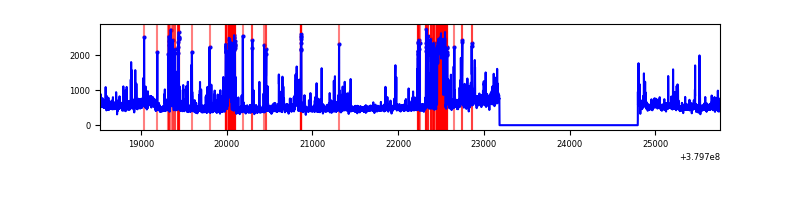 |
| C | 7227 | 5615 | 109 | 109 | 1.51% | 1.94% | 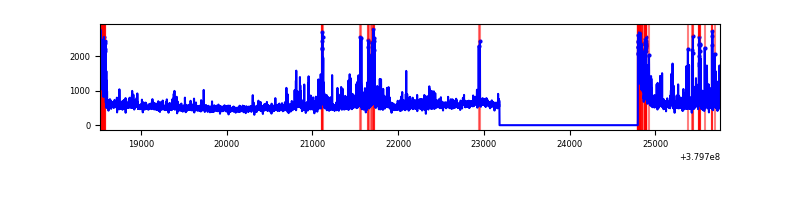 |
| D | 7227 | 5614 | 1443 | 1443 | 19.97% | 25.70% | 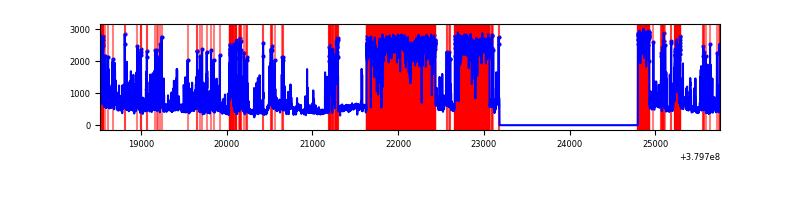 |
Top three noisy pixels from each quadrant. If the there are fewer than three noisy pixels in the level2.evt file, extra rows are filled as -1
| Pixel properties | Quadrant properties | ||||||
|---|---|---|---|---|---|---|---|
| Quadrant | DetID | PixID | Counts | Sigma | Mean | Median | Sigma |
| A | 13 | 6 | 22292 | 163.66 | 655 | 641 | 132.3 |
| A | 10 | 83 | 18699 | 136.5 | 655 | 641 | 132.3 |
| A | 13 | 254 | 10179 | 72.1 | 655 | 641 | 132.3 |
| B | 5 | 172 | 760403 | 6123.52 | 639 | 620 | 124.1 |
| B | 0 | 219 | 78552 | 628.1 | 639 | 620 | 124.1 |
| B | 0 | 189 | 73991 | 591.34 | 639 | 620 | 124.1 |
| C | 0 | 10 | 462980 | 3122.79 | 634 | 638 | 148.1 |
| C | 15 | 214 | 259488 | 1748.35 | 634 | 638 | 148.1 |
| C | 3 | 233 | 147398 | 991.26 | 634 | 638 | 148.1 |
| D | 8 | 230 | 2765953 | 18203.98 | 555 | 545 | 151.9 |
| D | 8 | 195 | 352321 | 2315.65 | 555 | 545 | 151.9 |
| D | 2 | 249 | 300732 | 1976.05 | 555 | 545 | 151.9 |
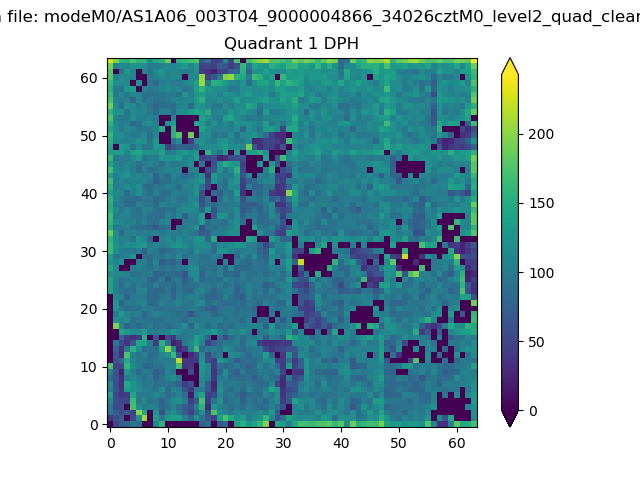
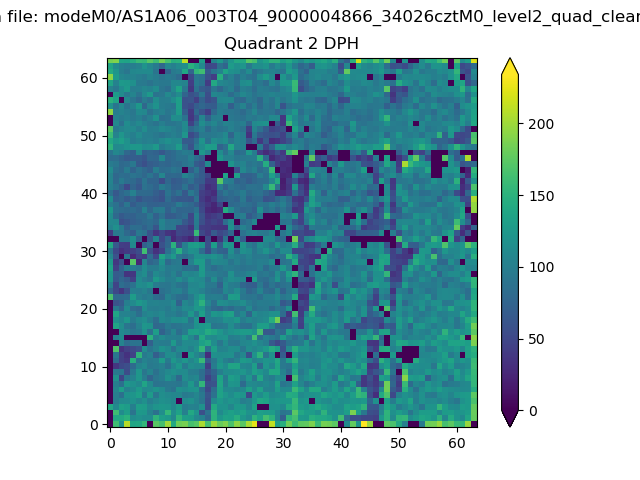
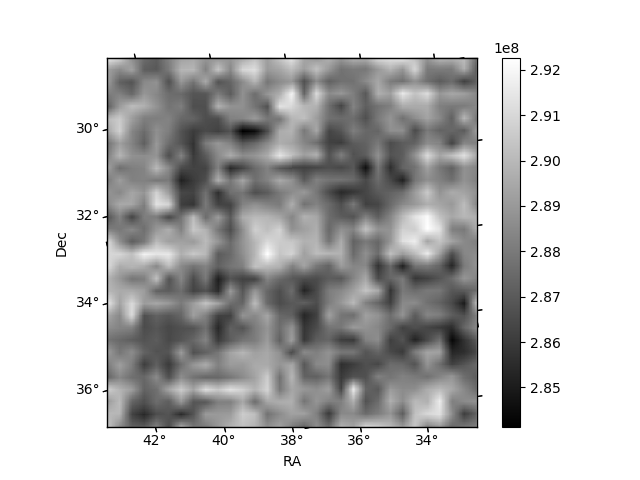
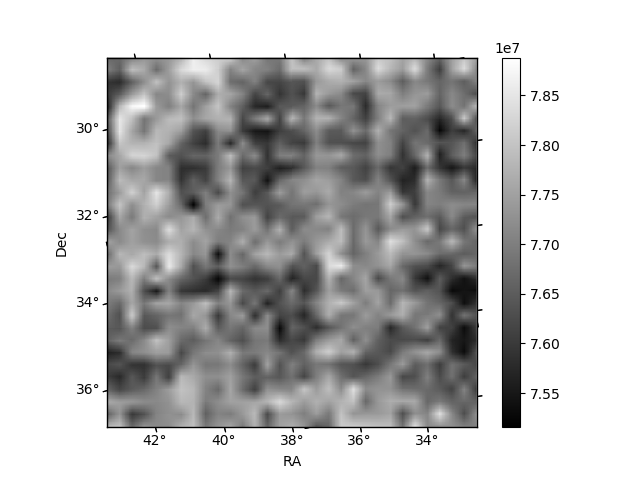
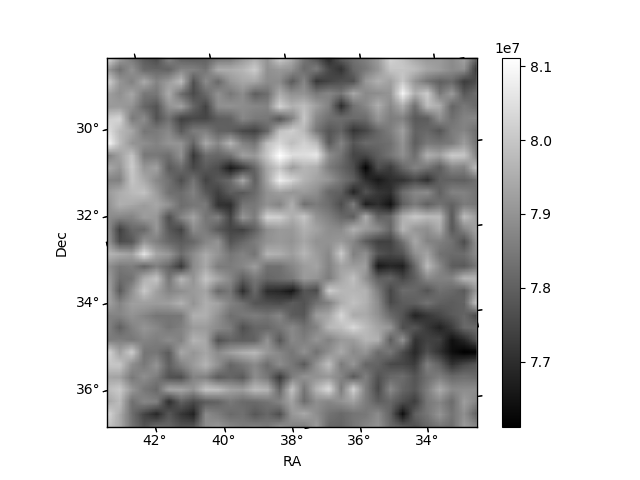
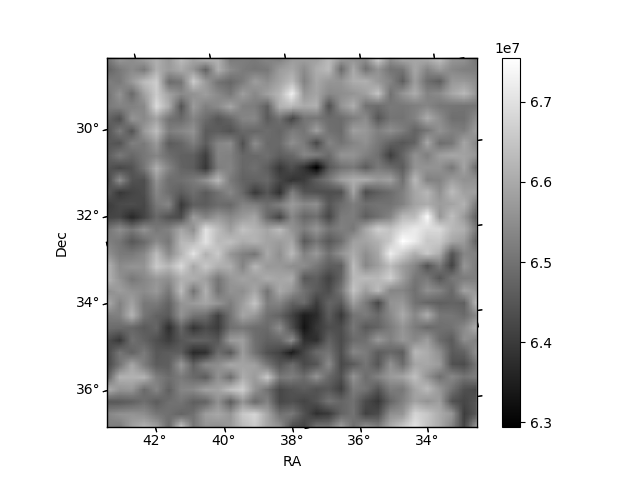
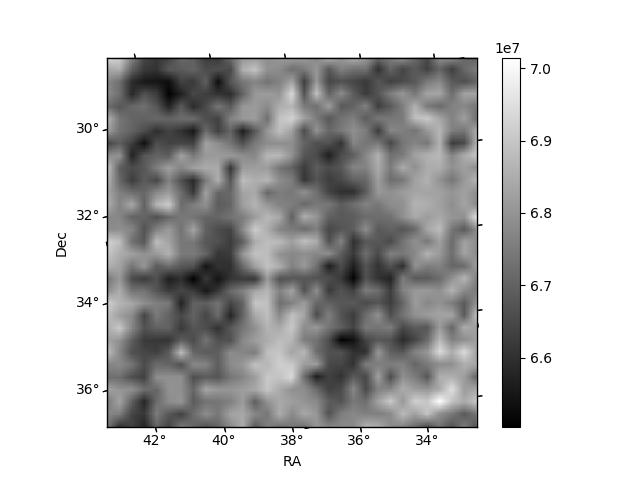
Histogram calculated using DETX and DETY for each event in the final _common_clean file
| Quadrant A | 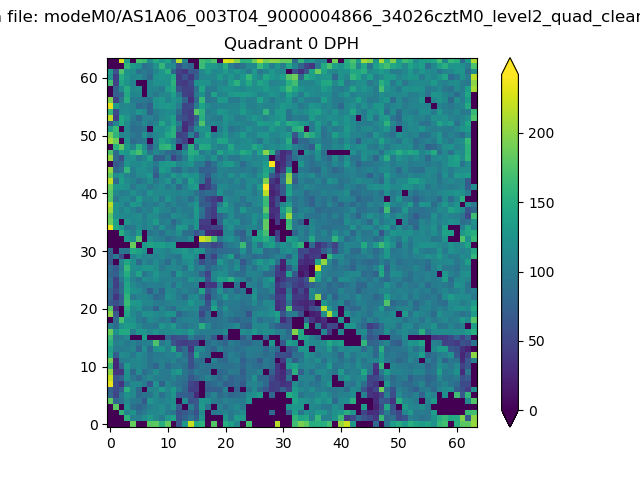 |
 |
Quadrant B |
|---|---|---|---|
| Quadrant D | 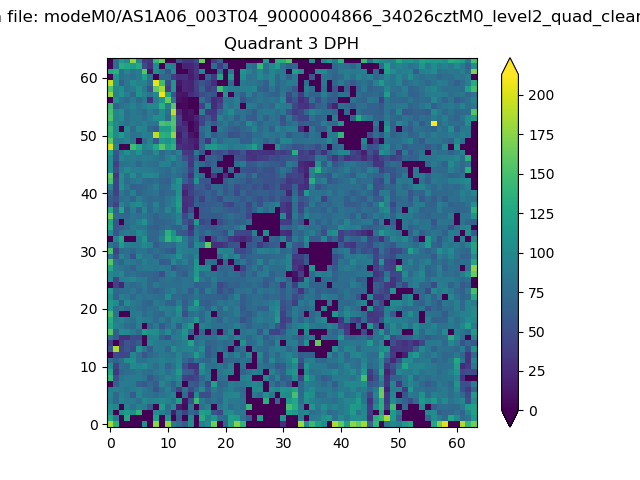 |
 |
Quadrant C |
| Plot type | Count rate plots | Images |
|---|---|---|
| Comparison with Poisson distribution Blue bars denote a histogram of data divided into 1 sec bins. Red curve is a Poisson curve with rate = median count rate of data. |
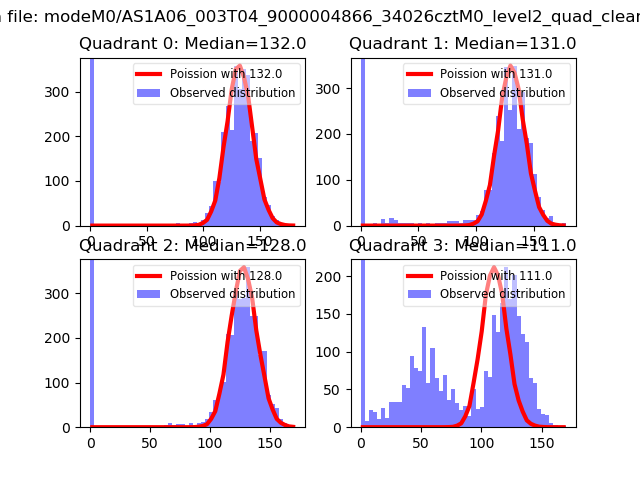 |
 |
| Quadrant-wise count rates Data is divided into 100 sec bins |
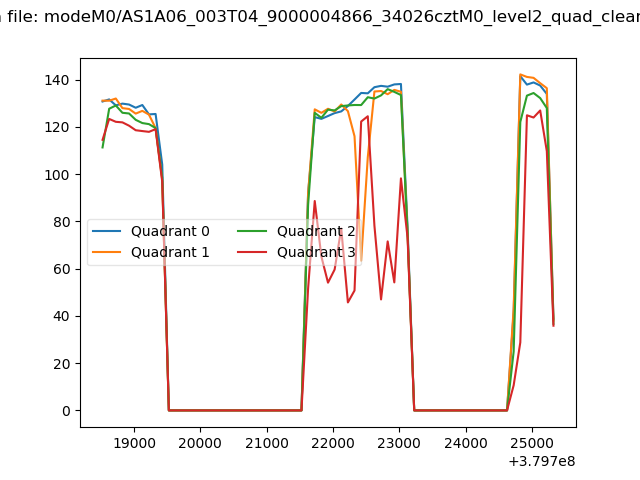 |
|
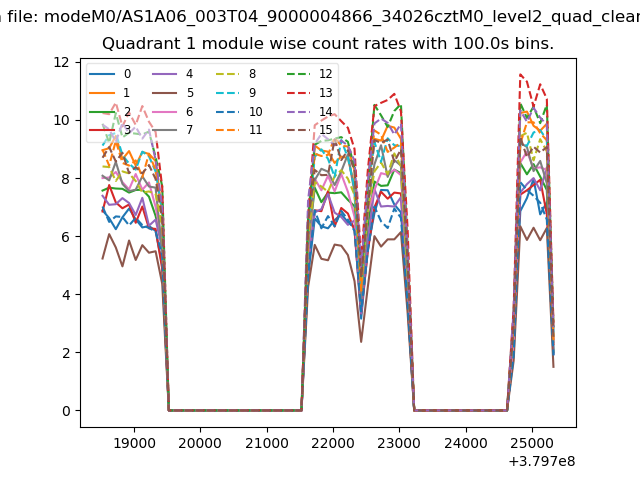
| Module-wise count rates for Quadrant A Data is divided into 100 sec bins |
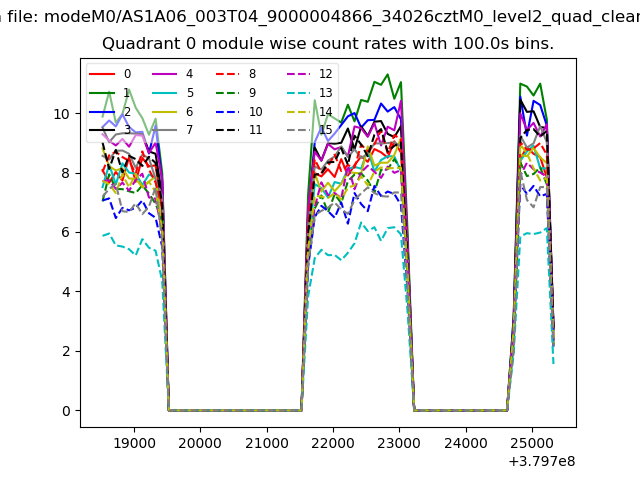 |
 |
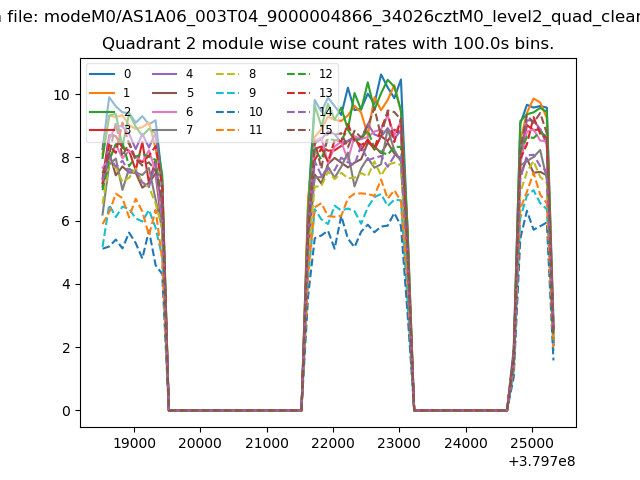
| Module-wise count rates for Quadrant B Data is divided into 100 sec bins |
 |
 |
| Module-wise count rates for Quadrant C Data is divided into 100 sec bins |
 |
 |
| Module-wise count rates for Quadrant D Data is divided into 100 sec bins |
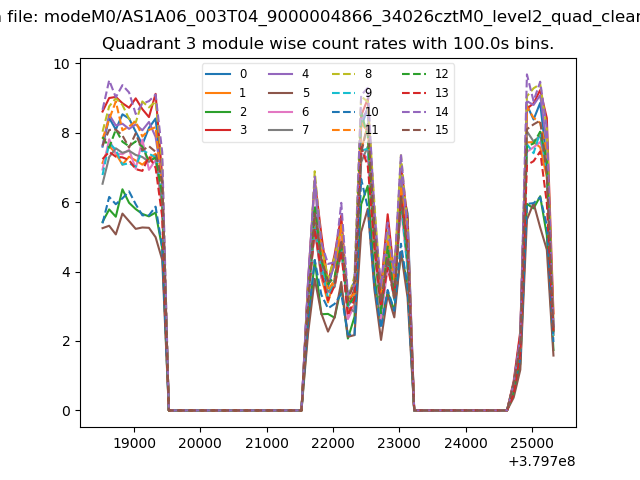 |
 |
| Parameter | Plot |
|---|---|
| CZT HV Monitor | 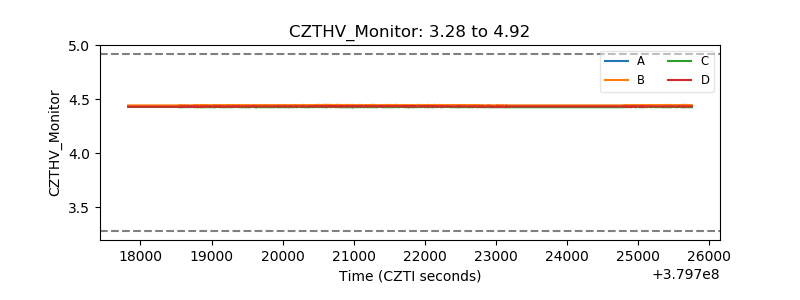 |
| D_VDD | 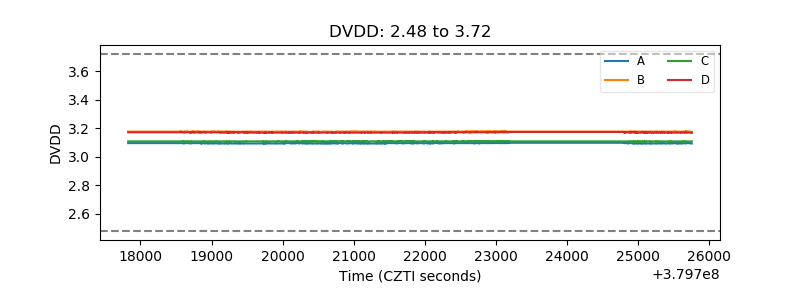 |
| Temperature 1 | 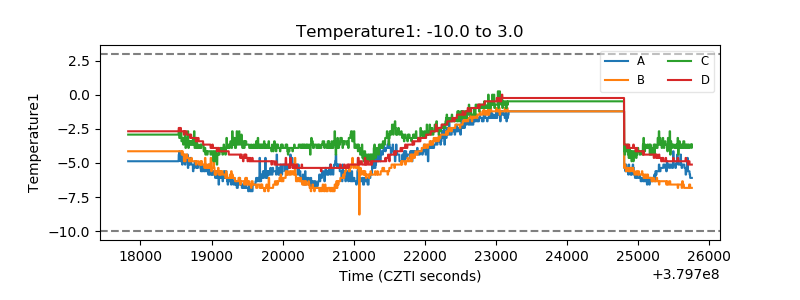 |
| Veto HV Monitor |  |
| Veto LLD | 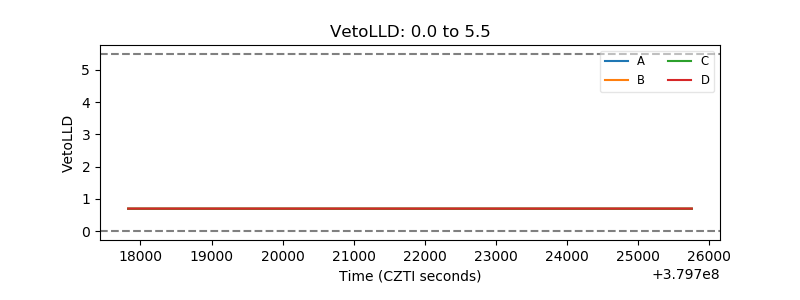 |
| Alpha Counter | 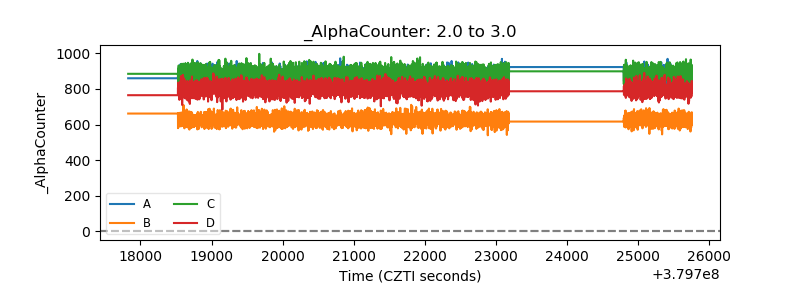 |
| _CPM_Rate | 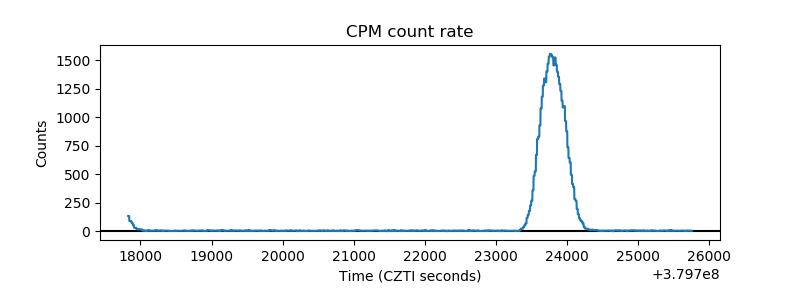 |
| CZT Counter | 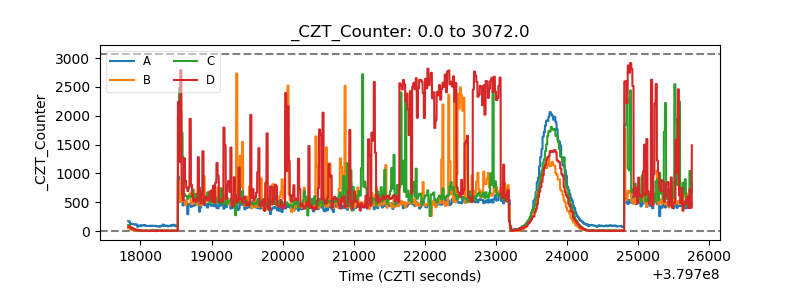 |
| +2.5 Volts monitor |  |
| +5 Volts monitor |  |
| _ROLL_ROT | 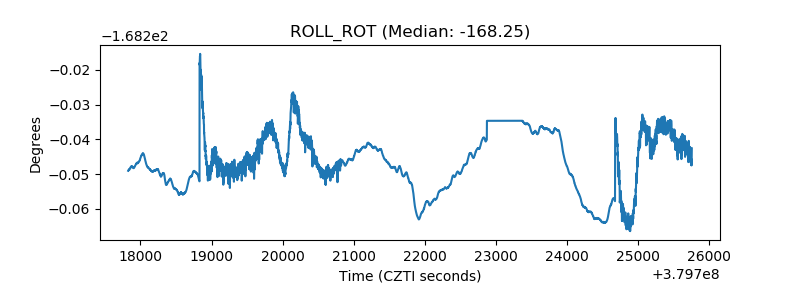 |
| _Roll_DEC | 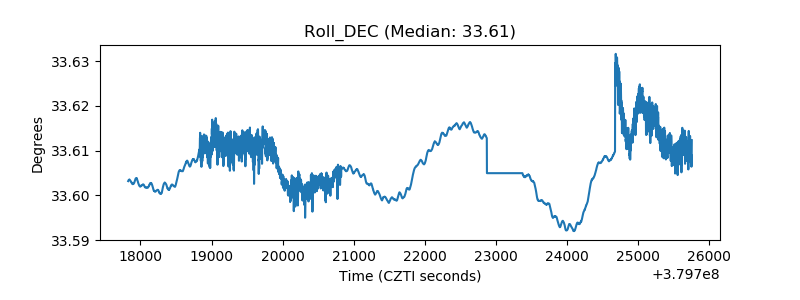 |
| _Roll_RA | 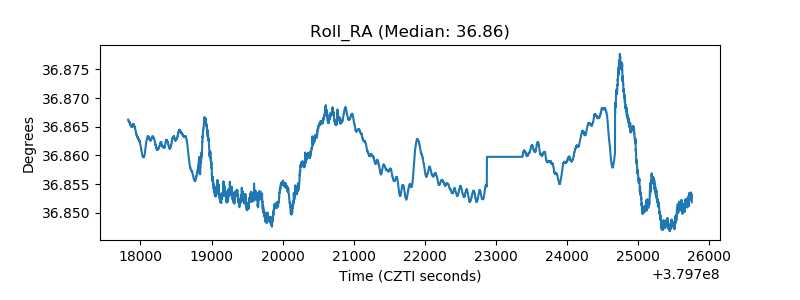 |
| Veto Counter | 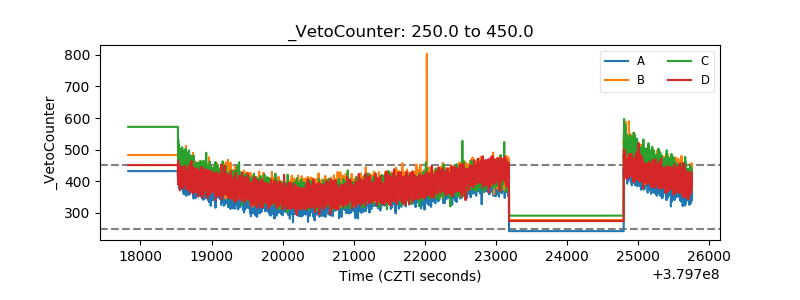 |