| Param | Original file | Final file |
|---|---|---|
| Filename | modeM0/AS1A06_003T04_9000004866_34028cztM0_level2.evt | modeM0/AS1A06_003T04_9000004866_34028cztM0_level2_quad_clean.evt |
| Size (bytes) | 521,285,760 | 56,191,680 |
| Size | 497.1 MB | 53.6 MB |
| Events in quadrant A | 2,667,670 | 340,787 |
| Events in quadrant B | 3,485,361 | 337,376 |
| Events in quadrant C | 4,443,859 | 326,392 |
| Events in quadrant D | 4,808,321 | 302,416 |
| Mode M9 | |||
|---|---|---|---|
| Quadrant | BADHDUFLAG | Total packets | Discarded packets |
| A | 0 | 31 | 0 |
| B | 0 | 31 | 0 |
| C | 0 | 31 | 0 |
| D | 0 | 32 | 0 |
| Mode M0 | |||
|---|---|---|---|
| Quadrant | BADHDUFLAG | Total packets | Discarded packets |
| A | 0 | 11469 | 3 |
| B | 0 | 14070 | 2 |
| C | 0 | 17028 | 2 |
| D | 0 | 18054 | 2 |
| Mode SS | |||
|---|---|---|---|
| Quadrant | BADHDUFLAG | Total packets | Discarded packets |
| A | 0 | 114 | 0 |
| B | 0 | 114 | 0 |
| C | 0 | 114 | 0 |
| D | 0 | 114 | 0 |
| Quadrant | Total seconds | Saturated seconds | Saturation percentage |
|---|---|---|---|
| A | 5637 | 10 | 0.177399% |
| B | 5637 | 132 | 2.341671% |
| C | 5637 | 266 | 4.718822% |
| D | 5637 | 553 | 9.810183% |
Noise dominated data is calculated using 1-second bins in cleaned event files. If a bin has >2000 counts, and if more than 50% of those come from <1% of pixels, then it is considered to be noise-dominated and hence unusable.
| Quadrant | # 1 sec bins | Bins with >0 counts | Bins with >2000 counts | High rate bins dominated by noise | Noise dominated (total time) | Noise dominated (detector-on time) | Marked lightcurve |
|---|---|---|---|---|---|---|---|
| A | 7369 | 5636 | 0 | 0 | 0.00% | 0.00% | 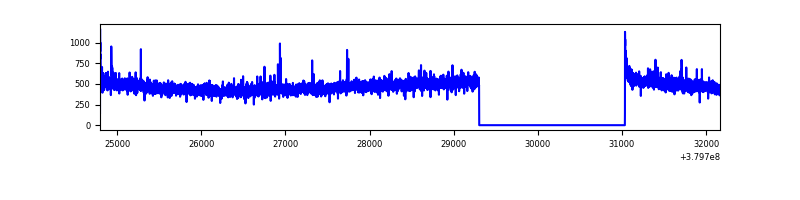 |
| B | 7370 | 5638 | 82 | 82 | 1.11% | 1.45% | 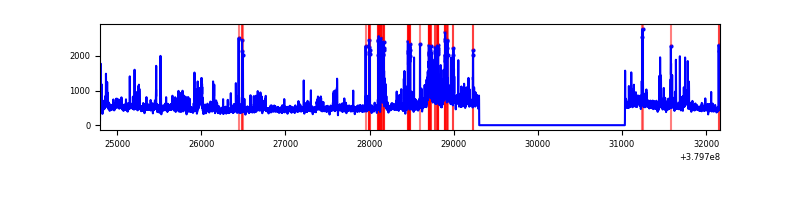 |
| C | 7370 | 5638 | 231 | 231 | 3.13% | 4.10% | 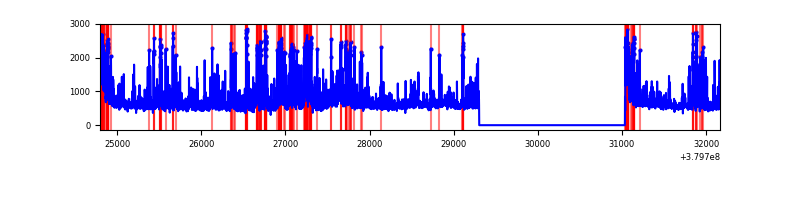 |
| D | 7370 | 5638 | 538 | 538 | 7.30% | 9.54% | 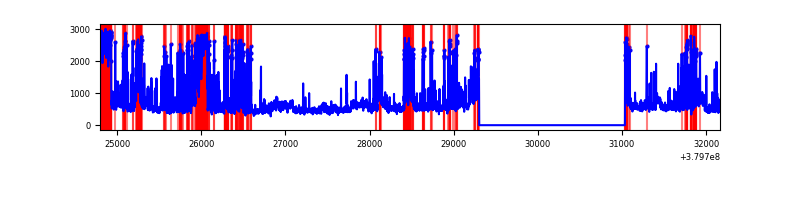 |
Top three noisy pixels from each quadrant. If the there are fewer than three noisy pixels in the level2.evt file, extra rows are filled as -1
| Pixel properties | Quadrant properties | ||||||
|---|---|---|---|---|---|---|---|
| Quadrant | DetID | PixID | Counts | Sigma | Mean | Median | Sigma |
| A | 13 | 6 | 19432 | 139.45 | 672 | 657 | 134.6 |
| A | 10 | 83 | 17802 | 127.34 | 672 | 657 | 134.6 |
| A | 15 | 169 | 13408 | 94.7 | 672 | 657 | 134.6 |
| B | 5 | 172 | 323937 | 2533.67 | 668 | 651 | 127.6 |
| B | 15 | 222 | 125926 | 981.81 | 668 | 651 | 127.6 |
| B | 0 | 189 | 124311 | 969.15 | 668 | 651 | 127.6 |
| C | 4 | 254 | 742988 | 4942.45 | 646 | 653 | 150.2 |
| C | 0 | 10 | 559596 | 3721.43 | 646 | 653 | 150.2 |
| C | 3 | 233 | 271889 | 1805.88 | 646 | 653 | 150.2 |
| D | 13 | 249 | 470644 | 2799.02 | 622 | 609 | 167.9 |
| D | 10 | 118 | 397607 | 2364.09 | 622 | 609 | 167.9 |
| D | 8 | 195 | 395127 | 2349.32 | 622 | 609 | 167.9 |
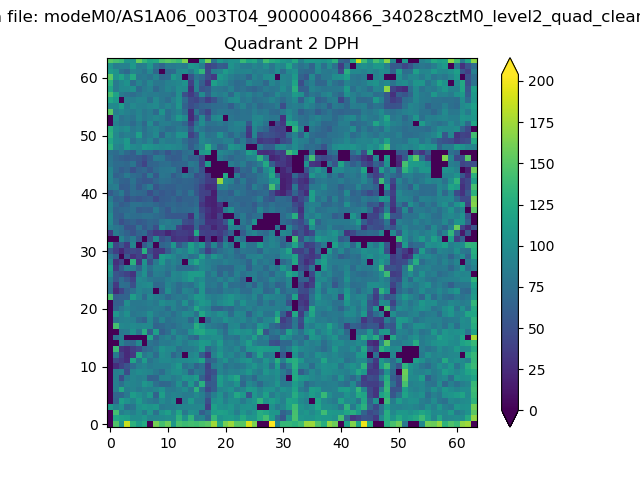
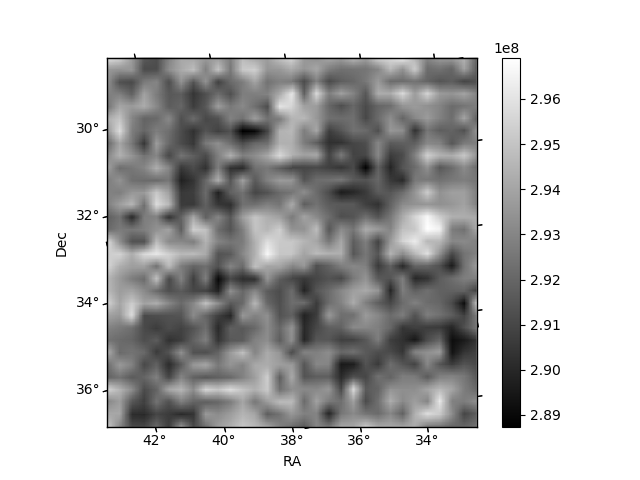
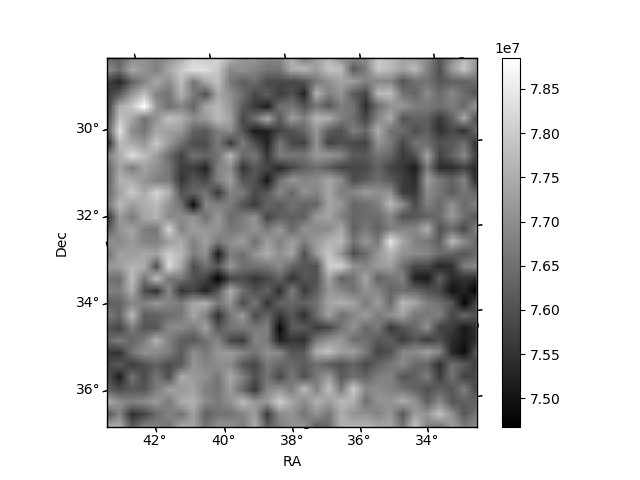
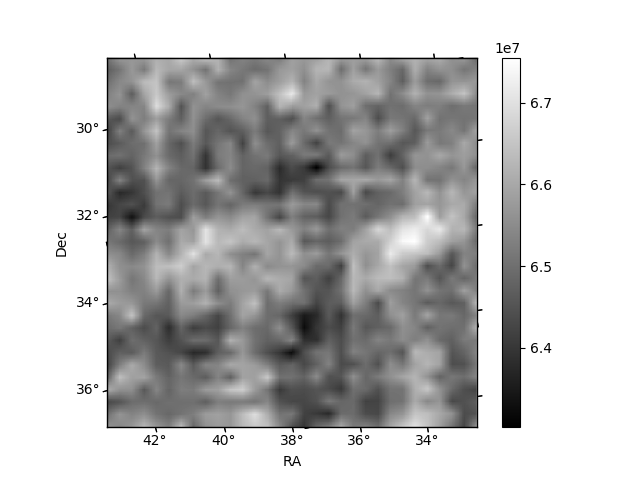
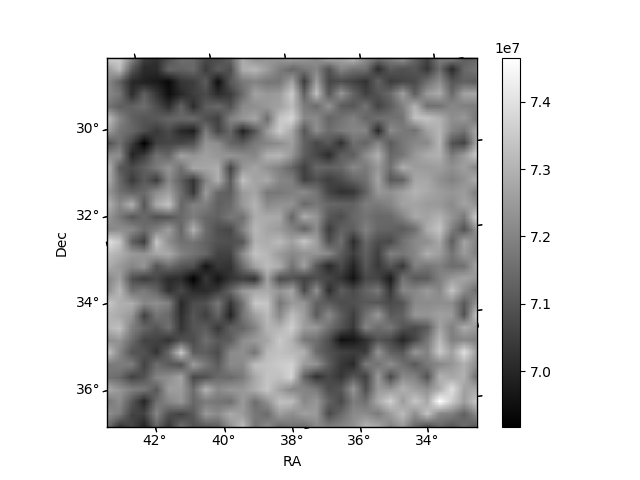
Histogram calculated using DETX and DETY for each event in the final _common_clean file
| Quadrant A | 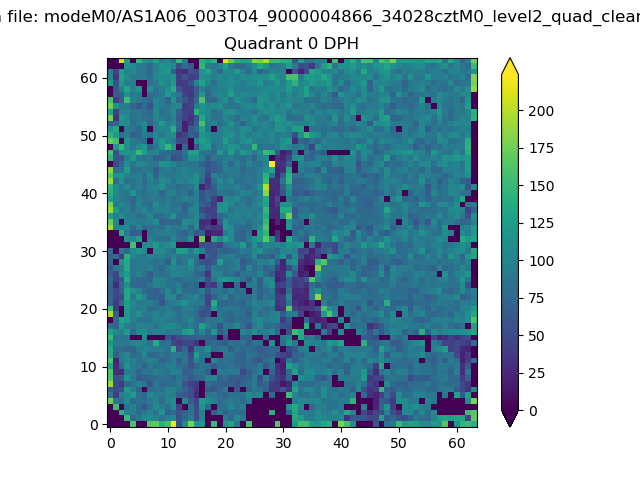 |
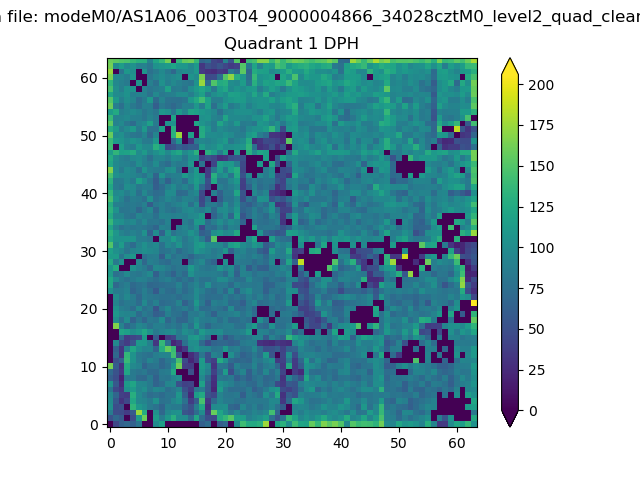 |
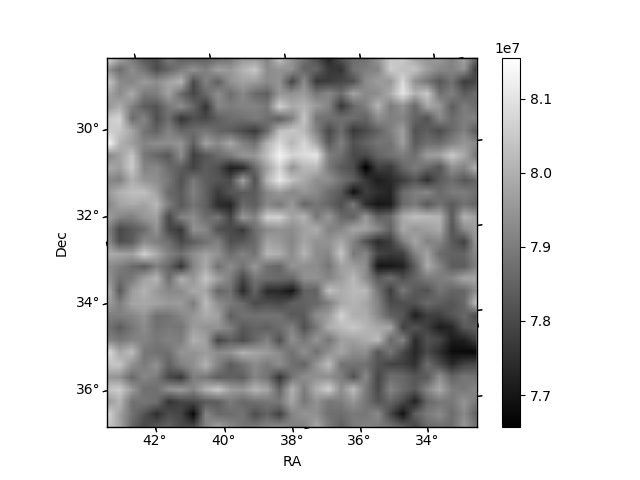
Quadrant B |
|---|---|---|---|
| Quadrant D | 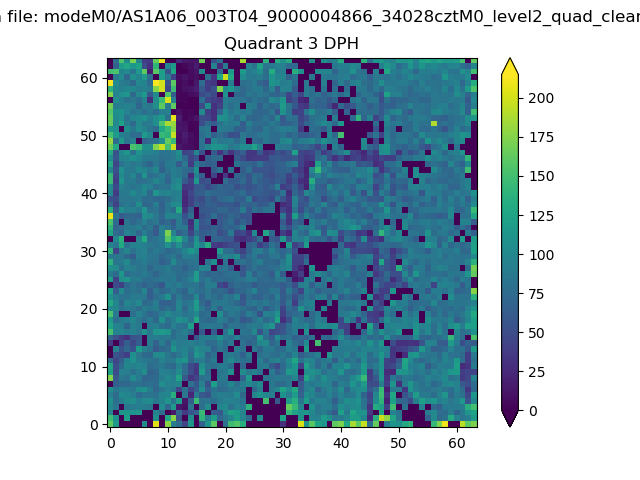 |
 |
Quadrant C |
| Plot type | Count rate plots | Images |
|---|---|---|
| Comparison with Poisson distribution Blue bars denote a histogram of data divided into 1 sec bins. Red curve is a Poisson curve with rate = median count rate of data. |
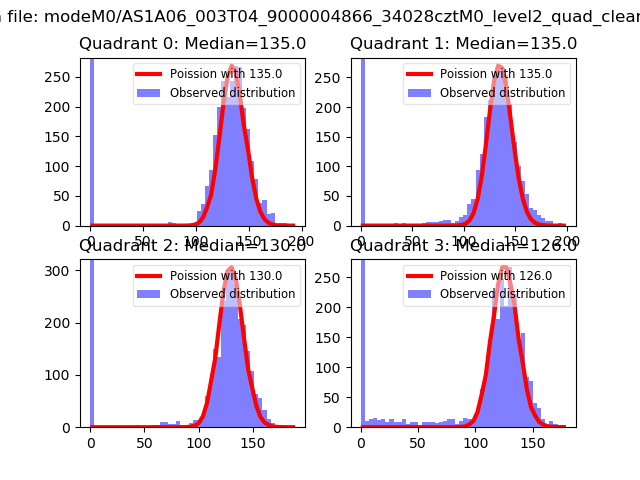 |
 |
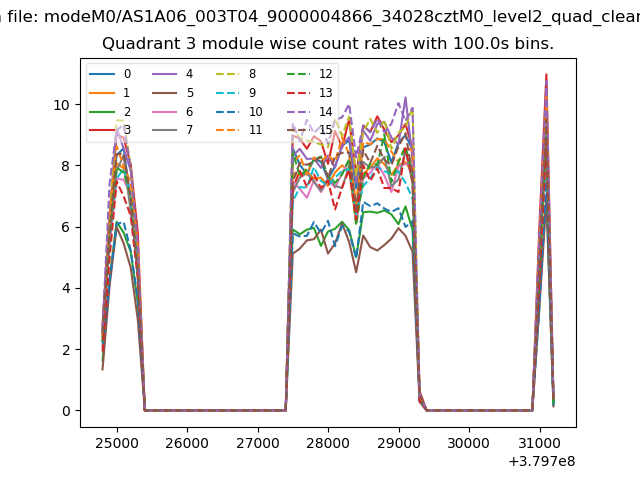
| Quadrant-wise count rates Data is divided into 100 sec bins |
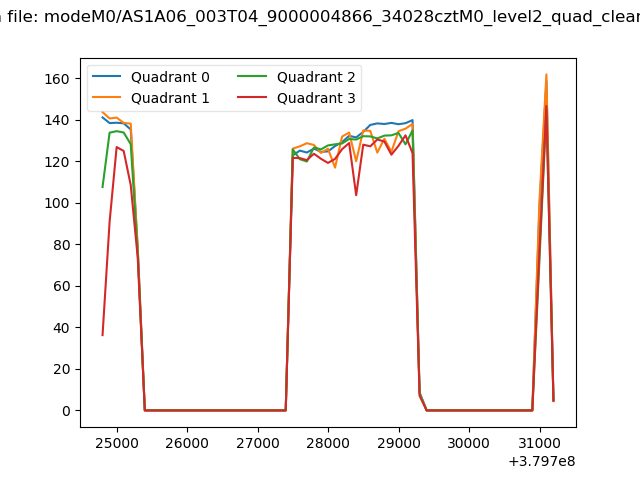 |
|
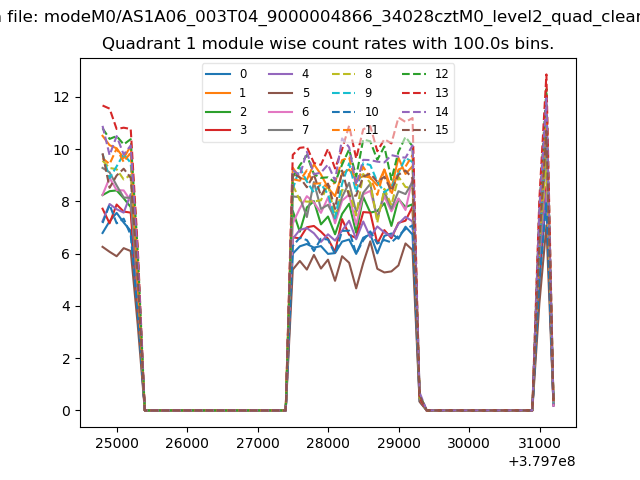
| Module-wise count rates for Quadrant A Data is divided into 100 sec bins |
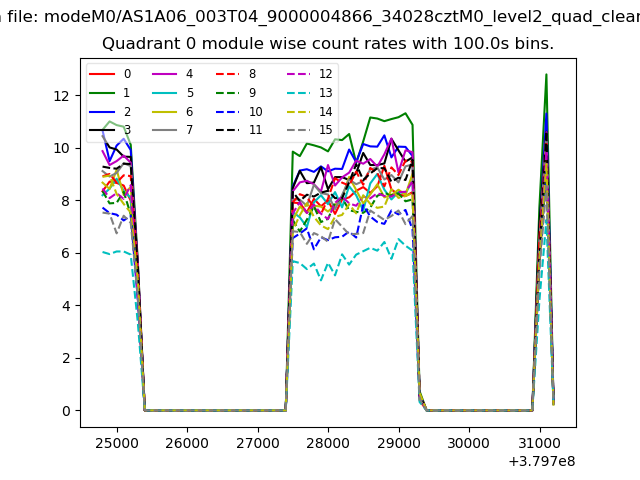 |
 |
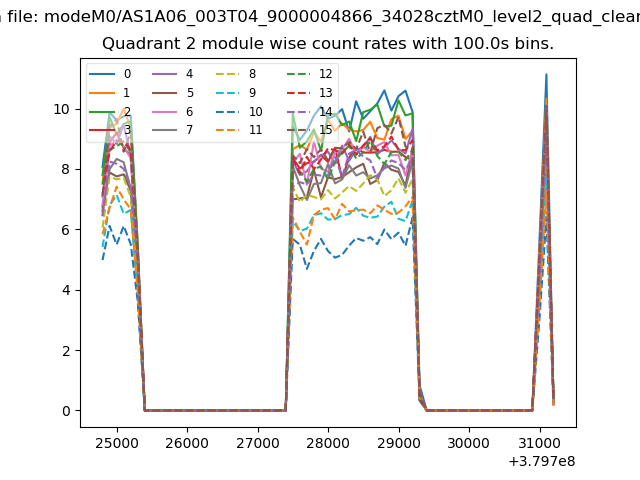
| Module-wise count rates for Quadrant B Data is divided into 100 sec bins |
 |
 |
| Module-wise count rates for Quadrant C Data is divided into 100 sec bins |
 |
 |
| Module-wise count rates for Quadrant D Data is divided into 100 sec bins |
 |
 |
| Parameter | Plot |
|---|---|
| CZT HV Monitor | 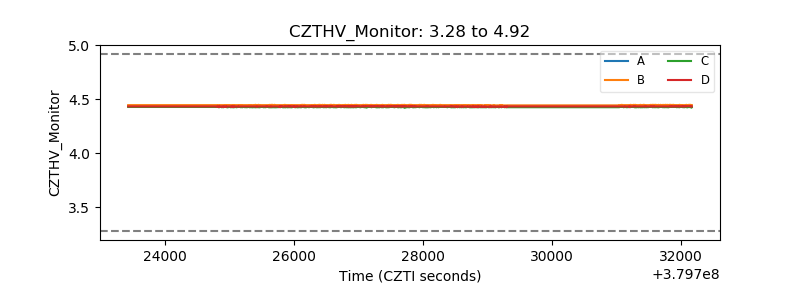 |
| D_VDD | 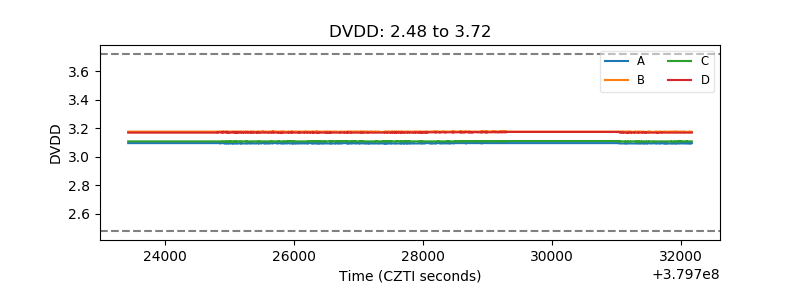 |
| Temperature 1 | 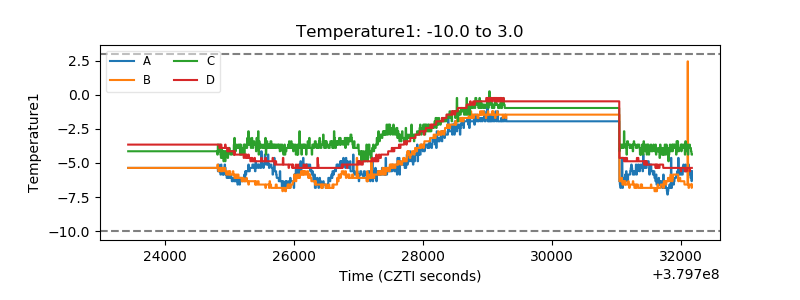 |
| Veto HV Monitor |  |
| Veto LLD | 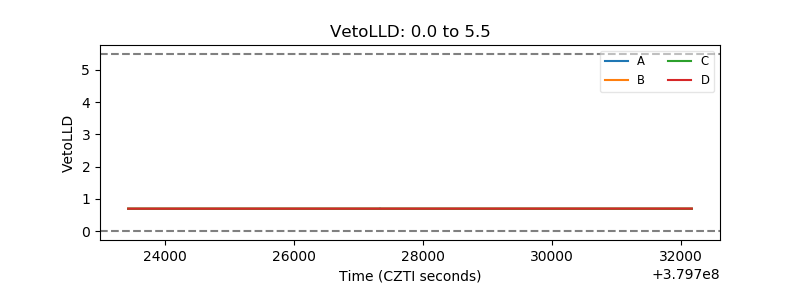 |
| Alpha Counter | 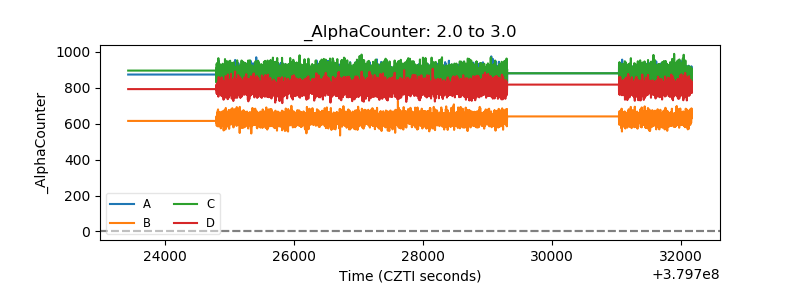 |
| _CPM_Rate | 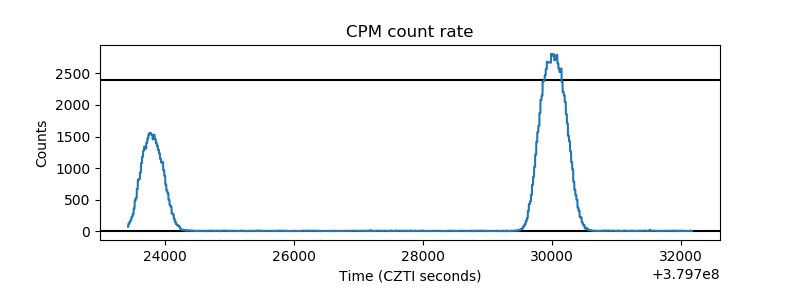 |
| CZT Counter | 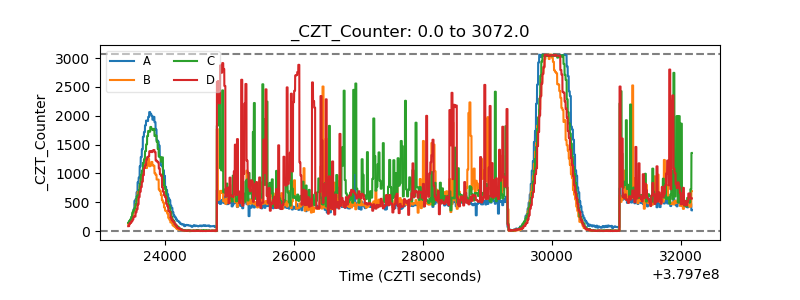 |
| +2.5 Volts monitor |  |
| +5 Volts monitor | 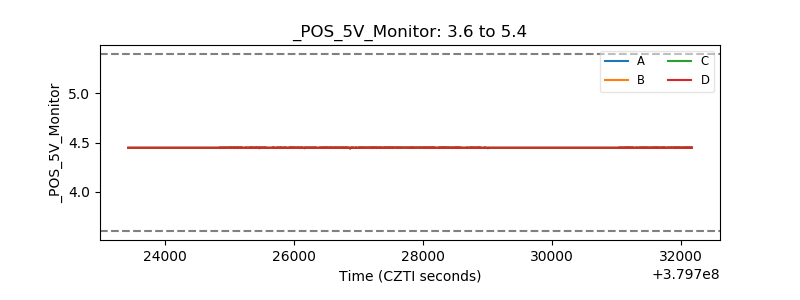 |
| _ROLL_ROT | 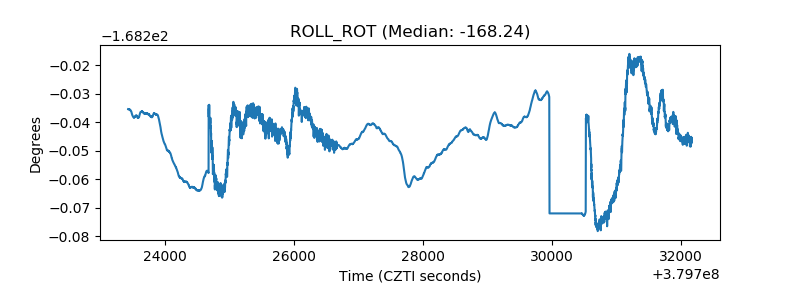 |
| _Roll_DEC | 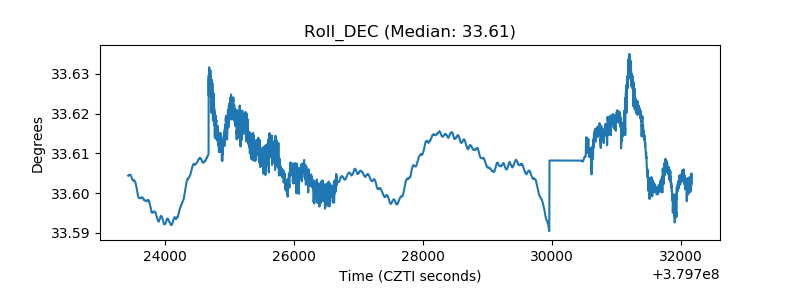 |
| _Roll_RA |  |
| Veto Counter | 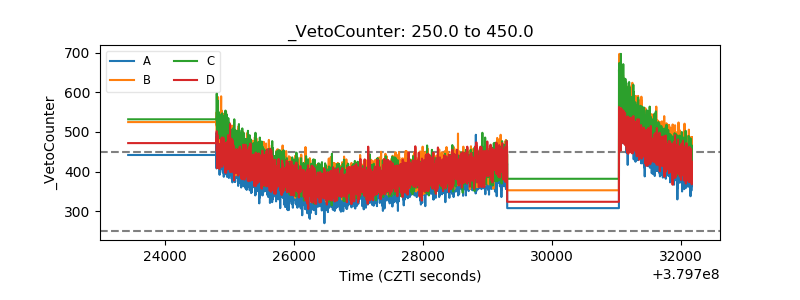 |