| Param | Original file | Final file |
|---|---|---|
| Filename | modeM0/AS1A06_003T04_9000004866_34029cztM0_level2.evt | modeM0/AS1A06_003T04_9000004866_34029cztM0_level2_quad_clean.evt |
| Size (bytes) | 497,658,240 | 52,418,880 |
| Size | 474.6 MB | 50.0 MB |
| Events in quadrant A | 2,753,378 | 312,425 |
| Events in quadrant B | 3,432,539 | 310,375 |
| Events in quadrant C | 4,362,425 | 304,153 |
| Events in quadrant D | 4,161,759 | 286,343 |
| Mode M9 | |||
|---|---|---|---|
| Quadrant | BADHDUFLAG | Total packets | Discarded packets |
| A | 0 | 23 | 0 |
| B | 0 | 23 | 0 |
| C | 0 | 23 | 0 |
| D | 0 | 24 | 0 |
| Mode M0 | |||
|---|---|---|---|
| Quadrant | BADHDUFLAG | Total packets | Discarded packets |
| A | 0 | 11402 | 3 |
| B | 0 | 13690 | 2 |
| C | 0 | 16420 | 2 |
| D | 0 | 16049 | 2 |
| Mode SS | |||
|---|---|---|---|
| Quadrant | BADHDUFLAG | Total packets | Discarded packets |
| A | 0 | 108 | 0 |
| B | 0 | 108 | 0 |
| C | 0 | 108 | 0 |
| D | 0 | 108 | 0 |
| Quadrant | Total seconds | Saturated seconds | Saturation percentage |
|---|---|---|---|
| A | 5335 | 16 | 0.299906% |
| B | 5335 | 126 | 2.361762% |
| C | 5335 | 387 | 7.253983% |
| D | 5335 | 310 | 5.810684% |
Noise dominated data is calculated using 1-second bins in cleaned event files. If a bin has >2000 counts, and if more than 50% of those come from <1% of pixels, then it is considered to be noise-dominated and hence unusable.
| Quadrant | # 1 sec bins | Bins with >0 counts | Bins with >2000 counts | High rate bins dominated by noise | Noise dominated (total time) | Noise dominated (detector-on time) | Marked lightcurve |
|---|---|---|---|---|---|---|---|
| A | 7188 | 5336 | 8 | 8 | 0.11% | 0.15% | 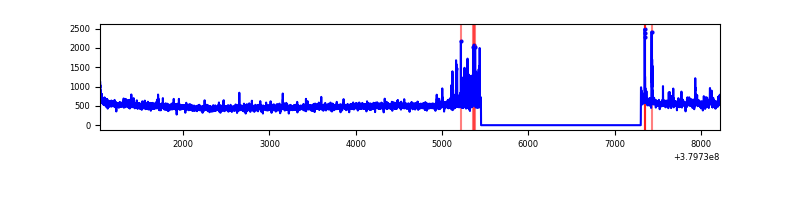 |
| B | 7188 | 5335 | 97 | 97 | 1.35% | 1.82% | 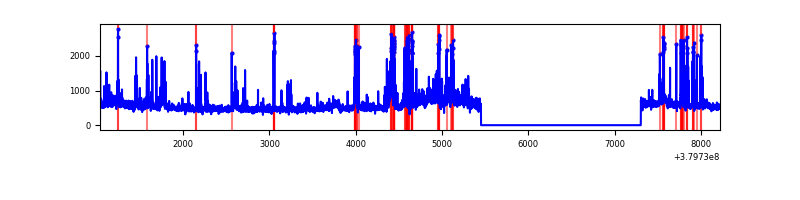 |
| C | 7188 | 5336 | 323 | 323 | 4.49% | 6.05% | 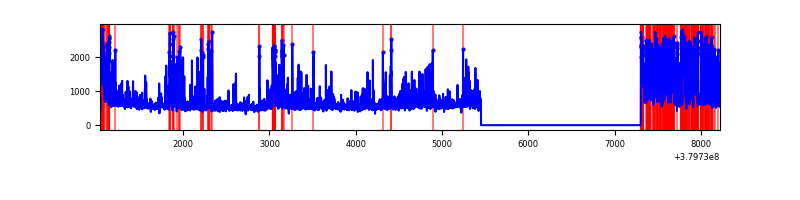 |
| D | 7188 | 5336 | 255 | 255 | 3.55% | 4.78% | 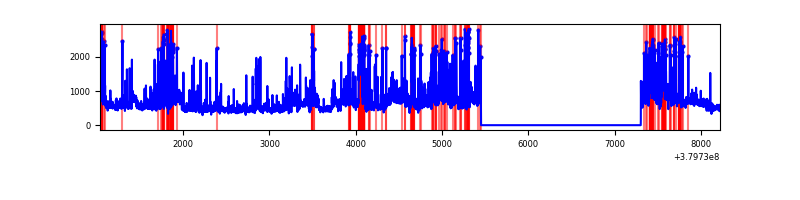 |
Top three noisy pixels from each quadrant. If the there are fewer than three noisy pixels in the level2.evt file, extra rows are filled as -1
| Pixel properties | Quadrant properties | ||||||
|---|---|---|---|---|---|---|---|
| Quadrant | DetID | PixID | Counts | Sigma | Mean | Median | Sigma |
| A | 15 | 169 | 88532 | 664.19 | 667 | 655 | 132.3 |
| A | 0 | 31 | 52621 | 392.77 | 667 | 655 | 132.3 |
| A | 10 | 83 | 17709 | 128.9 | 667 | 655 | 132.3 |
| B | 5 | 172 | 443483 | 3529.79 | 660 | 644 | 125.5 |
| B | 0 | 189 | 151274 | 1200.64 | 660 | 644 | 125.5 |
| B | 0 | 219 | 77391 | 611.74 | 660 | 644 | 125.5 |
| C | 4 | 254 | 1060115 | 7392.51 | 624 | 630 | 143.3 |
| C | 0 | 10 | 403929 | 2814.0 | 624 | 630 | 143.3 |
| C | 15 | 214 | 241698 | 1682.04 | 624 | 630 | 143.3 |
| D | 8 | 195 | 491083 | 3167.8 | 628 | 611 | 154.8 |
| D | 2 | 249 | 363980 | 2346.88 | 628 | 611 | 154.8 |
| D | 10 | 118 | 323802 | 2087.39 | 628 | 611 | 154.8 |
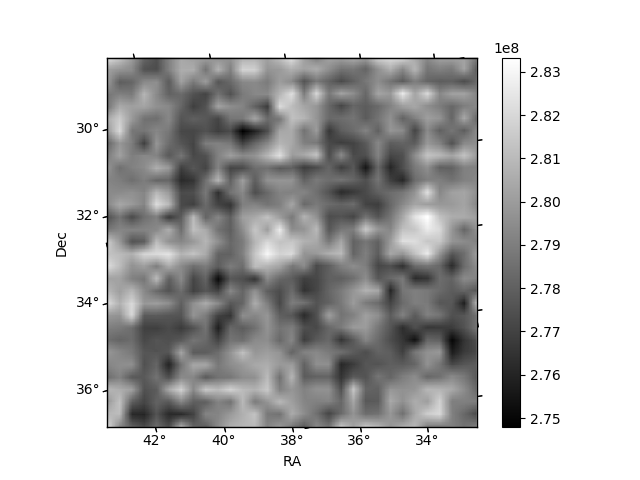
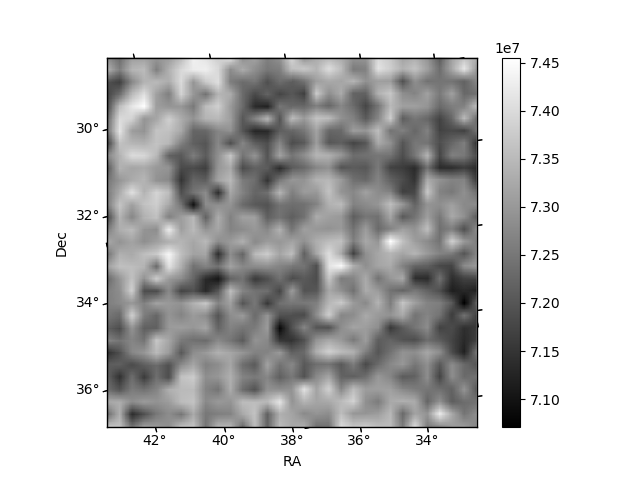
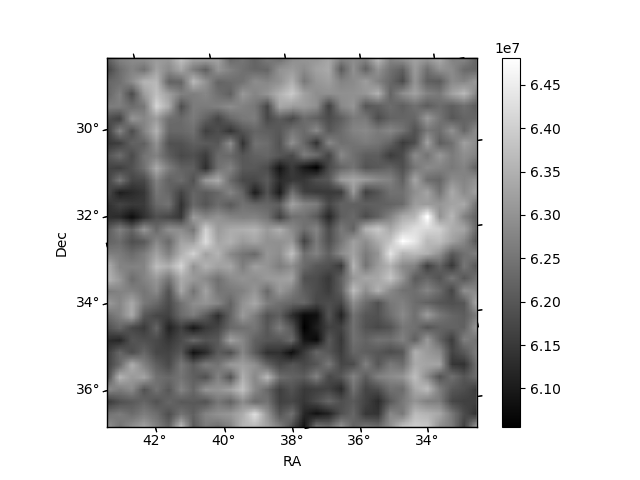
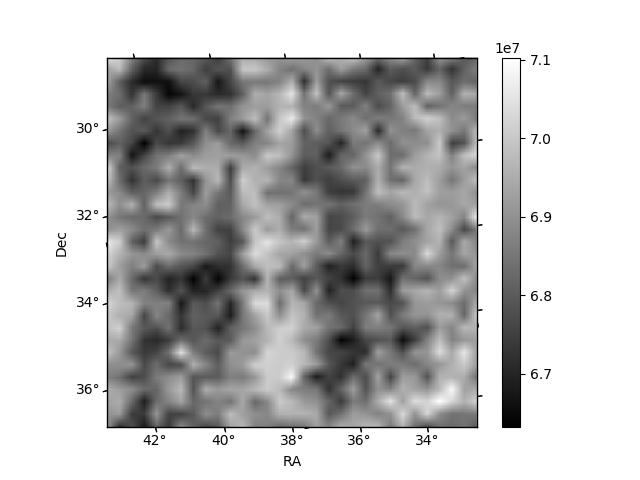
Histogram calculated using DETX and DETY for each event in the final _common_clean file
| Quadrant A | 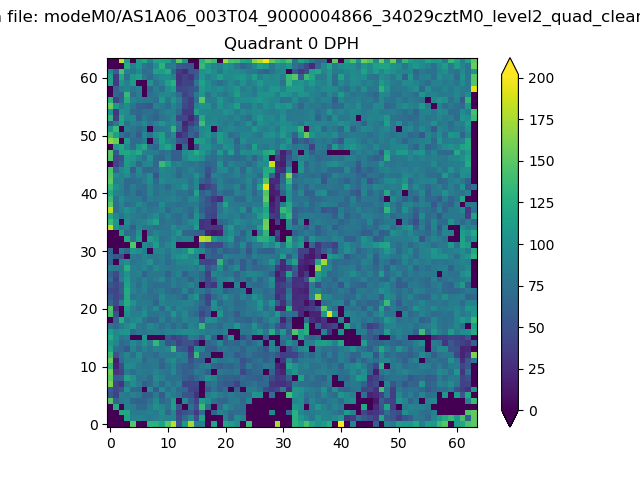 |
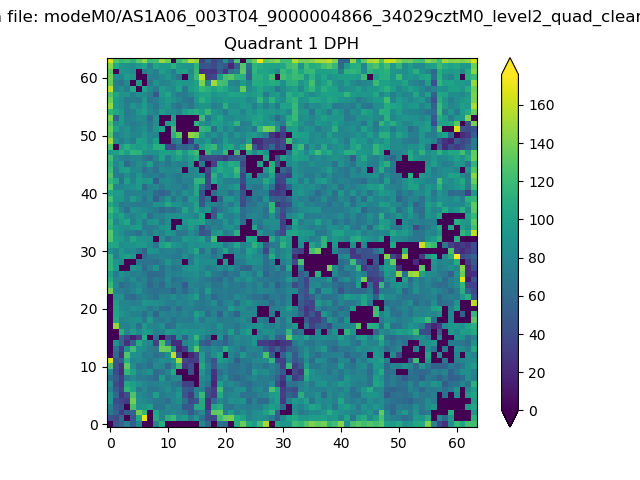 |
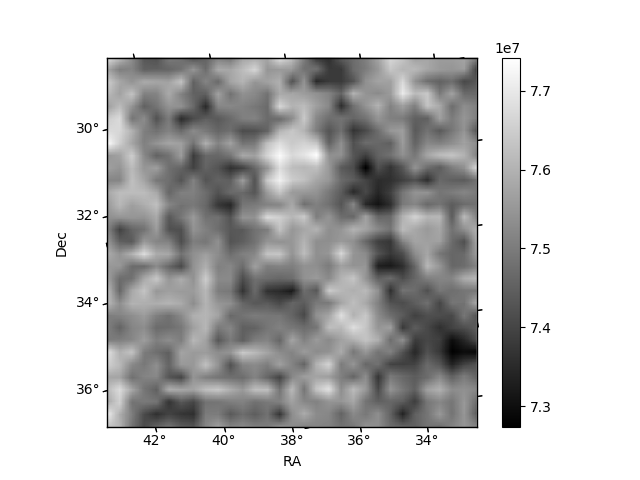
Quadrant B |
|---|---|---|---|
| Quadrant D | 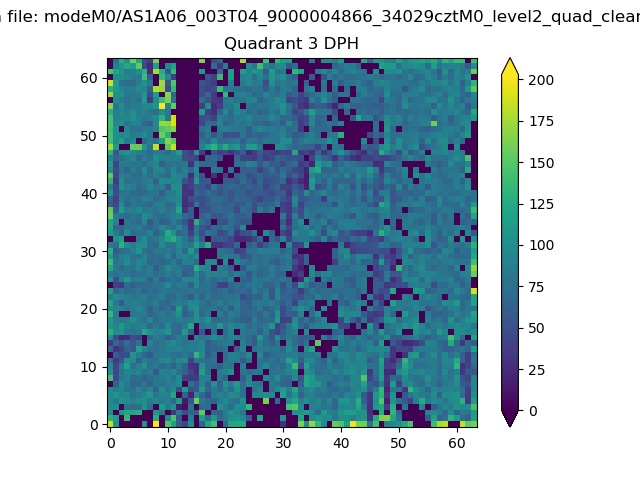 |
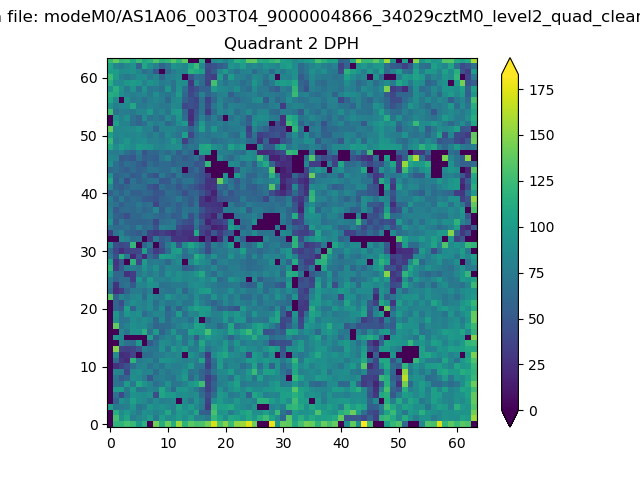 |
Quadrant C |
| Plot type | Count rate plots | Images |
|---|---|---|
| Comparison with Poisson distribution Blue bars denote a histogram of data divided into 1 sec bins. Red curve is a Poisson curve with rate = median count rate of data. |
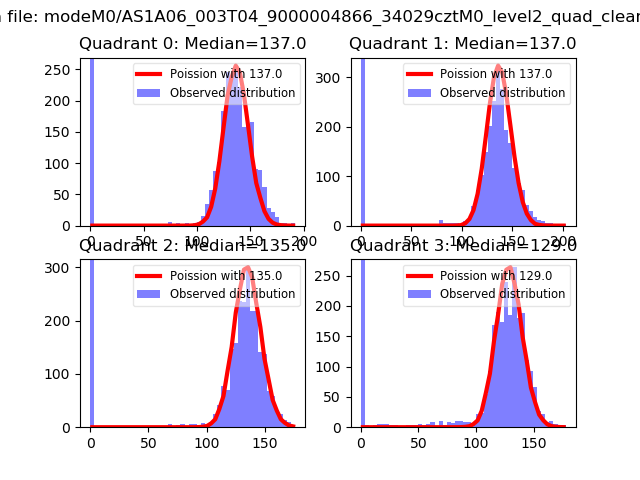 |
 |
| Quadrant-wise count rates Data is divided into 100 sec bins |
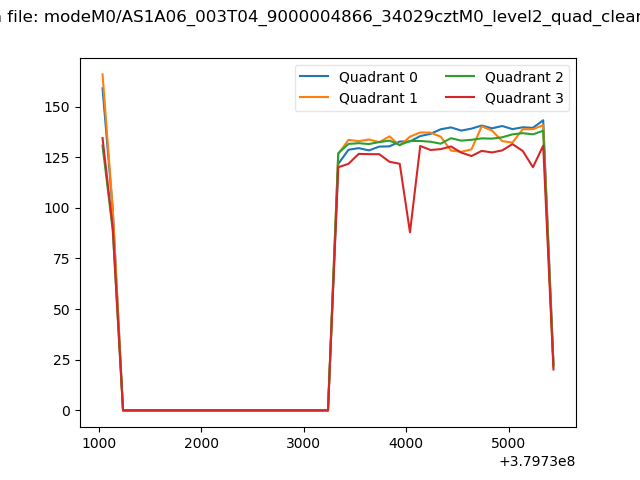 |
|
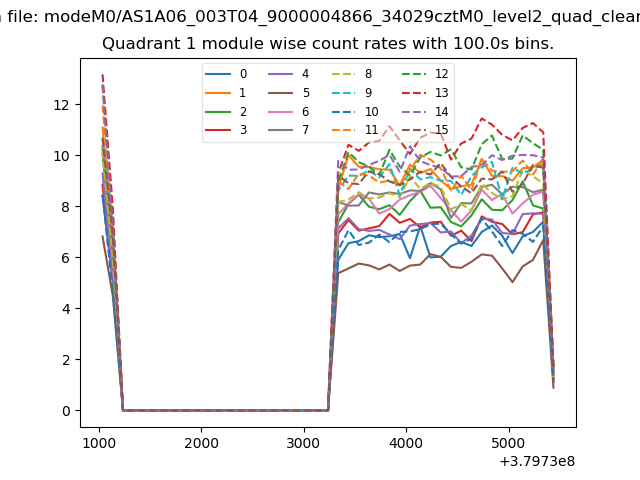
| Module-wise count rates for Quadrant A Data is divided into 100 sec bins |
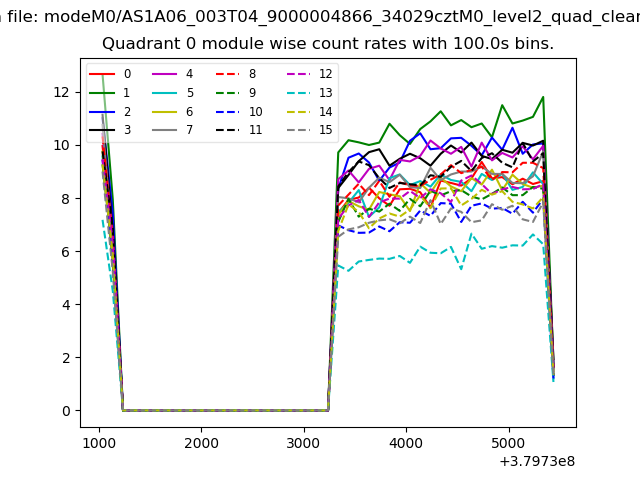 |
 |
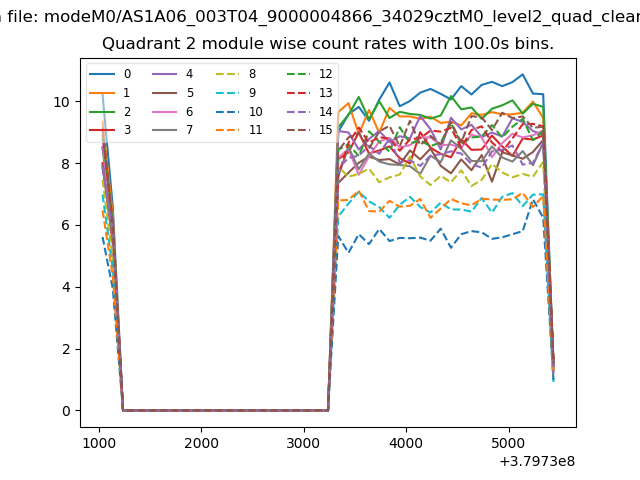
| Module-wise count rates for Quadrant B Data is divided into 100 sec bins |
 |
 |
| Module-wise count rates for Quadrant C Data is divided into 100 sec bins |
 |
 |
| Module-wise count rates for Quadrant D Data is divided into 100 sec bins |
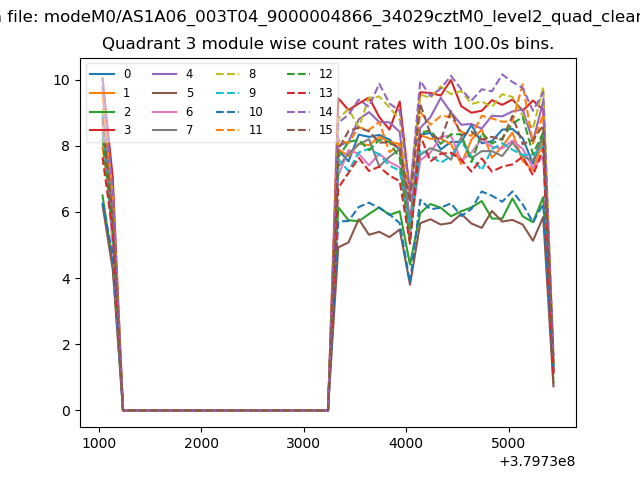 |
 |
| Parameter | Plot |
|---|---|
| CZT HV Monitor | 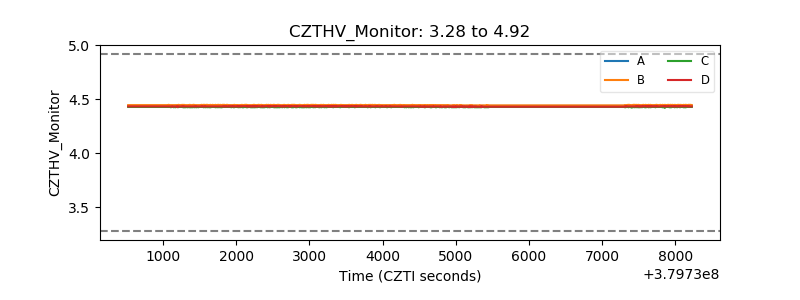 |
| D_VDD | 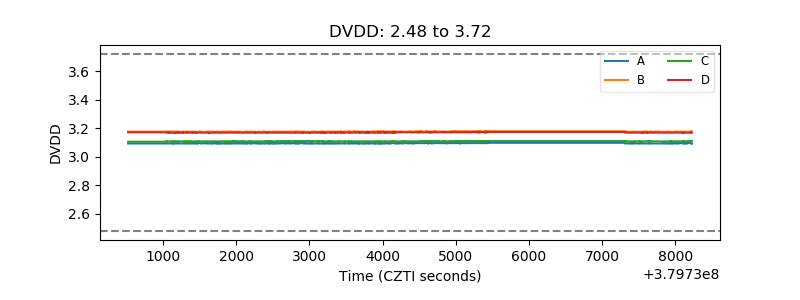 |
| Temperature 1 | 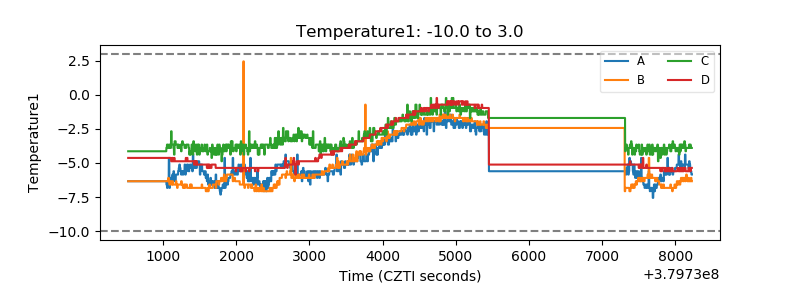 |
| Veto HV Monitor | 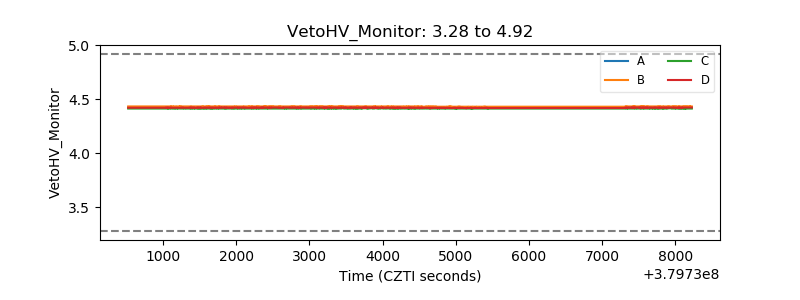 |
| Veto LLD | 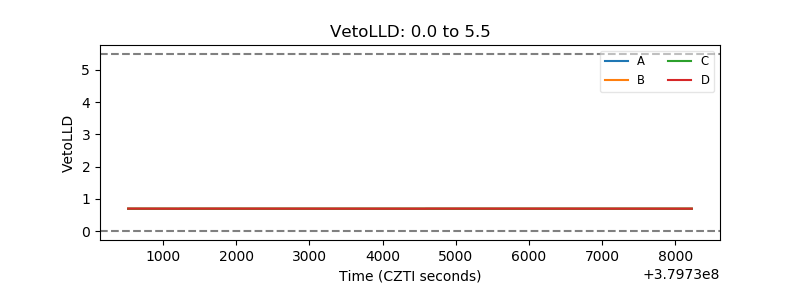 |
| Alpha Counter | 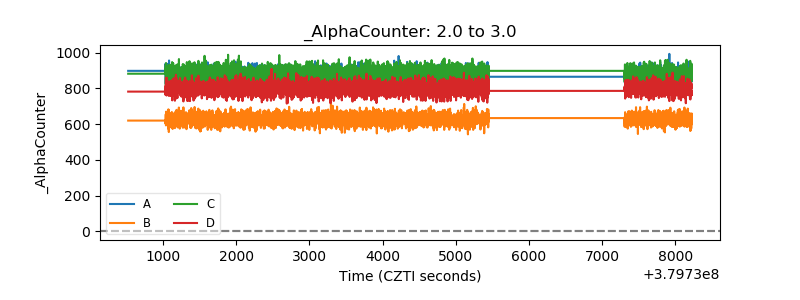 |
| _CPM_Rate | 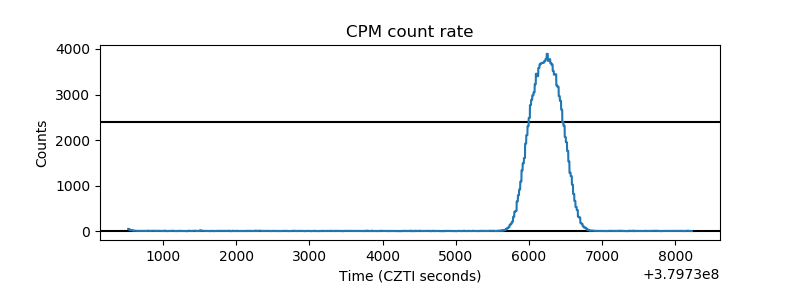 |
| CZT Counter | 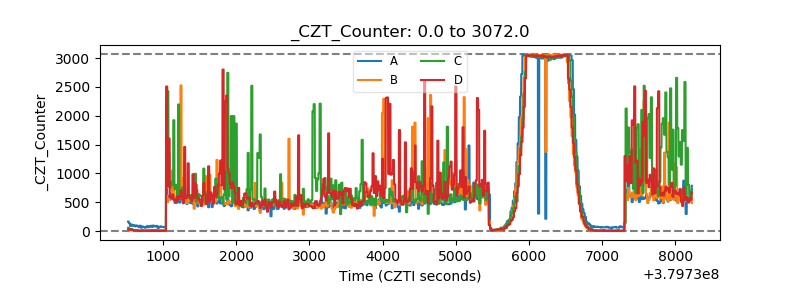 |
| +2.5 Volts monitor | 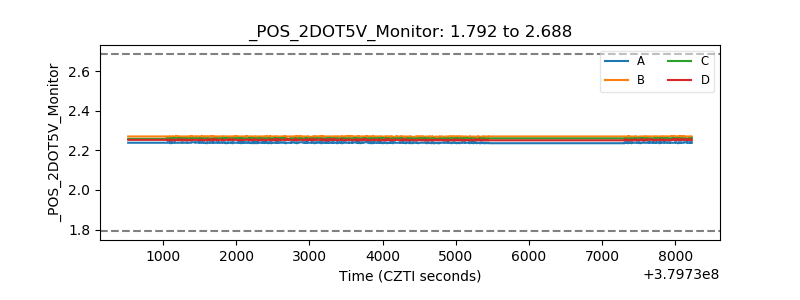 |
| +5 Volts monitor | 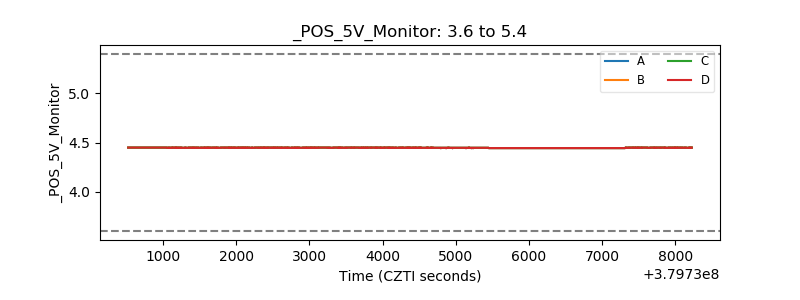 |
| _ROLL_ROT | 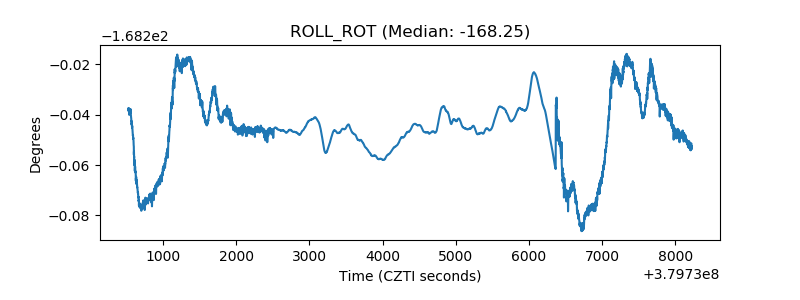 |
| _Roll_DEC | 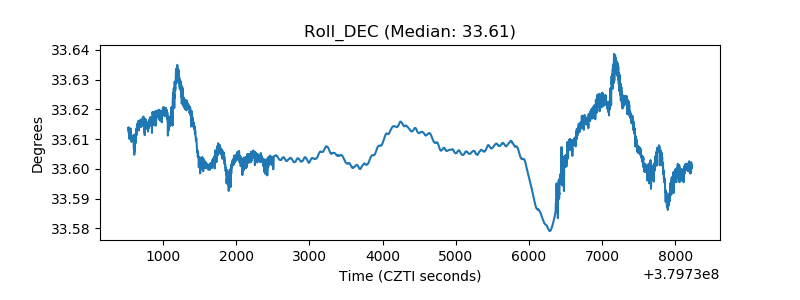 |
| _Roll_RA | 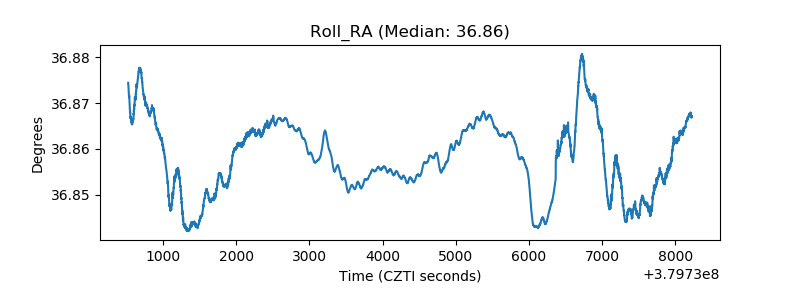 |
| Veto Counter | 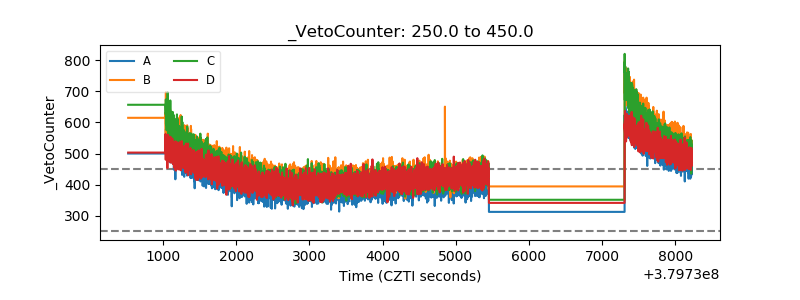 |