| Param | Original file | Final file |
|---|---|---|
| Filename | modeM0/AS1A06_003T04_9000004866_34030cztM0_level2.evt | modeM0/AS1A06_003T04_9000004866_34030cztM0_level2_quad_clean.evt |
| Size (bytes) | 503,686,080 | 56,335,680 |
| Size | 480.4 MB | 53.7 MB |
| Events in quadrant A | 2,831,604 | 344,821 |
| Events in quadrant B | 3,476,903 | 340,896 |
| Events in quadrant C | 4,498,870 | 337,582 |
| Events in quadrant D | 4,096,053 | 319,175 |
| Mode M9 | |||
|---|---|---|---|
| Quadrant | BADHDUFLAG | Total packets | Discarded packets |
| A | 0 | 30 | 0 |
| B | 0 | 30 | 0 |
| C | 0 | 30 | 0 |
| D | 0 | 31 | 0 |
| Mode M0 | |||
|---|---|---|---|
| Quadrant | BADHDUFLAG | Total packets | Discarded packets |
| A | 0 | 11433 | 3 |
| B | 0 | 13814 | 2 |
| C | 0 | 17015 | 2 |
| D | 0 | 15909 | 2 |
| Mode SS | |||
|---|---|---|---|
| Quadrant | BADHDUFLAG | Total packets | Discarded packets |
| A | 0 | 106 | 0 |
| B | 0 | 106 | 0 |
| C | 0 | 106 | 0 |
| D | 0 | 106 | 0 |
| Quadrant | Total seconds | Saturated seconds | Saturation percentage |
|---|---|---|---|
| A | 5178 | 14 | 0.270375% |
| B | 5178 | 169 | 3.263808% |
| C | 5178 | 474 | 9.154114% |
| D | 5178 | 223 | 4.306682% |
Noise dominated data is calculated using 1-second bins in cleaned event files. If a bin has >2000 counts, and if more than 50% of those come from <1% of pixels, then it is considered to be noise-dominated and hence unusable.
| Quadrant | # 1 sec bins | Bins with >0 counts | Bins with >2000 counts | High rate bins dominated by noise | Noise dominated (total time) | Noise dominated (detector-on time) | Marked lightcurve |
|---|---|---|---|---|---|---|---|
| A | 7151 | 5179 | 5 | 5 | 0.07% | 0.10% | 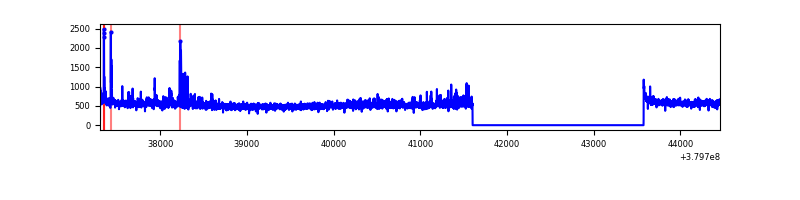 |
| B | 7151 | 5178 | 131 | 131 | 1.83% | 2.53% | 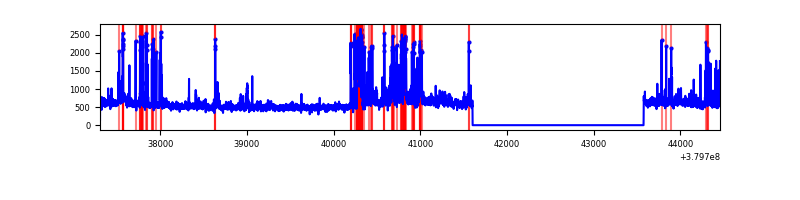 |
| C | 7150 | 5178 | 394 | 394 | 5.51% | 7.61% | 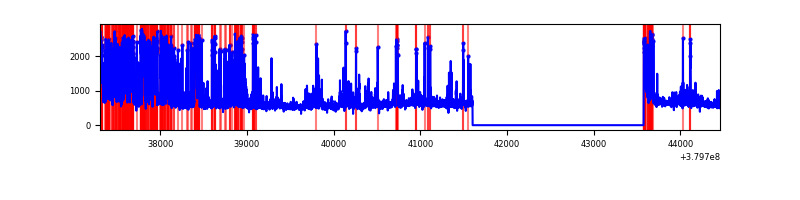 |
| D | 7151 | 5179 | 169 | 169 | 2.36% | 3.26% | 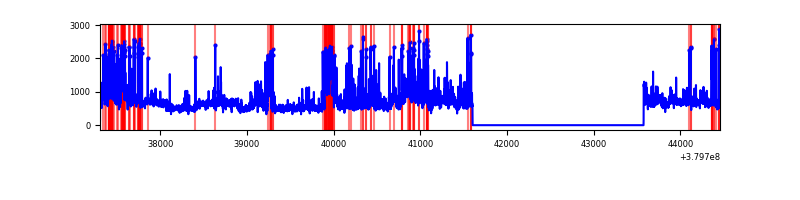 |
Top three noisy pixels from each quadrant. If the there are fewer than three noisy pixels in the level2.evt file, extra rows are filled as -1
| Pixel properties | Quadrant properties | ||||||
|---|---|---|---|---|---|---|---|
| Quadrant | DetID | PixID | Counts | Sigma | Mean | Median | Sigma |
| A | 0 | 31 | 102524 | 751.65 | 682 | 673 | 135.5 |
| A | 15 | 169 | 55966 | 408.06 | 682 | 673 | 135.5 |
| A | 10 | 83 | 18358 | 130.51 | 682 | 673 | 135.5 |
| B | 5 | 172 | 553285 | 4370.13 | 673 | 658 | 126.5 |
| B | 0 | 189 | 106783 | 839.22 | 673 | 658 | 126.5 |
| B | 0 | 219 | 99205 | 779.3 | 673 | 658 | 126.5 |
| C | 4 | 254 | 1242926 | 8653.79 | 628 | 633 | 143.6 |
| C | 0 | 10 | 307237 | 2135.8 | 628 | 633 | 143.6 |
| C | 15 | 214 | 233155 | 1619.74 | 628 | 633 | 143.6 |
| D | 8 | 195 | 488304 | 3080.45 | 645 | 625 | 158.3 |
| D | 10 | 118 | 467765 | 2950.71 | 645 | 625 | 158.3 |
| D | 2 | 249 | 365557 | 2305.11 | 645 | 625 | 158.3 |
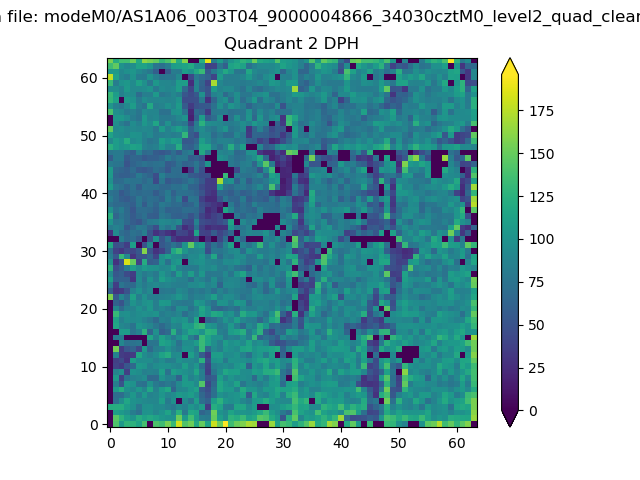
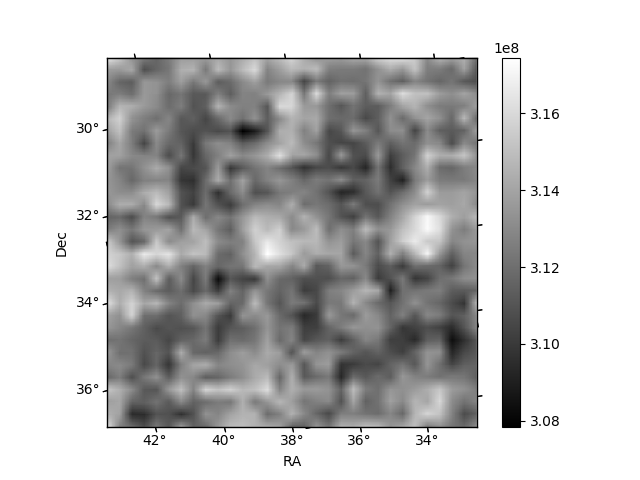
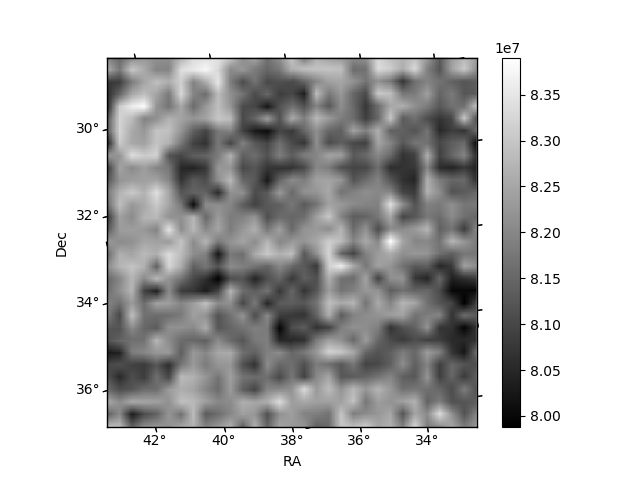
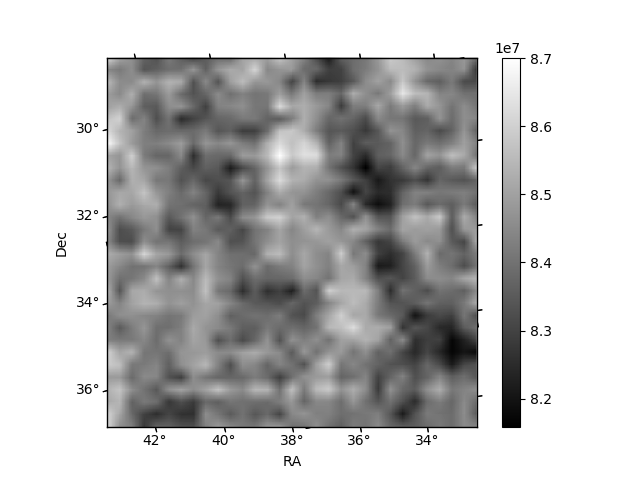
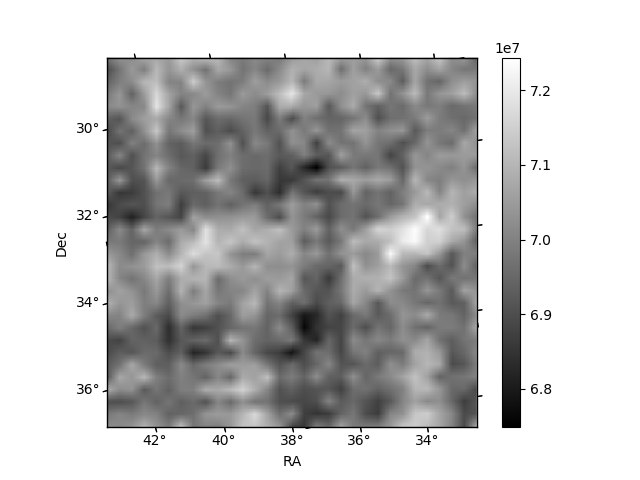
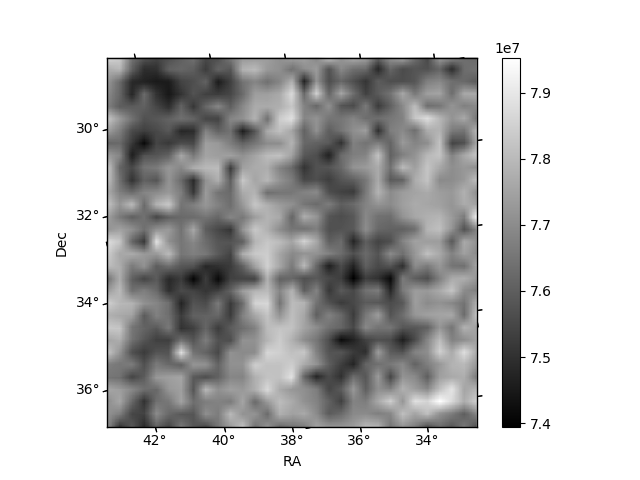
Histogram calculated using DETX and DETY for each event in the final _common_clean file
| Quadrant A | 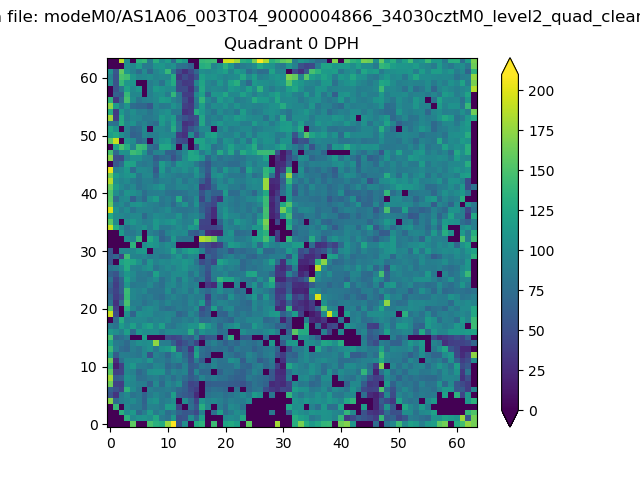 |
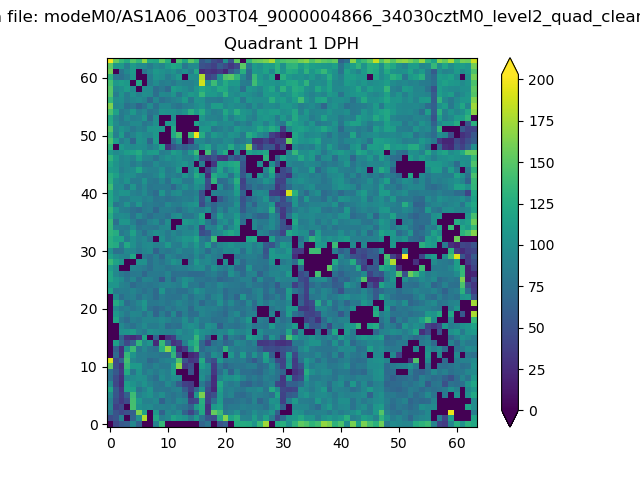 |
Quadrant B |
|---|---|---|---|
| Quadrant D | 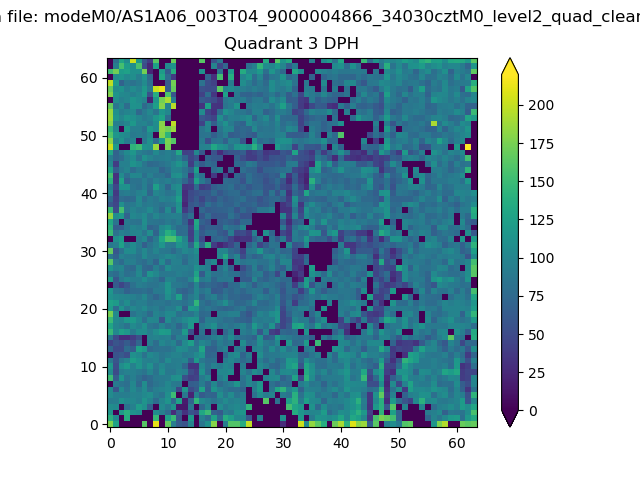 |
 |
Quadrant C |
| Plot type | Count rate plots | Images |
|---|---|---|
| Comparison with Poisson distribution Blue bars denote a histogram of data divided into 1 sec bins. Red curve is a Poisson curve with rate = median count rate of data. |
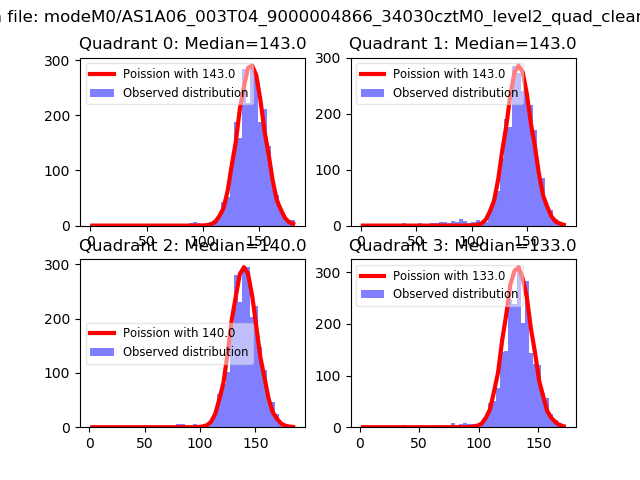 |
 |
| Quadrant-wise count rates Data is divided into 100 sec bins |
 |
|
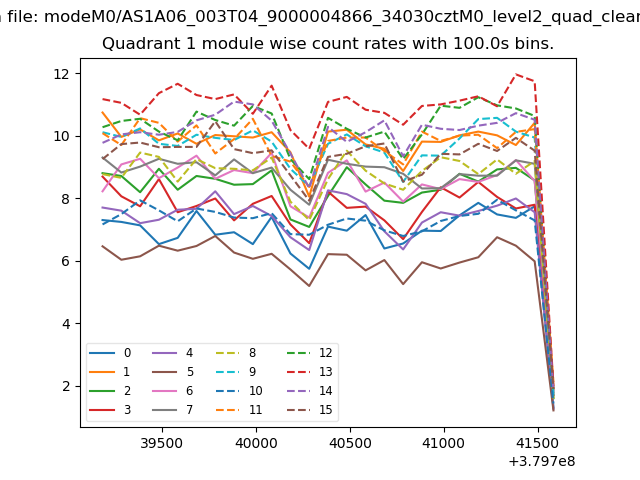
| Module-wise count rates for Quadrant A Data is divided into 100 sec bins |
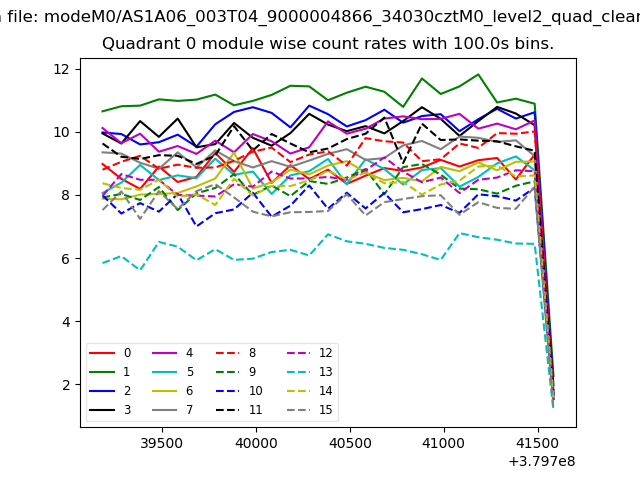 |
 |
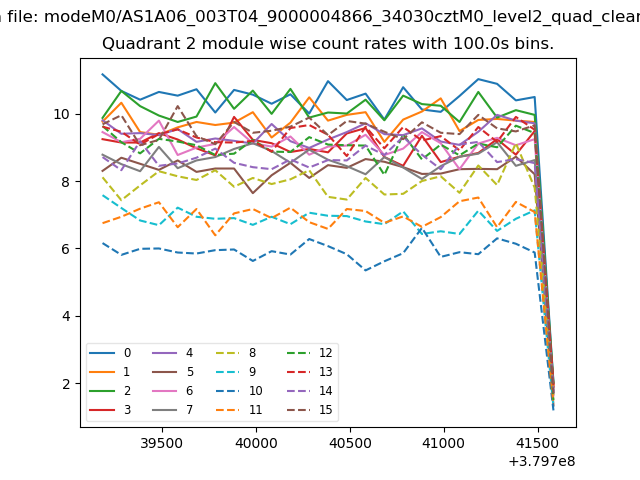
| Module-wise count rates for Quadrant B Data is divided into 100 sec bins |
 |
 |
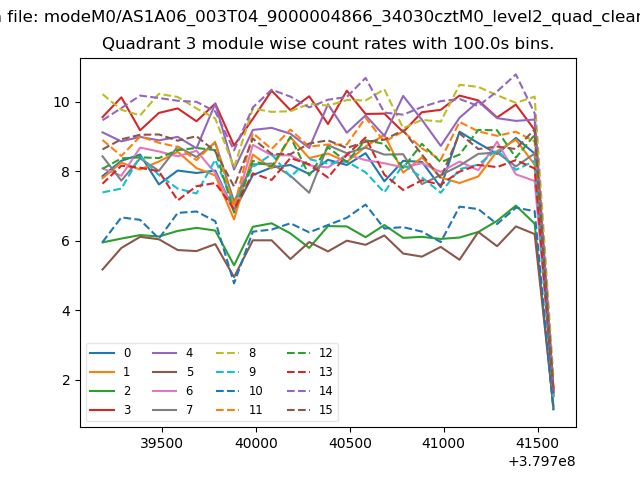
| Module-wise count rates for Quadrant C Data is divided into 100 sec bins |
 |
 |
| Module-wise count rates for Quadrant D Data is divided into 100 sec bins |
 |
 |
| Parameter | Plot |
|---|---|
| CZT HV Monitor | 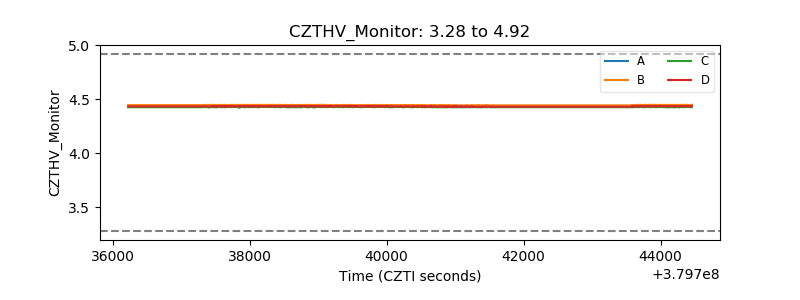 |
| D_VDD | 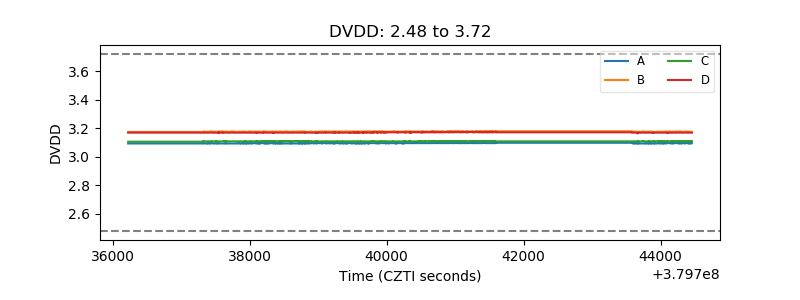 |
| Temperature 1 | 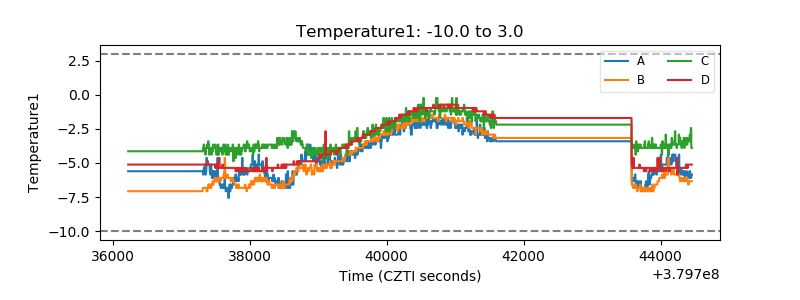 |
| Veto HV Monitor | 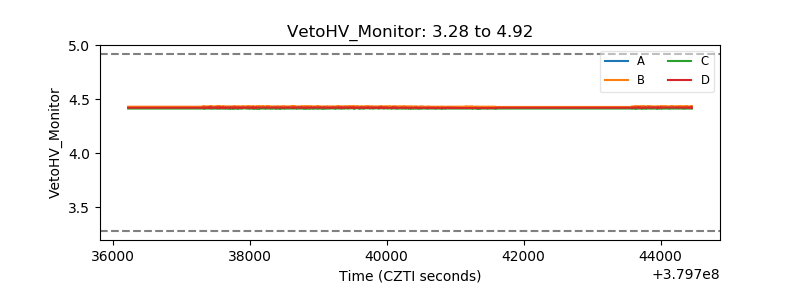 |
| Veto LLD | 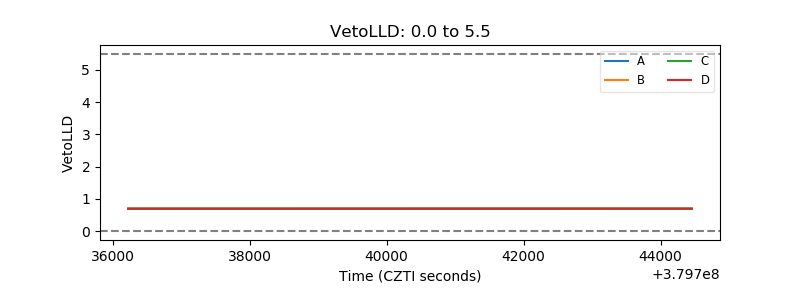 |
| Alpha Counter | 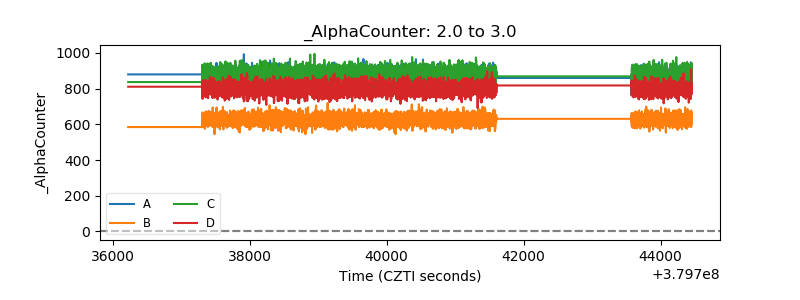 |
| _CPM_Rate | 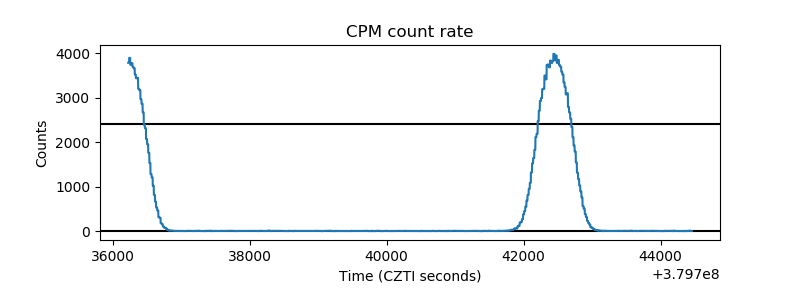 |
| CZT Counter |  |
| +2.5 Volts monitor |  |
| +5 Volts monitor |  |
| _ROLL_ROT | 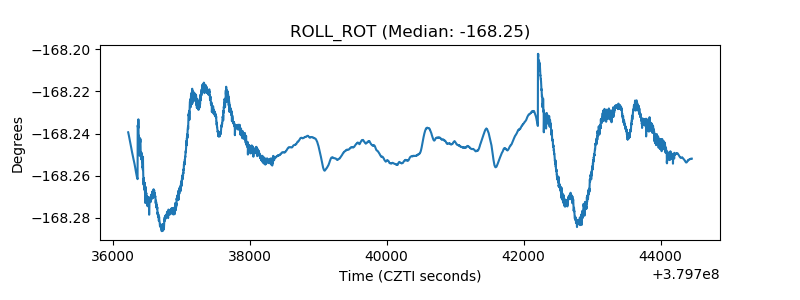 |
| _Roll_DEC | 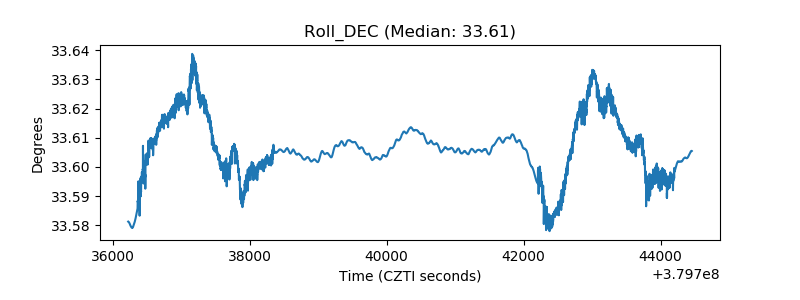 |
| _Roll_RA | 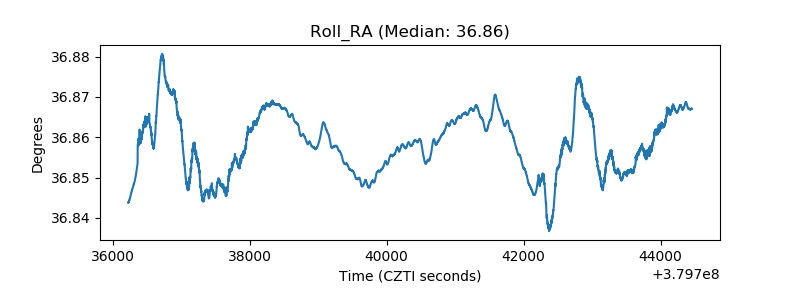 |
| Veto Counter | 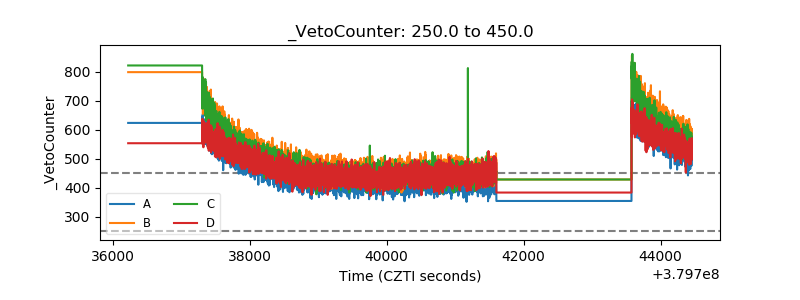 |