| Param | Original file | Final file |
|---|---|---|
| Filename | modeM0/AS1A06_003T04_9000004866_34031cztM0_level2.evt | modeM0/AS1A06_003T04_9000004866_34031cztM0_level2_quad_clean.evt |
| Size (bytes) | 473,768,640 | 64,203,840 |
| Size | 451.8 MB | 61.2 MB |
| Events in quadrant A | 2,745,417 | 414,889 |
| Events in quadrant B | 3,458,828 | 412,382 |
| Events in quadrant C | 3,933,128 | 390,613 |
| Events in quadrant D | 3,872,312 | 375,933 |
| Mode M9 | |||
|---|---|---|---|
| Quadrant | BADHDUFLAG | Total packets | Discarded packets |
| A | 0 | 28 | 0 |
| B | 0 | 28 | 0 |
| C | 0 | 28 | 0 |
| D | 0 | 29 | 0 |
| Mode M0 | |||
|---|---|---|---|
| Quadrant | BADHDUFLAG | Total packets | Discarded packets |
| A | 0 | 11059 | 3 |
| B | 0 | 13666 | 2 |
| C | 0 | 15303 | 2 |
| D | 0 | 15078 | 2 |
| Mode SS | |||
|---|---|---|---|
| Quadrant | BADHDUFLAG | Total packets | Discarded packets |
| A | 0 | 102 | 0 |
| B | 0 | 102 | 0 |
| C | 0 | 102 | 0 |
| D | 0 | 102 | 0 |
| Quadrant | Total seconds | Saturated seconds | Saturation percentage |
|---|---|---|---|
| A | 4993 | 6 | 0.120168% |
| B | 4993 | 142 | 2.843982% |
| C | 4993 | 258 | 5.167234% |
| D | 4993 | 146 | 2.924094% |
Noise dominated data is calculated using 1-second bins in cleaned event files. If a bin has >2000 counts, and if more than 50% of those come from <1% of pixels, then it is considered to be noise-dominated and hence unusable.
| Quadrant | # 1 sec bins | Bins with >0 counts | Bins with >2000 counts | High rate bins dominated by noise | Noise dominated (total time) | Noise dominated (detector-on time) | Marked lightcurve |
|---|---|---|---|---|---|---|---|
| A | 7086 | 4994 | 0 | 0 | 0.00% | 0.00% | 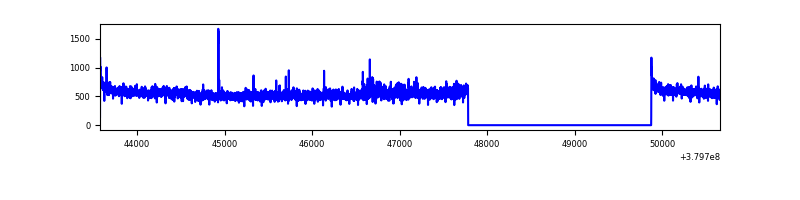 |
| B | 7086 | 4994 | 97 | 97 | 1.37% | 1.94% | 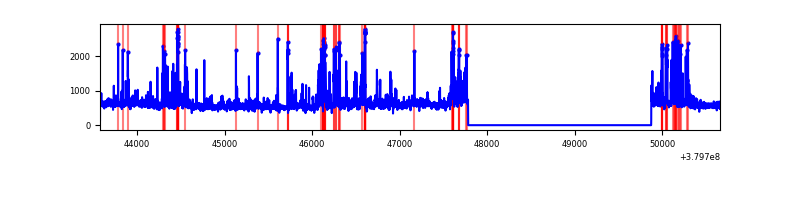 |
| C | 7086 | 4994 | 236 | 236 | 3.33% | 4.73% | 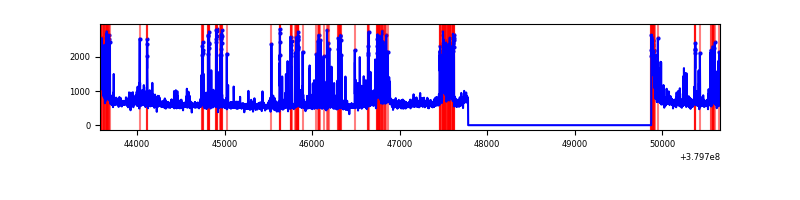 |
| D | 7086 | 4994 | 146 | 146 | 2.06% | 2.92% | 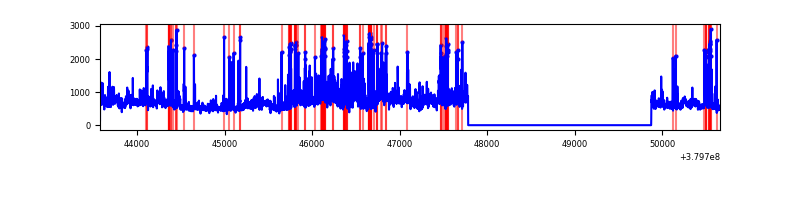 |
Top three noisy pixels from each quadrant. If the there are fewer than three noisy pixels in the level2.evt file, extra rows are filled as -1
| Pixel properties | Quadrant properties | ||||||
|---|---|---|---|---|---|---|---|
| Quadrant | DetID | PixID | Counts | Sigma | Mean | Median | Sigma |
| A | 15 | 169 | 59164 | 436.03 | 678 | 669 | 134.2 |
| A | 13 | 6 | 39078 | 286.31 | 678 | 669 | 134.2 |
| A | 10 | 83 | 18411 | 132.25 | 678 | 669 | 134.2 |
| B | 5 | 172 | 580083 | 4637.42 | 668 | 655 | 124.9 |
| B | 0 | 189 | 81420 | 646.4 | 668 | 655 | 124.9 |
| B | 0 | 229 | 52198 | 412.52 | 668 | 655 | 124.9 |
| C | 4 | 254 | 684797 | 4773.64 | 631 | 637 | 143.3 |
| C | 0 | 10 | 283321 | 1972.39 | 631 | 637 | 143.3 |
| C | 15 | 214 | 232329 | 1616.6 | 631 | 637 | 143.3 |
| D | 8 | 195 | 538703 | 3403.09 | 641 | 623 | 158.1 |
| D | 2 | 249 | 329991 | 2083.09 | 641 | 623 | 158.1 |
| D | 10 | 118 | 224016 | 1412.85 | 641 | 623 | 158.1 |
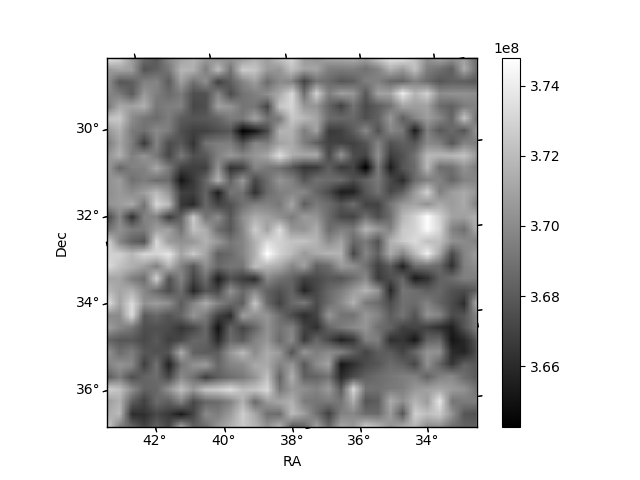
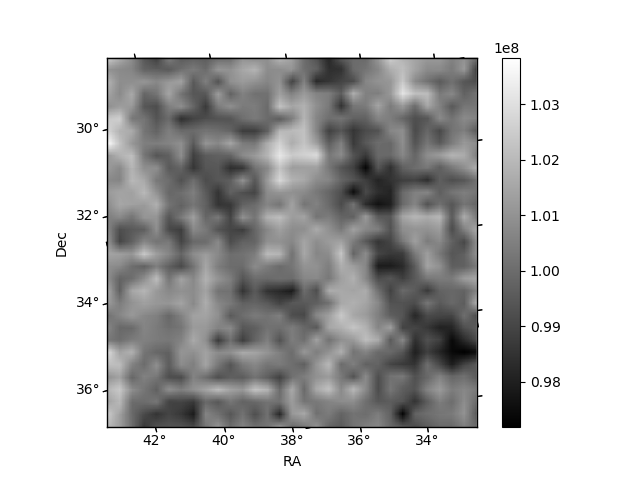
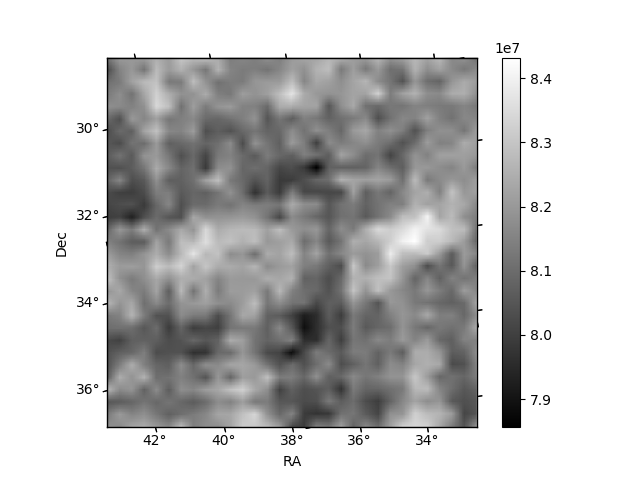
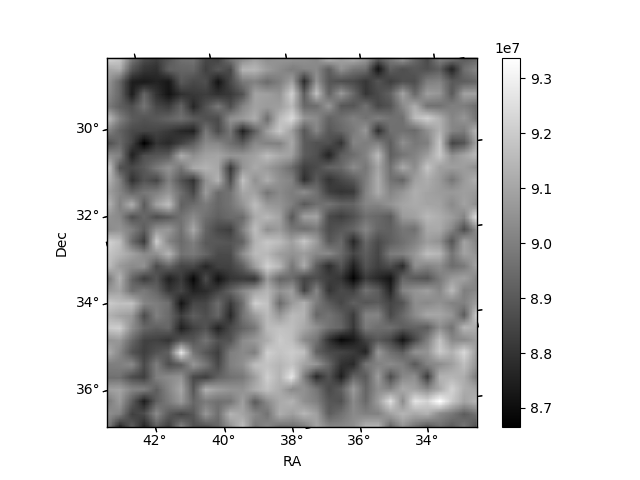
Histogram calculated using DETX and DETY for each event in the final _common_clean file
| Quadrant A |  |
 |
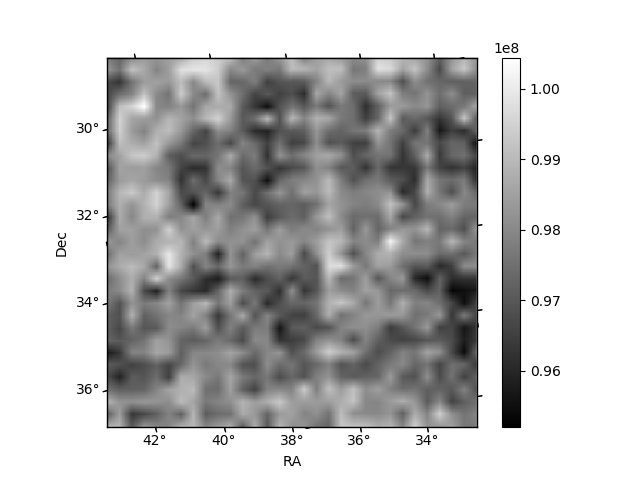
Quadrant B |
|---|---|---|---|
| Quadrant D |  |
 |
Quadrant C |
| Plot type | Count rate plots | Images |
|---|---|---|
| Comparison with Poisson distribution Blue bars denote a histogram of data divided into 1 sec bins. Red curve is a Poisson curve with rate = median count rate of data. |
 |
 |
| Quadrant-wise count rates Data is divided into 100 sec bins |
 |
|
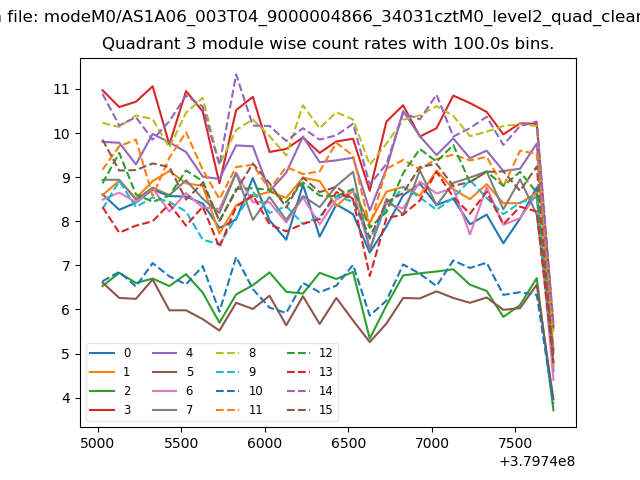
| Module-wise count rates for Quadrant A Data is divided into 100 sec bins |
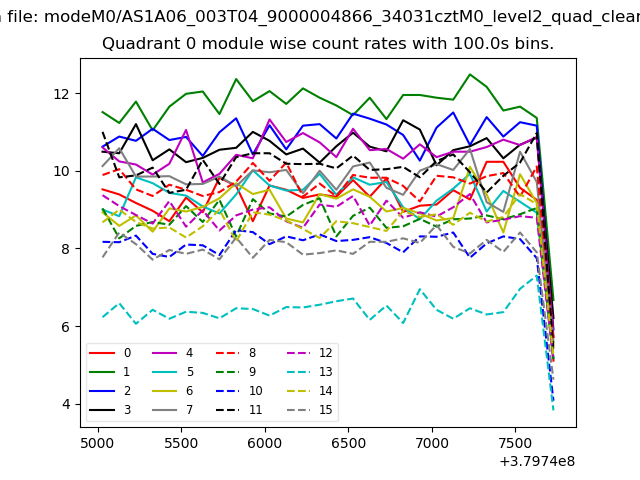 |
 |
| Module-wise count rates for Quadrant B Data is divided into 100 sec bins |
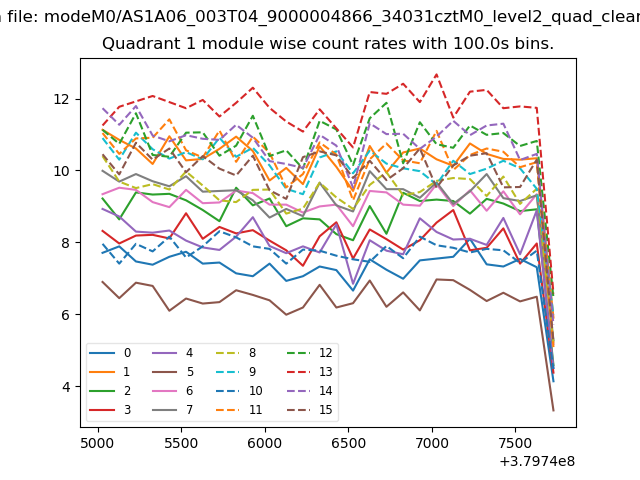 |
 |
| Module-wise count rates for Quadrant C Data is divided into 100 sec bins |
 |
 |
| Module-wise count rates for Quadrant D Data is divided into 100 sec bins |
 |
 |
| Parameter | Plot |
|---|---|
| CZT HV Monitor | 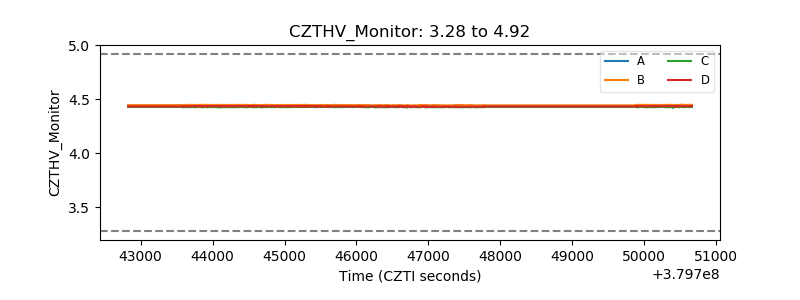 |
| D_VDD | 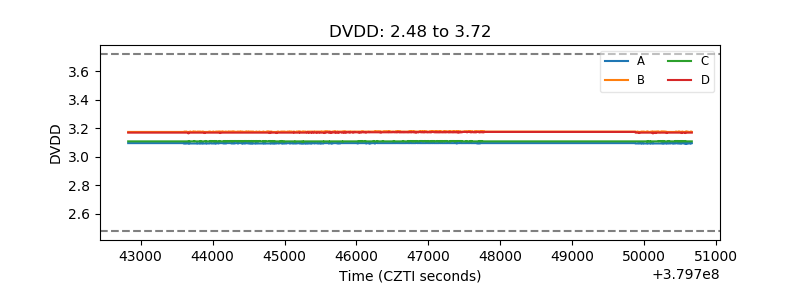 |
| Temperature 1 | 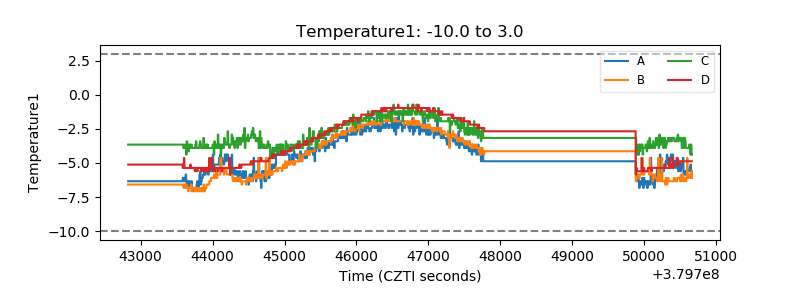 |
| Veto HV Monitor | 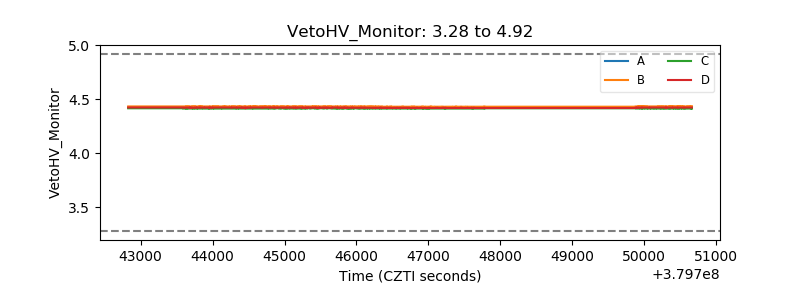 |
| Veto LLD | 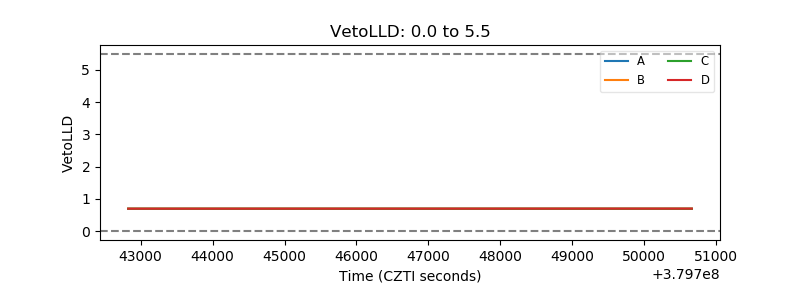 |
| Alpha Counter |  |
| _CPM_Rate | 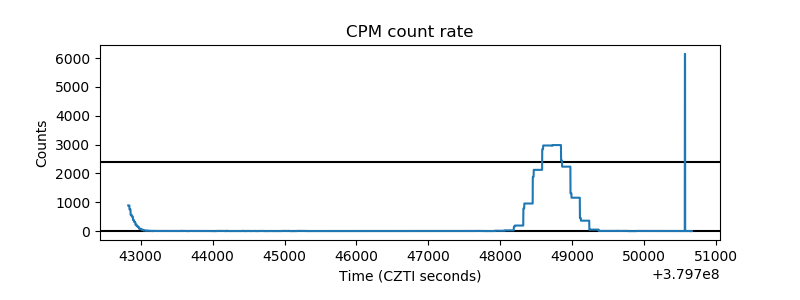 |
| CZT Counter | 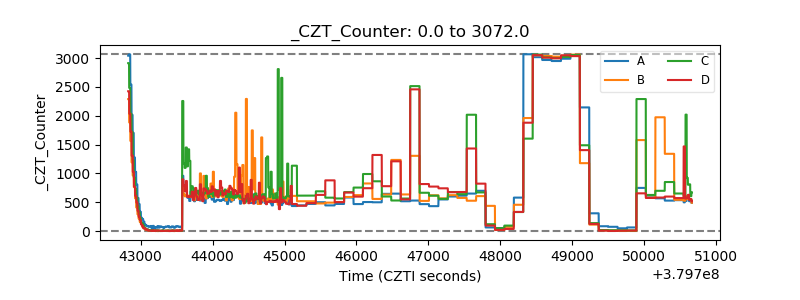 |
| +2.5 Volts monitor |  |
| +5 Volts monitor |  |
| _ROLL_ROT | 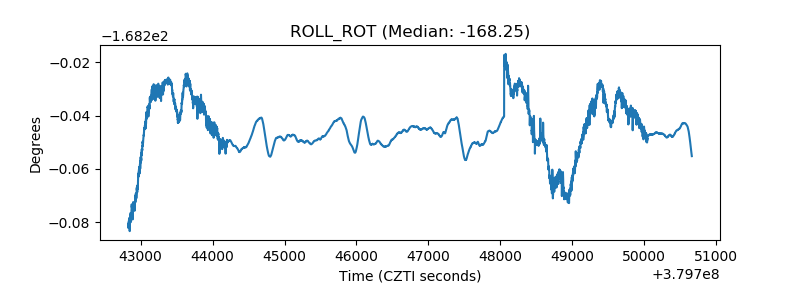 |
| _Roll_DEC | 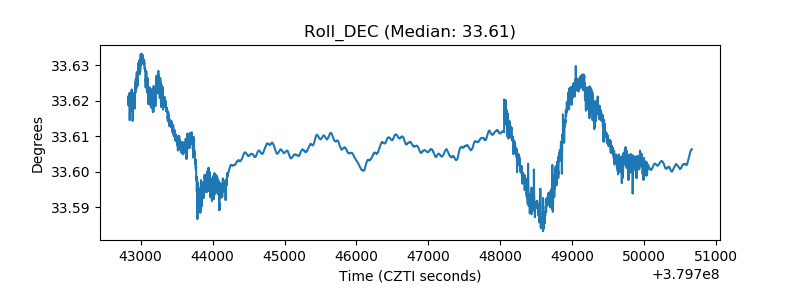 |
| _Roll_RA | 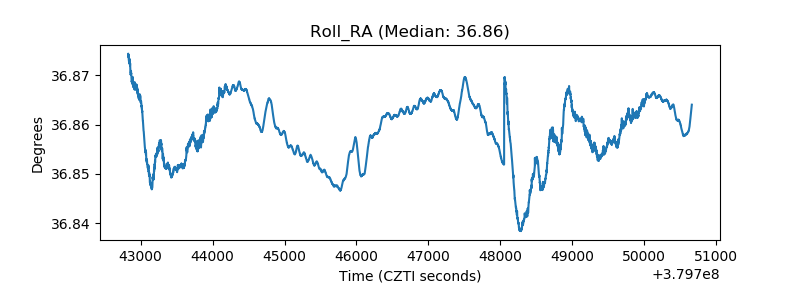 |
| Veto Counter | 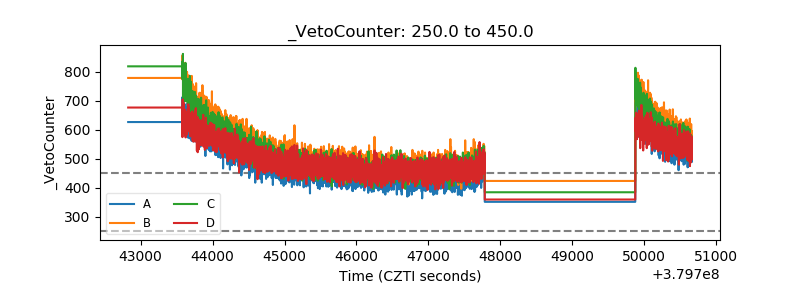 |