| Param | Original file | Final file |
|---|---|---|
| Filename | modeM0/AS1A06_003T04_9000004866_34032cztM0_level2.evt | modeM0/AS1A06_003T04_9000004866_34032cztM0_level2_quad_clean.evt |
| Size (bytes) | 440,959,680 | 76,567,680 |
| Size | 420.5 MB | 73.0 MB |
| Events in quadrant A | 2,650,410 | 513,268 |
| Events in quadrant B | 3,181,106 | 506,713 |
| Events in quadrant C | 3,418,001 | 493,916 |
| Events in quadrant D | 3,770,171 | 458,493 |
| Mode M9 | |||
|---|---|---|---|
| Quadrant | BADHDUFLAG | Total packets | Discarded packets |
| A | 0 | 36 | 0 |
| B | 0 | 36 | 0 |
| C | 0 | 36 | 0 |
| D | 0 | 37 | 0 |
| Mode M0 | |||
|---|---|---|---|
| Quadrant | BADHDUFLAG | Total packets | Discarded packets |
| A | 0 | 10650 | 3 |
| B | 0 | 12544 | 2 |
| C | 0 | 13314 | 2 |
| D | 0 | 14494 | 2 |
| Mode SS | |||
|---|---|---|---|
| Quadrant | BADHDUFLAG | Total packets | Discarded packets |
| A | 0 | 100 | 0 |
| B | 0 | 100 | 0 |
| C | 0 | 100 | 0 |
| D | 0 | 100 | 0 |
| Quadrant | Total seconds | Saturated seconds | Saturation percentage |
|---|---|---|---|
| A | 4936 | 10 | 0.202593% |
| B | 4936 | 146 | 2.957861% |
| C | 4936 | 119 | 2.410859% |
| D | 4936 | 255 | 5.166126% |
Noise dominated data is calculated using 1-second bins in cleaned event files. If a bin has >2000 counts, and if more than 50% of those come from <1% of pixels, then it is considered to be noise-dominated and hence unusable.
| Quadrant | # 1 sec bins | Bins with >0 counts | Bins with >2000 counts | High rate bins dominated by noise | Noise dominated (total time) | Noise dominated (detector-on time) | Marked lightcurve |
|---|---|---|---|---|---|---|---|
| A | 7089 | 4936 | 6 | 6 | 0.08% | 0.12% | 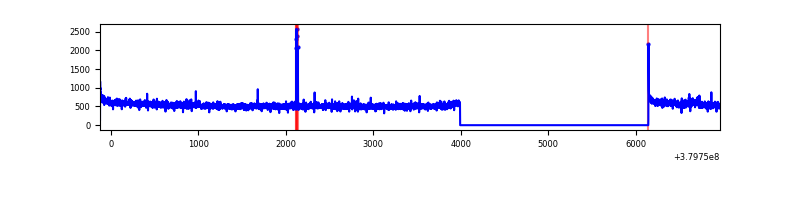 |
| B | 7089 | 4937 | 78 | 78 | 1.10% | 1.58% | 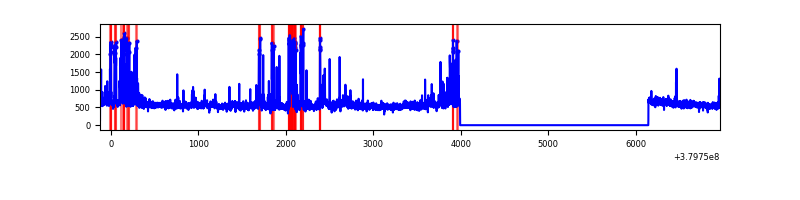 |
| C | 7089 | 4937 | 100 | 100 | 1.41% | 2.03% | 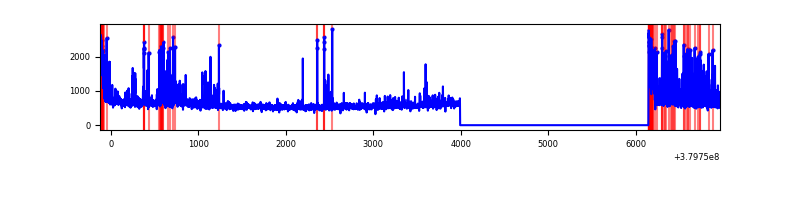 |
| D | 7089 | 4937 | 223 | 223 | 3.15% | 4.52% | 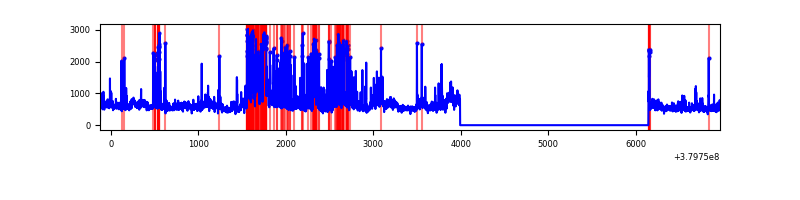 |
Top three noisy pixels from each quadrant. If the there are fewer than three noisy pixels in the level2.evt file, extra rows are filled as -1
| Pixel properties | Quadrant properties | ||||||
|---|---|---|---|---|---|---|---|
| Quadrant | DetID | PixID | Counts | Sigma | Mean | Median | Sigma |
| A | 0 | 31 | 30266 | 228.03 | 662 | 651 | 129.9 |
| A | 15 | 169 | 23699 | 177.46 | 662 | 651 | 129.9 |
| A | 13 | 6 | 20364 | 151.79 | 662 | 651 | 129.9 |
| B | 5 | 172 | 411081 | 3395.88 | 648 | 636 | 120.9 |
| B | 0 | 189 | 67144 | 550.26 | 648 | 636 | 120.9 |
| B | 0 | 219 | 43781 | 356.97 | 648 | 636 | 120.9 |
| C | 0 | 10 | 467799 | 3320.28 | 620 | 626 | 140.7 |
| C | 15 | 214 | 232223 | 1646.0 | 620 | 626 | 140.7 |
| C | 4 | 254 | 146930 | 1039.81 | 620 | 626 | 140.7 |
| D | 10 | 118 | 354997 | 2340.73 | 619 | 604 | 151.4 |
| D | 8 | 195 | 341507 | 2251.63 | 619 | 604 | 151.4 |
| D | 13 | 249 | 254970 | 1680.06 | 619 | 604 | 151.4 |
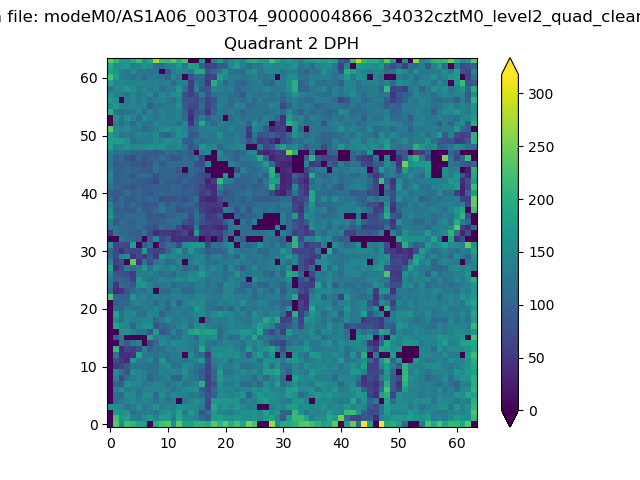
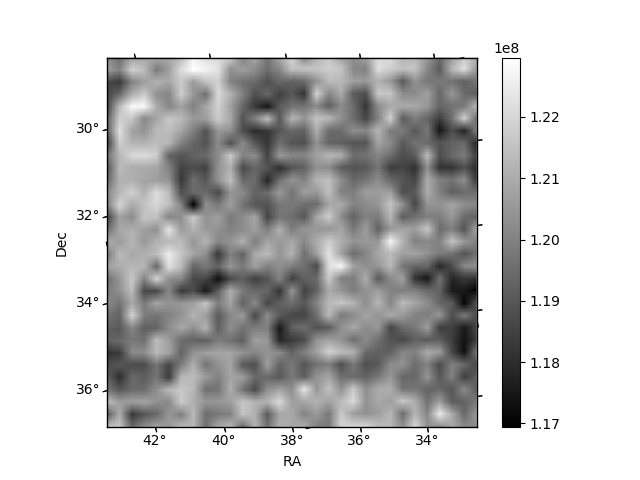
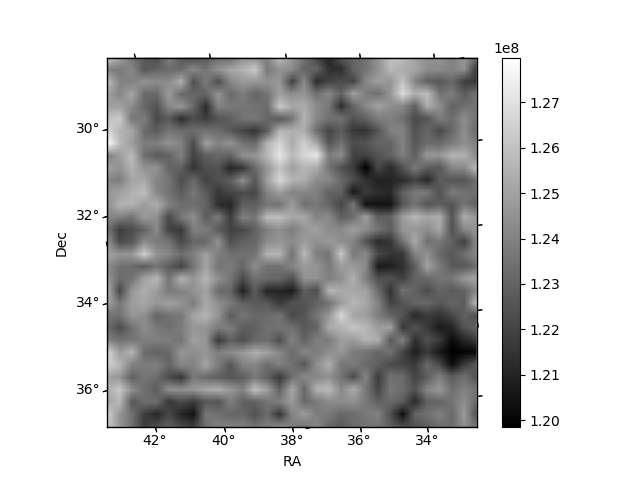
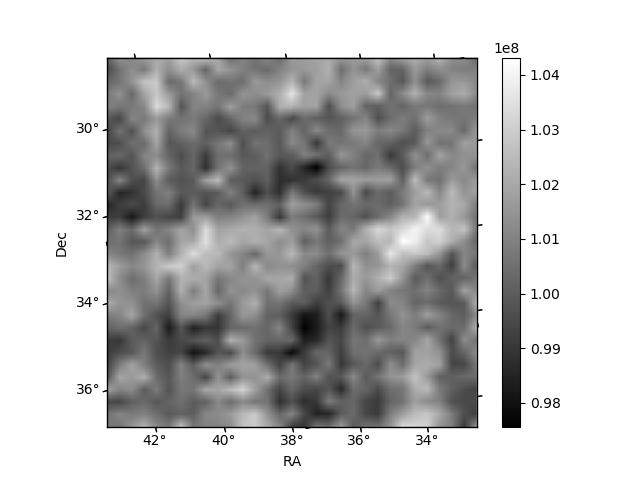
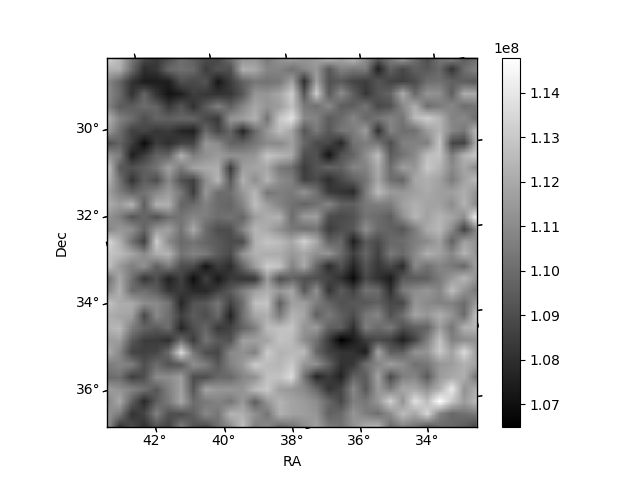
Histogram calculated using DETX and DETY for each event in the final _common_clean file
| Quadrant A | 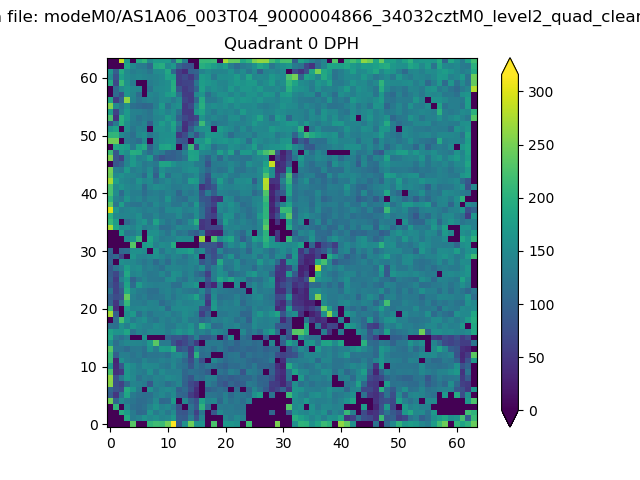 |
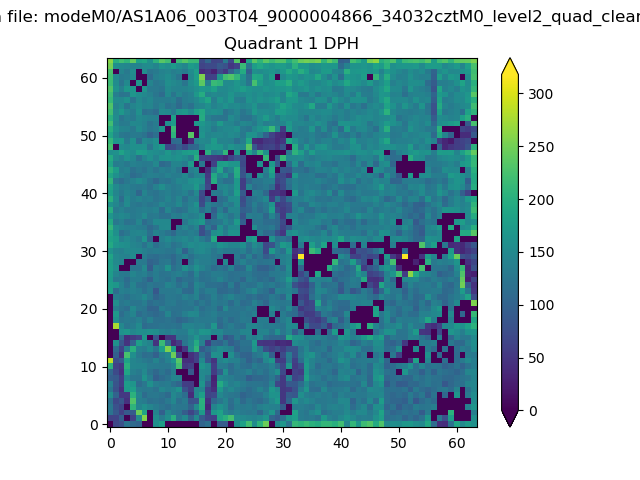 |
Quadrant B |
|---|---|---|---|
| Quadrant D | 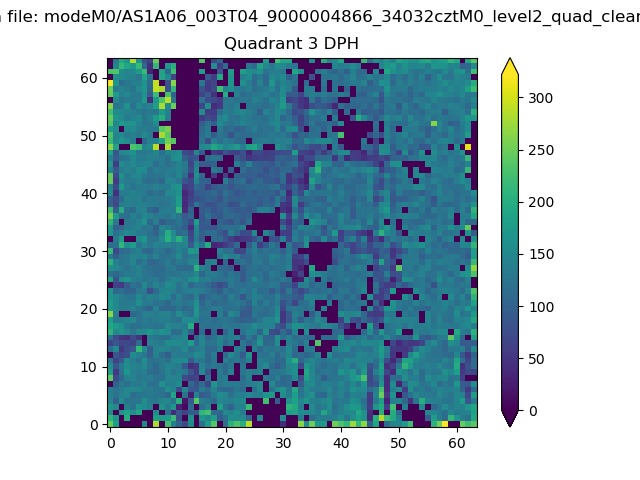 |
 |
Quadrant C |
| Plot type | Count rate plots | Images |
|---|---|---|
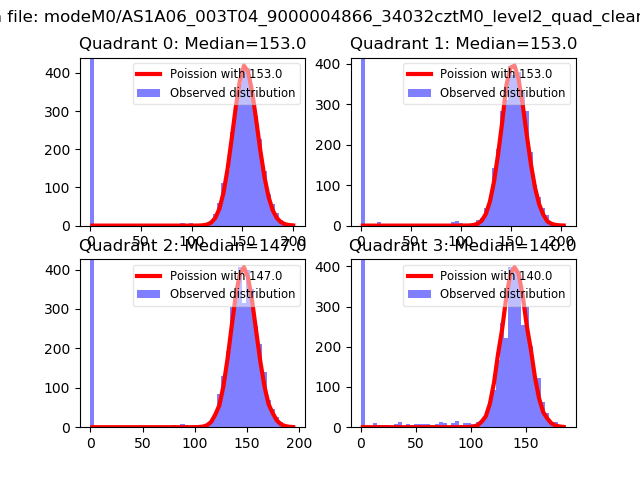
| Comparison with Poisson distribution Blue bars denote a histogram of data divided into 1 sec bins. Red curve is a Poisson curve with rate = median count rate of data. |
 |
 |
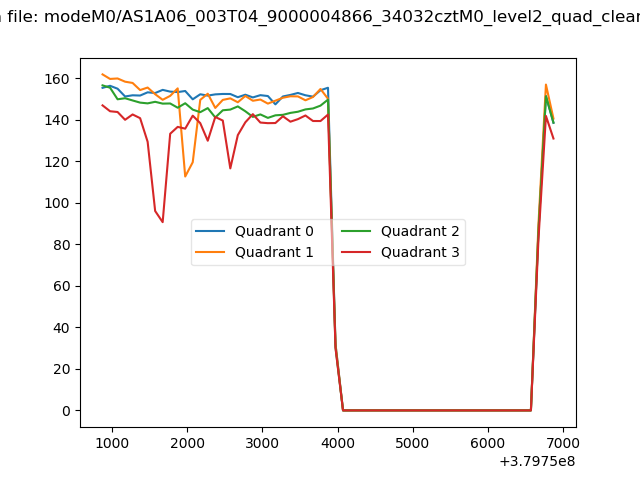
| Quadrant-wise count rates Data is divided into 100 sec bins |
 |
|
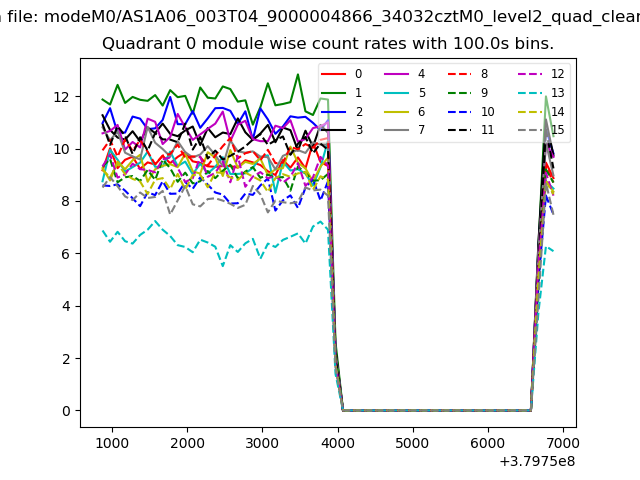
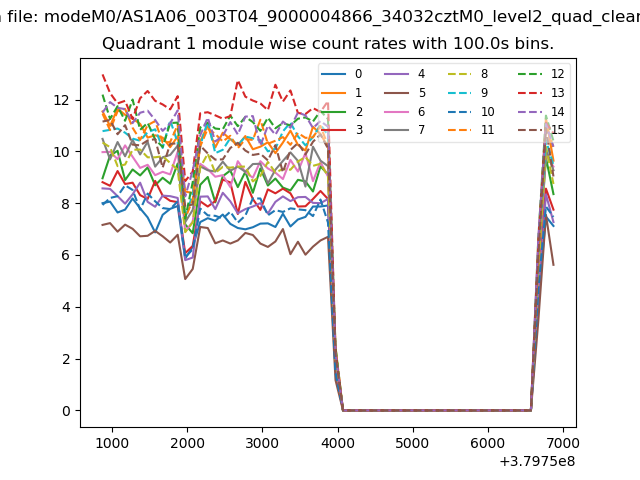
| Module-wise count rates for Quadrant A Data is divided into 100 sec bins |
 |
 |
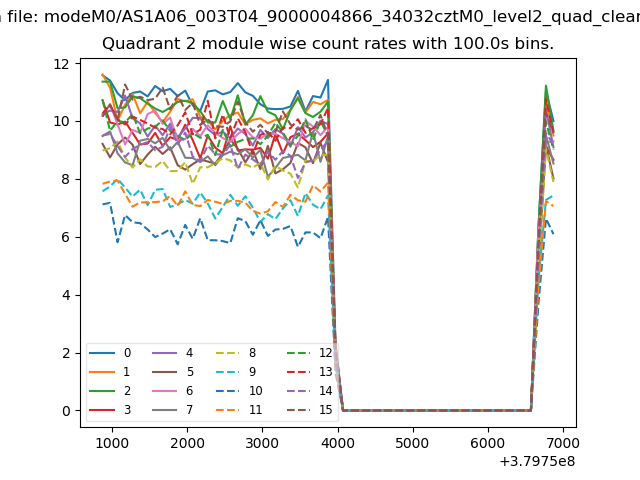
| Module-wise count rates for Quadrant B Data is divided into 100 sec bins |
 |
 |
| Module-wise count rates for Quadrant C Data is divided into 100 sec bins |
 |
 |
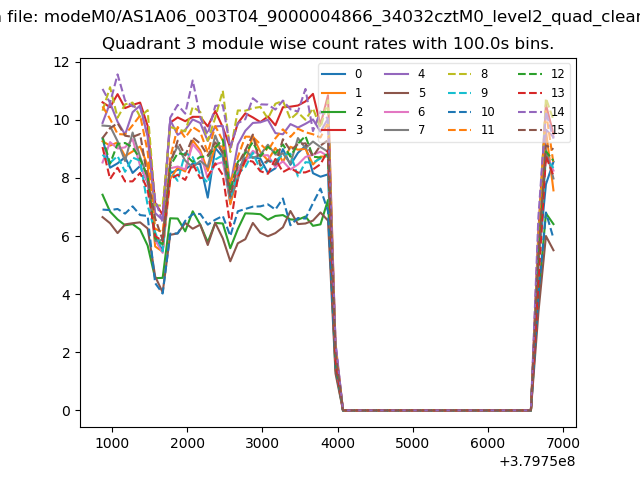
| Module-wise count rates for Quadrant D Data is divided into 100 sec bins |
 |
 |
| Parameter | Plot |
|---|---|
| CZT HV Monitor | 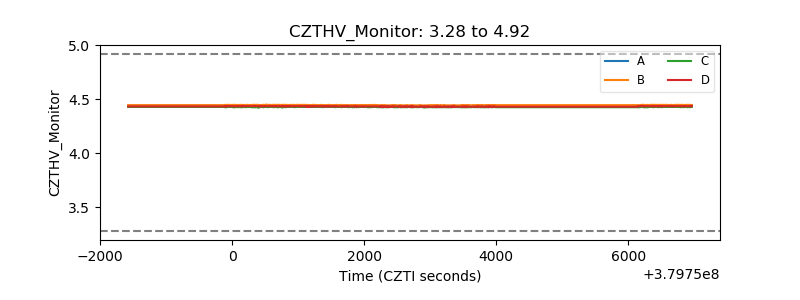 |
| D_VDD | 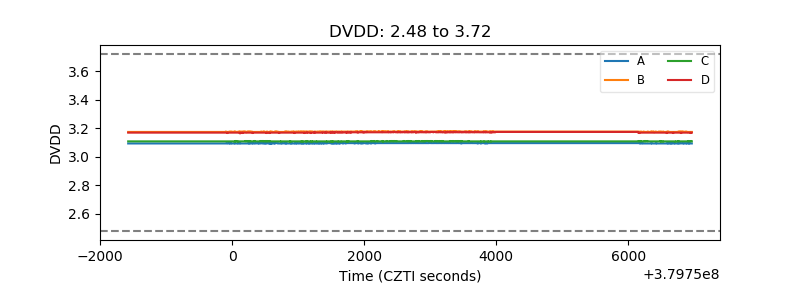 |
| Temperature 1 | 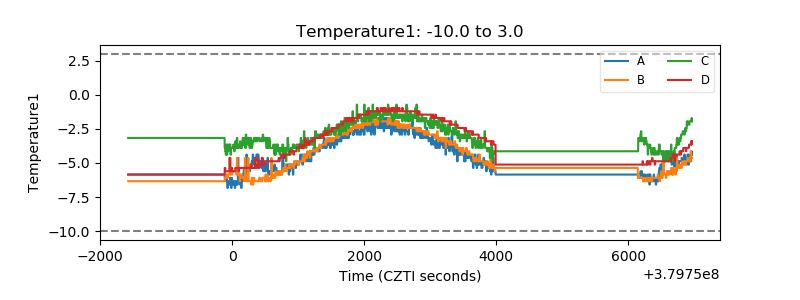 |
| Veto HV Monitor | 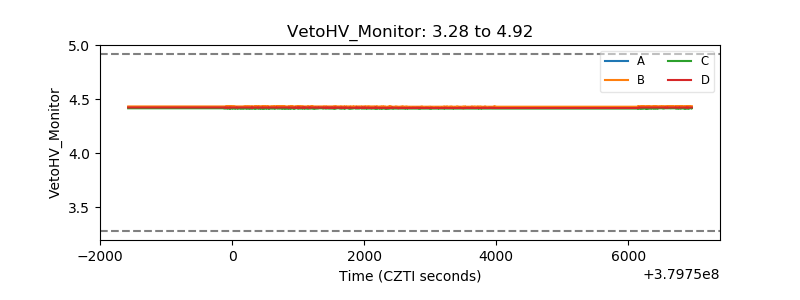 |
| Veto LLD | 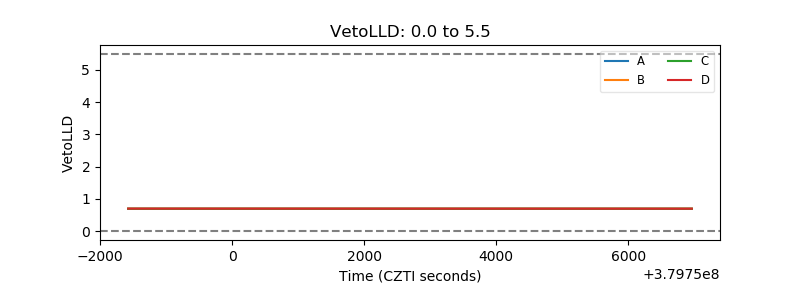 |
| Alpha Counter | 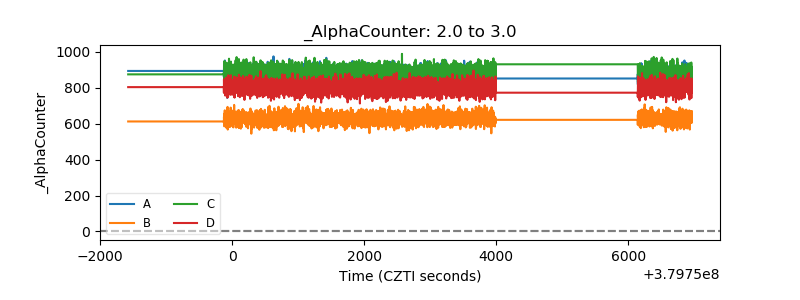 |
| _CPM_Rate | 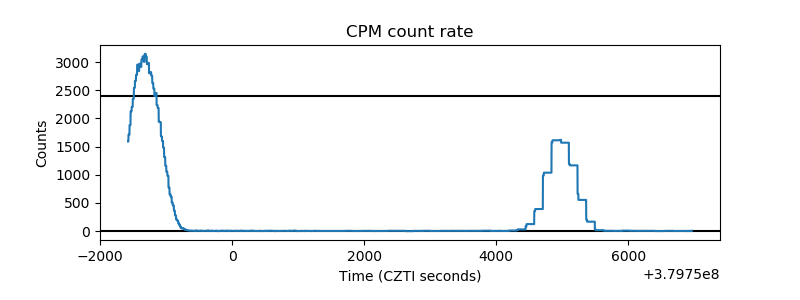 |
| CZT Counter |  |
| +2.5 Volts monitor |  |
| +5 Volts monitor | 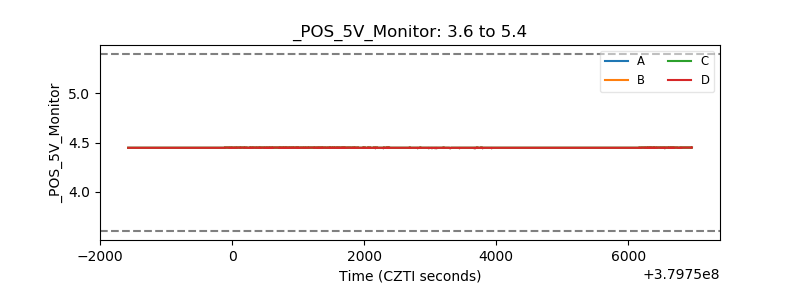 |
| _ROLL_ROT | 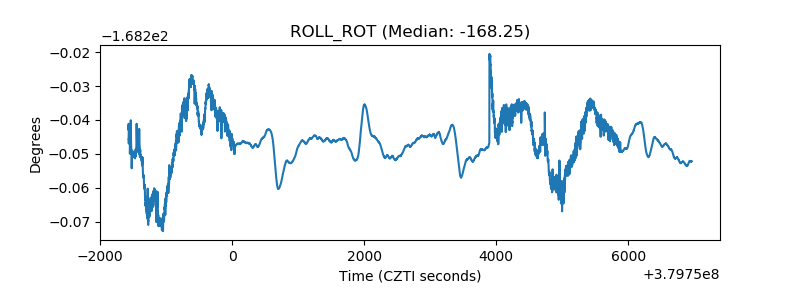 |
| _Roll_DEC | 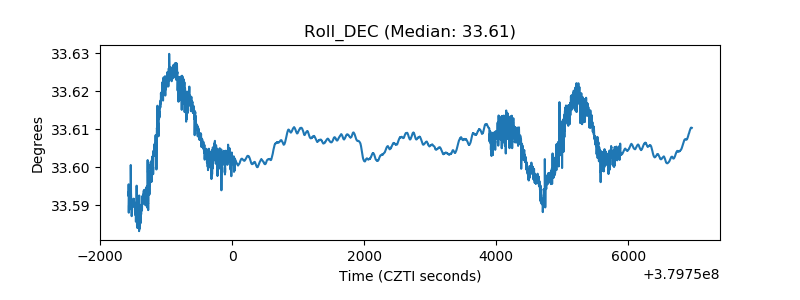 |
| _Roll_RA | 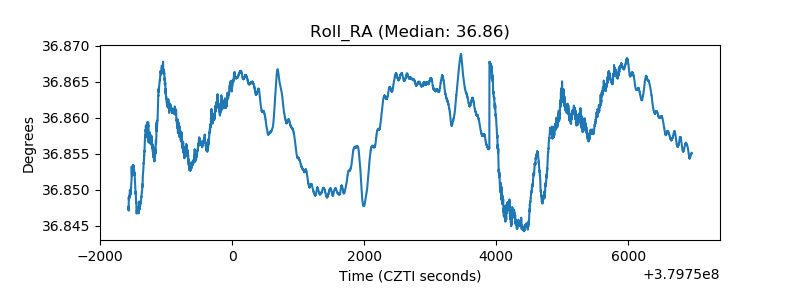 |
| Veto Counter | 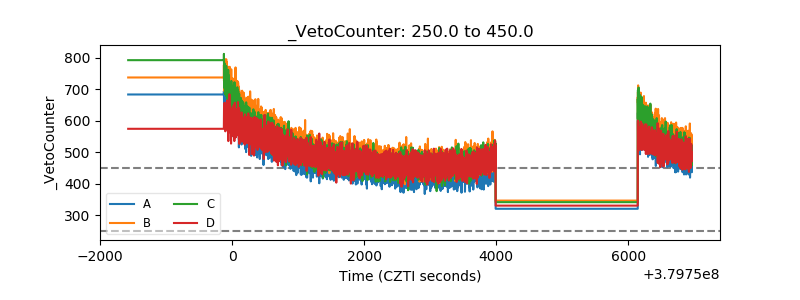 |