| Param | Original file | Final file |
|---|---|---|
| Filename | modeM0/AS1A06_003T04_9000004866_34033cztM0_level2.evt | modeM0/AS1A06_003T04_9000004866_34033cztM0_level2_quad_clean.evt |
| Size (bytes) | 522,984,960 | 88,384,320 |
| Size | 498.8 MB | 84.3 MB |
| Events in quadrant A | 3,130,635 | 602,756 |
| Events in quadrant B | 3,673,973 | 597,731 |
| Events in quadrant C | 4,805,828 | 583,040 |
| Events in quadrant D | 3,894,188 | 546,417 |
| Mode M9 | |||
|---|---|---|---|
| Quadrant | BADHDUFLAG | Total packets | Discarded packets |
| A | 0 | 28 | 0 |
| B | 0 | 28 | 0 |
| C | 0 | 28 | 0 |
| D | 0 | 29 | 0 |
| Mode M0 | |||
|---|---|---|---|
| Quadrant | BADHDUFLAG | Total packets | Discarded packets |
| A | 0 | 12196 | 3 |
| B | 0 | 14075 | 2 |
| C | 0 | 17710 | 2 |
| D | 0 | 14767 | 2 |
| Mode SS | |||
|---|---|---|---|
| Quadrant | BADHDUFLAG | Total packets | Discarded packets |
| A | 0 | 100 | 0 |
| B | 0 | 100 | 0 |
| C | 0 | 100 | 0 |
| D | 0 | 100 | 0 |
| Quadrant | Total seconds | Saturated seconds | Saturation percentage |
|---|---|---|---|
| A | 4940 | 173 | 3.502024% |
| B | 4940 | 318 | 6.437247% |
| C | 4940 | 264 | 5.344130% |
| D | 4940 | 329 | 6.659919% |
Noise dominated data is calculated using 1-second bins in cleaned event files. If a bin has >2000 counts, and if more than 50% of those come from <1% of pixels, then it is considered to be noise-dominated and hence unusable.
| Quadrant | # 1 sec bins | Bins with >0 counts | Bins with >2000 counts | High rate bins dominated by noise | Noise dominated (total time) | Noise dominated (detector-on time) | Marked lightcurve |
|---|---|---|---|---|---|---|---|
| A | 7063 | 4941 | 161 | 161 | 2.28% | 3.26% | 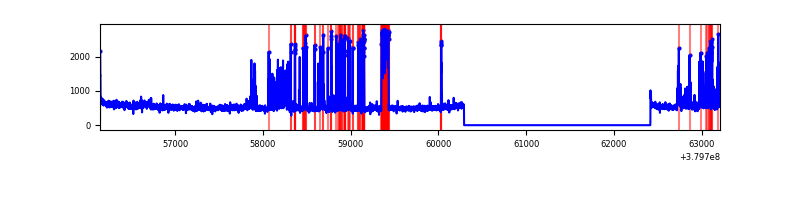 |
| B | 7062 | 4940 | 257 | 257 | 3.64% | 5.20% | 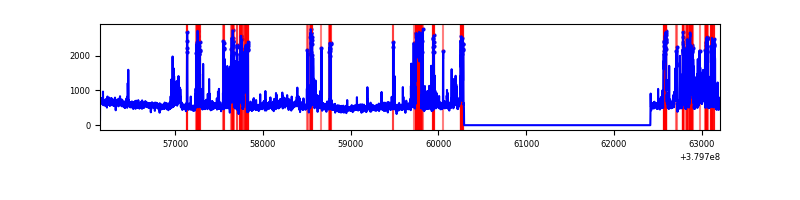 |
| C | 7063 | 4941 | 258 | 258 | 3.65% | 5.22% | 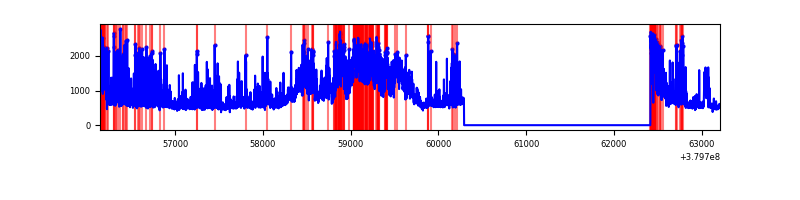 |
| D | 7062 | 4940 | 322 | 322 | 4.56% | 6.52% | 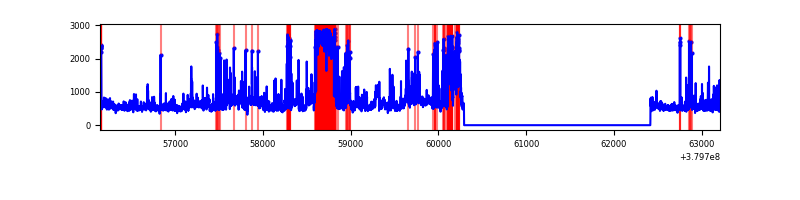 |
Top three noisy pixels from each quadrant. If the there are fewer than three noisy pixels in the level2.evt file, extra rows are filled as -1
| Pixel properties | Quadrant properties | ||||||
|---|---|---|---|---|---|---|---|
| Quadrant | DetID | PixID | Counts | Sigma | Mean | Median | Sigma |
| A | 15 | 169 | 678522 | 5447.27 | 625 | 615 | 124.4 |
| A | 10 | 83 | 17701 | 137.29 | 625 | 615 | 124.4 |
| A | 13 | 6 | 11267 | 85.59 | 625 | 615 | 124.4 |
| B | 5 | 172 | 902513 | 7823.67 | 610 | 597 | 115.3 |
| B | 0 | 189 | 91381 | 787.51 | 610 | 597 | 115.3 |
| B | 15 | 222 | 82095 | 706.95 | 610 | 597 | 115.3 |
| C | 3 | 233 | 1415495 | 10461.23 | 590 | 596 | 135.3 |
| C | 0 | 10 | 634829 | 4689.28 | 590 | 596 | 135.3 |
| C | 15 | 214 | 231304 | 1705.77 | 590 | 596 | 135.3 |
| D | 7 | 204 | 560166 | 3879.82 | 589 | 574 | 144.2 |
| D | 8 | 195 | 367204 | 2541.95 | 589 | 574 | 144.2 |
| D | 12 | 6 | 204784 | 1415.85 | 589 | 574 | 144.2 |
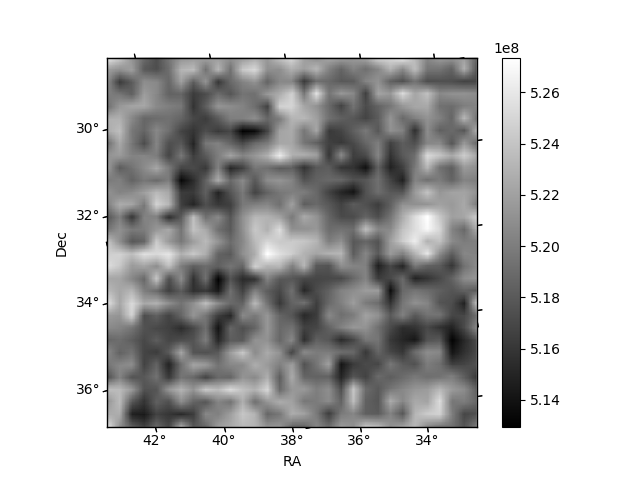
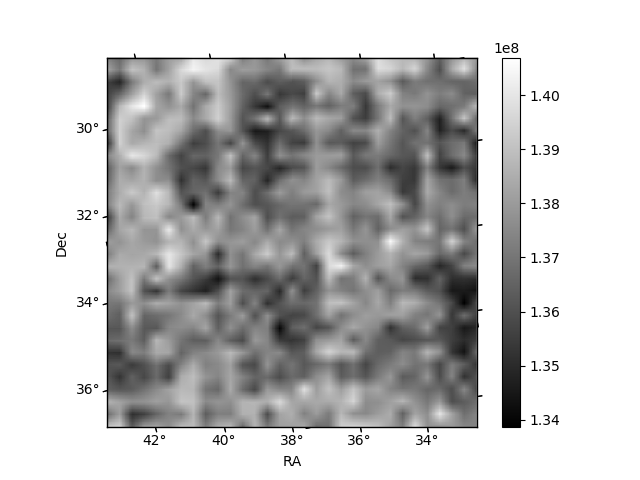
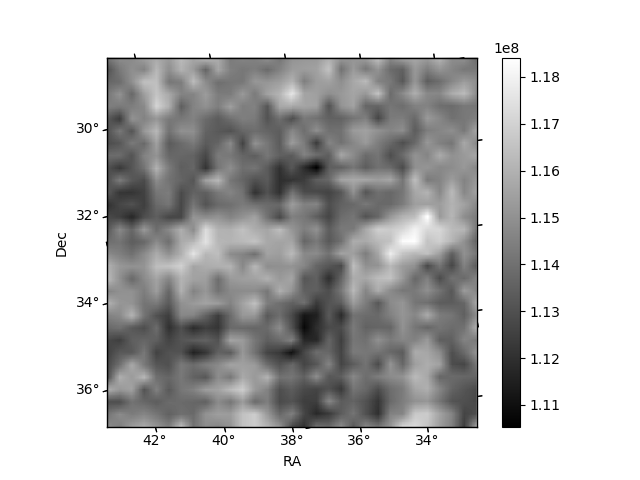
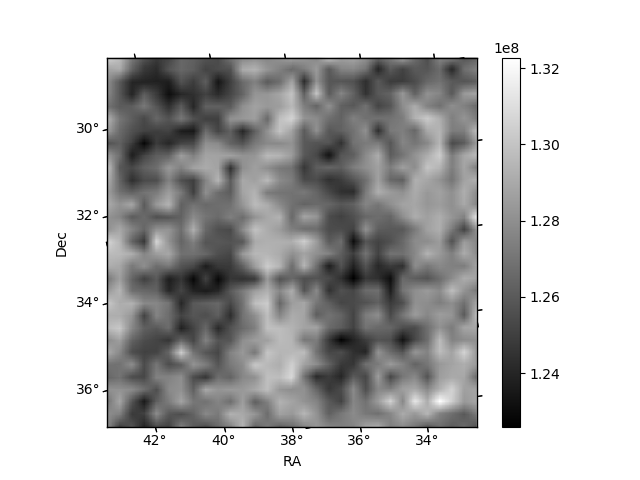
Histogram calculated using DETX and DETY for each event in the final _common_clean file
| Quadrant A | 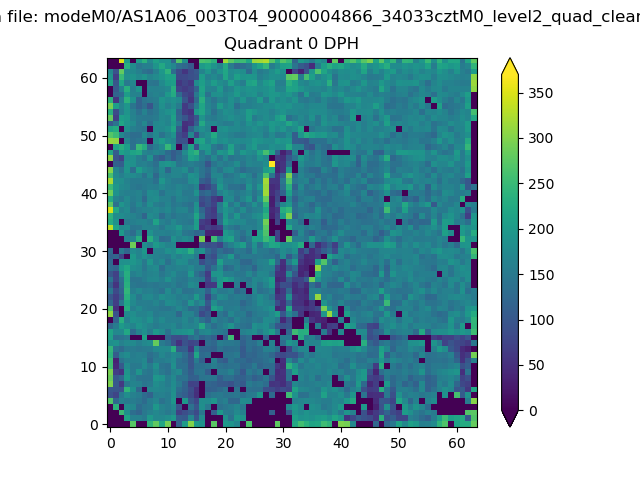 |
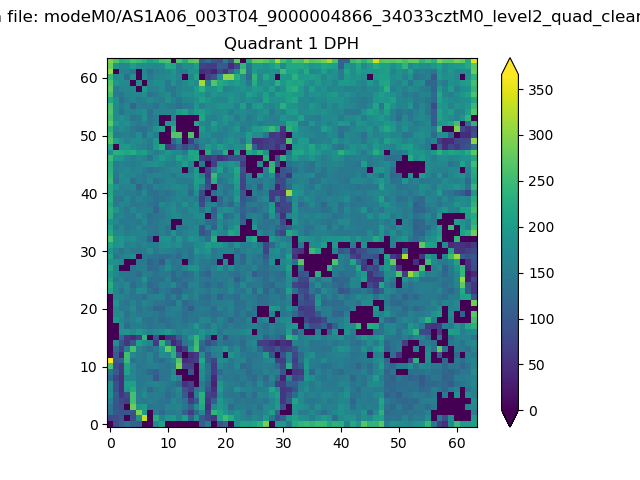 |
Quadrant B |
|---|---|---|---|
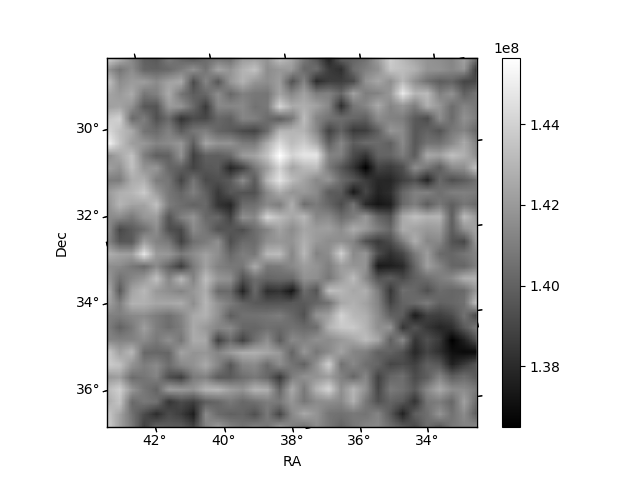
| Quadrant D | 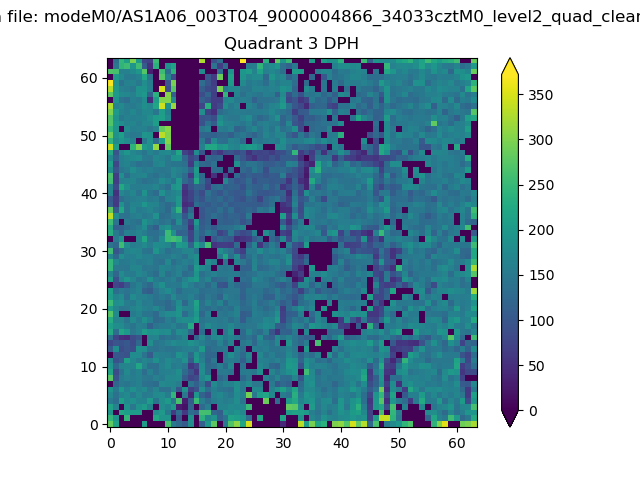 |
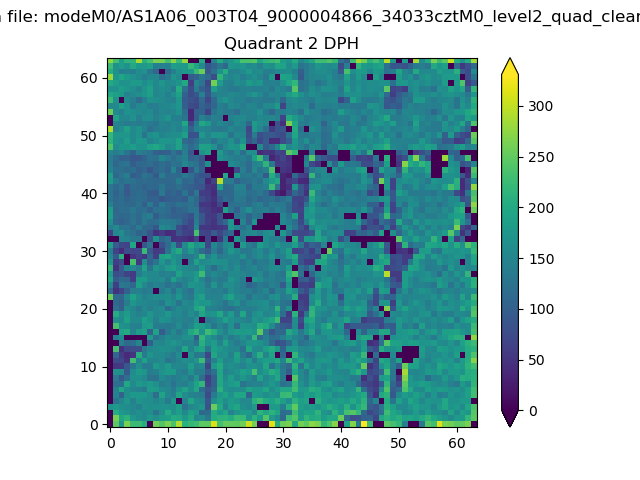 |
Quadrant C |
| Plot type | Count rate plots | Images |
|---|---|---|
| Comparison with Poisson distribution Blue bars denote a histogram of data divided into 1 sec bins. Red curve is a Poisson curve with rate = median count rate of data. |
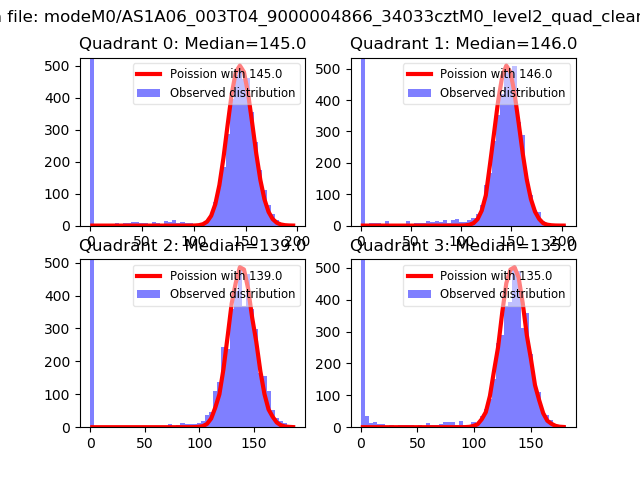 |
 |
| Quadrant-wise count rates Data is divided into 100 sec bins |
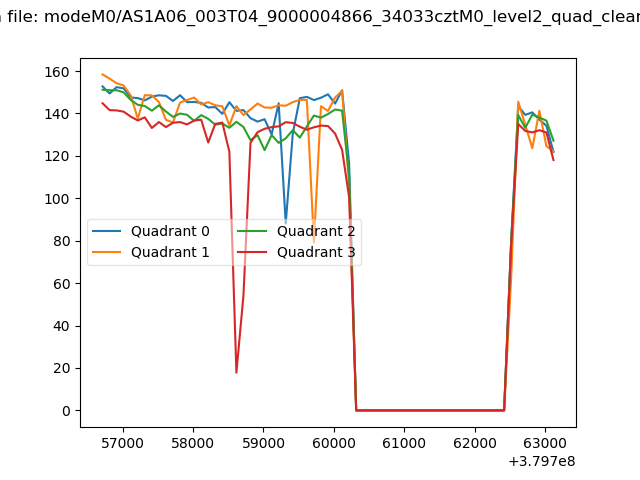 |
|
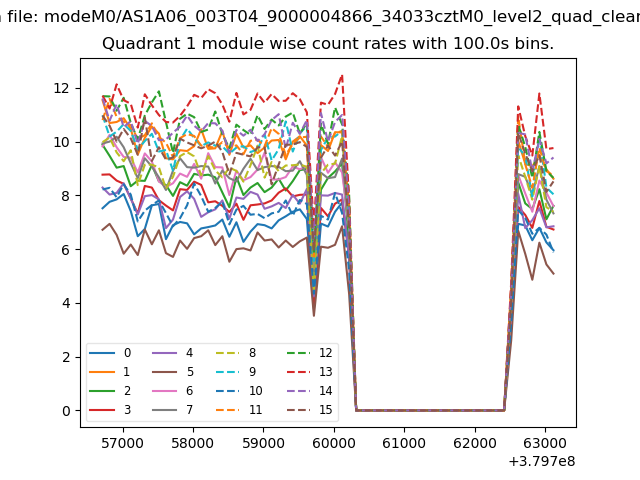
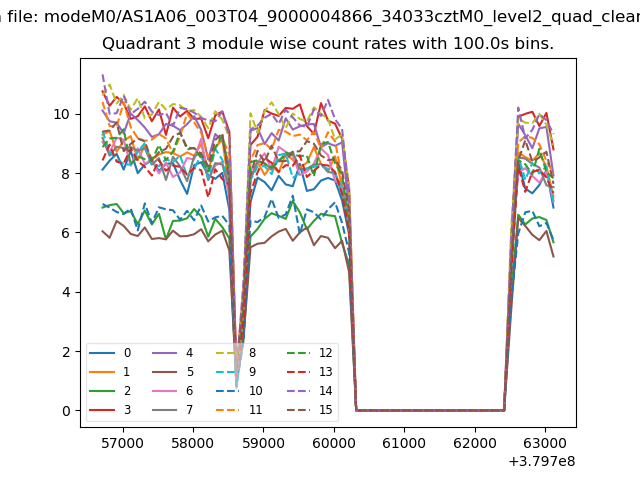
| Module-wise count rates for Quadrant A Data is divided into 100 sec bins |
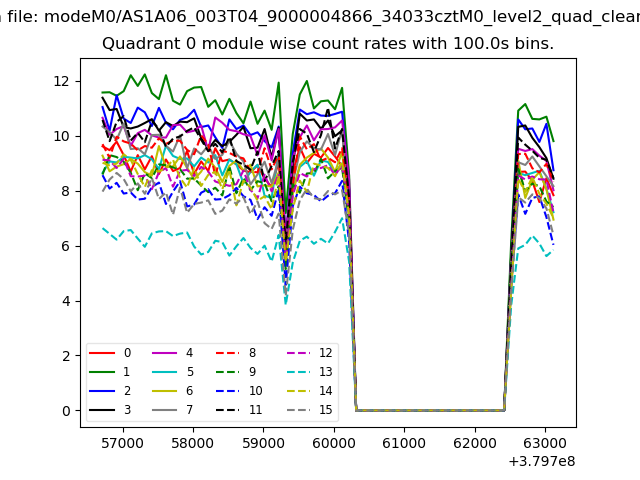 |
 |
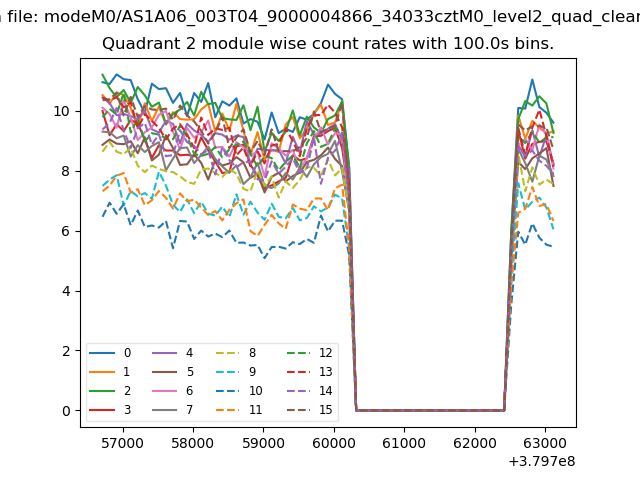
| Module-wise count rates for Quadrant B Data is divided into 100 sec bins |
 |
 |
| Module-wise count rates for Quadrant C Data is divided into 100 sec bins |
 |
 |
| Module-wise count rates for Quadrant D Data is divided into 100 sec bins |
 |
 |
| Parameter | Plot |
|---|---|
| CZT HV Monitor | 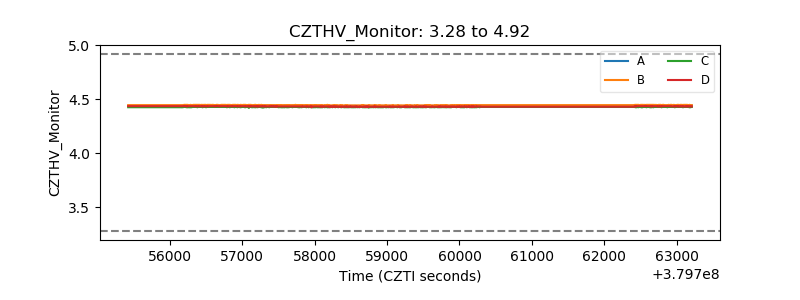 |
| D_VDD | 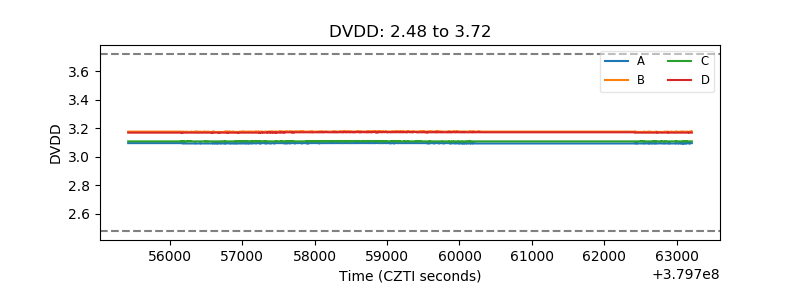 |
| Temperature 1 | 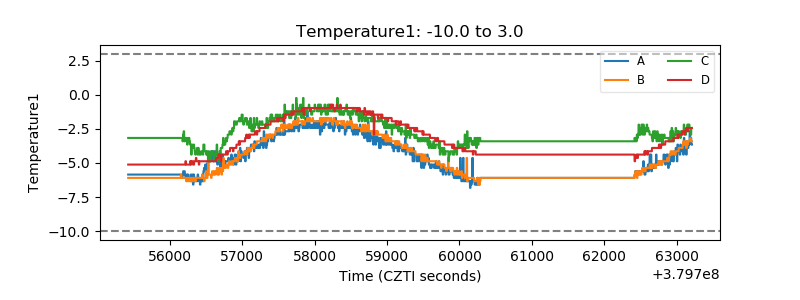 |
| Veto HV Monitor | 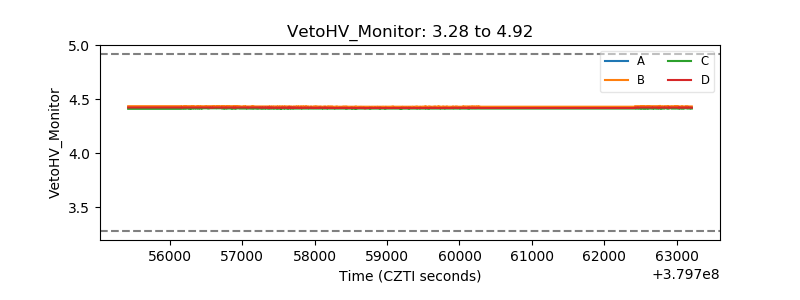 |
| Veto LLD | 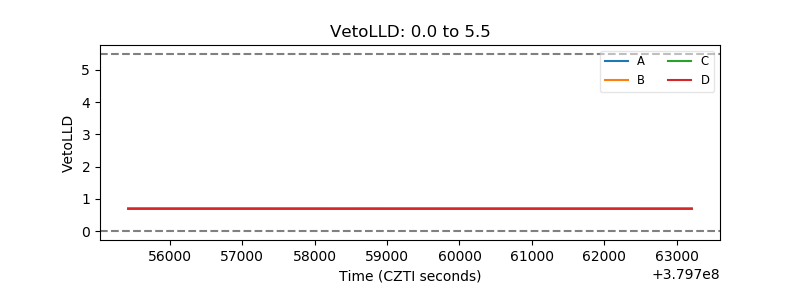 |
| Alpha Counter |  |
| _CPM_Rate | 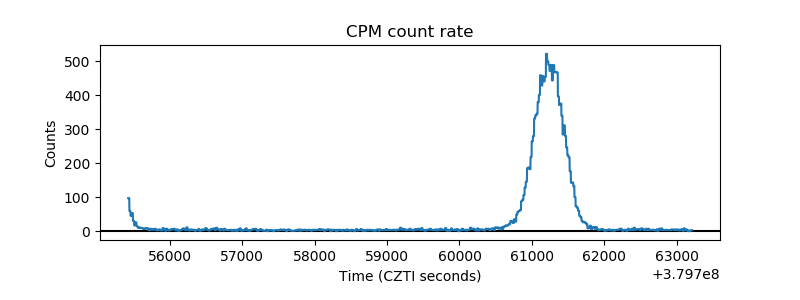 |
| CZT Counter | 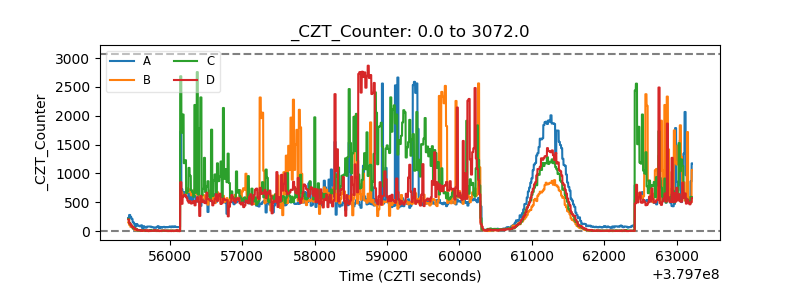 |
| +2.5 Volts monitor |  |
| +5 Volts monitor |  |
| _ROLL_ROT | 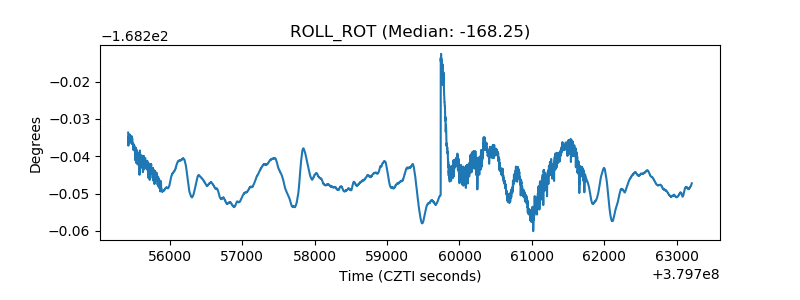 |
| _Roll_DEC | 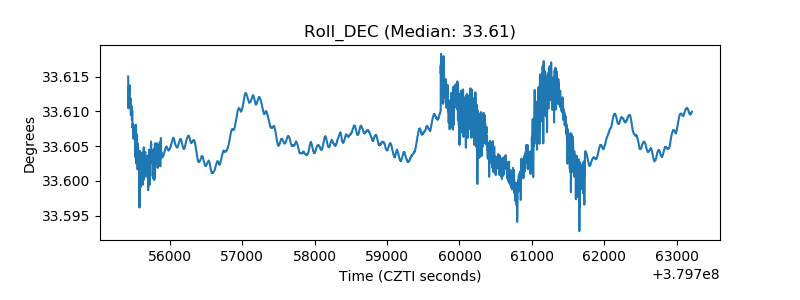 |
| _Roll_RA | 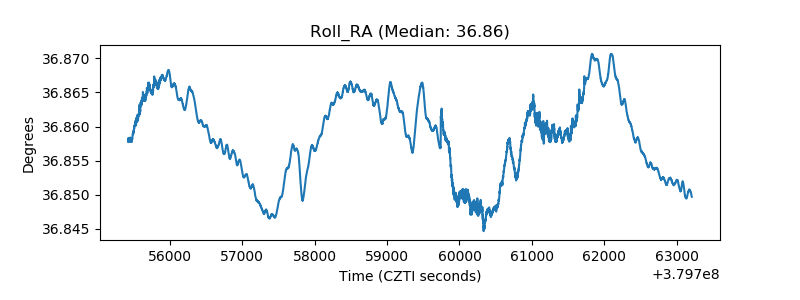 |
| Veto Counter | 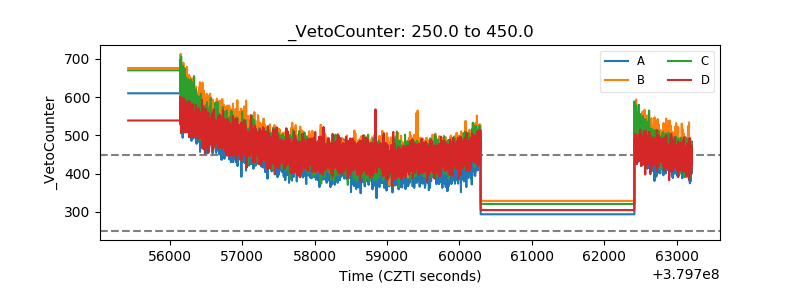 |