| Param | Original file | Final file |
|---|---|---|
| Filename | modeM0/AS1A06_003T04_9000004866_34034cztM0_level2.evt | modeM0/AS1A06_003T04_9000004866_34034cztM0_level2_quad_clean.evt |
| Size (bytes) | 547,997,760 | 89,493,120 |
| Size | 522.6 MB | 85.3 MB |
| Events in quadrant A | 3,827,816 | 592,853 |
| Events in quadrant B | 3,832,527 | 603,372 |
| Events in quadrant C | 4,193,389 | 588,058 |
| Events in quadrant D | 4,393,870 | 564,395 |
| Mode M9 | |||
|---|---|---|---|
| Quadrant | BADHDUFLAG | Total packets | Discarded packets |
| A | 0 | 30 | 0 |
| B | 0 | 30 | 0 |
| C | 0 | 30 | 0 |
| D | 0 | 31 | 0 |
| Mode M0 | |||
|---|---|---|---|
| Quadrant | BADHDUFLAG | Total packets | Discarded packets |
| A | 0 | 14534 | 3 |
| B | 0 | 14682 | 2 |
| C | 0 | 15836 | 2 |
| D | 0 | 16449 | 2 |
| Mode SS | |||
|---|---|---|---|
| Quadrant | BADHDUFLAG | Total packets | Discarded packets |
| A | 0 | 106 | 0 |
| B | 0 | 106 | 0 |
| C | 0 | 106 | 0 |
| D | 0 | 106 | 0 |
| Quadrant | Total seconds | Saturated seconds | Saturation percentage |
|---|---|---|---|
| A | 5149 | 370 | 7.185861% |
| B | 5149 | 340 | 6.603224% |
| C | 5149 | 228 | 4.428044% |
| D | 5149 | 268 | 5.204894% |
Noise dominated data is calculated using 1-second bins in cleaned event files. If a bin has >2000 counts, and if more than 50% of those come from <1% of pixels, then it is considered to be noise-dominated and hence unusable.
| Quadrant | # 1 sec bins | Bins with >0 counts | Bins with >2000 counts | High rate bins dominated by noise | Noise dominated (total time) | Noise dominated (detector-on time) | Marked lightcurve |
|---|---|---|---|---|---|---|---|
| A | 7063 | 5150 | 340 | 340 | 4.81% | 6.60% | 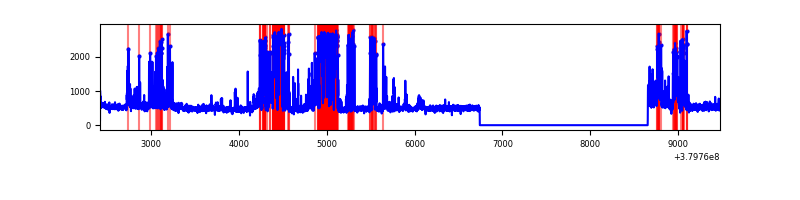 |
| B | 7063 | 5150 | 269 | 269 | 3.81% | 5.22% | 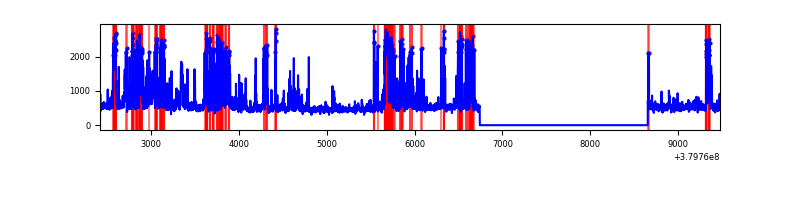 |
| C | 7063 | 5150 | 198 | 198 | 2.80% | 3.84% | 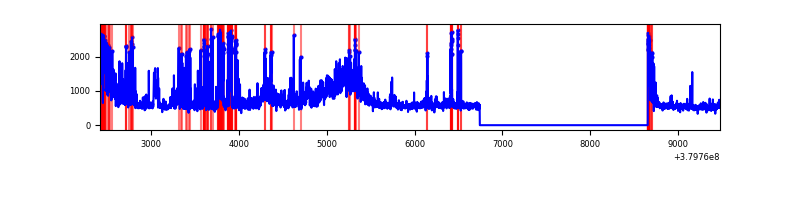 |
| D | 7063 | 5150 | 276 | 276 | 3.91% | 5.36% | 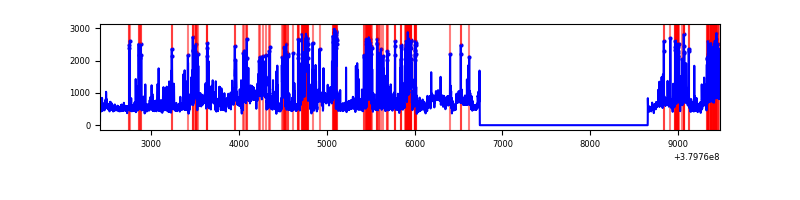 |
Top three noisy pixels from each quadrant. If the there are fewer than three noisy pixels in the level2.evt file, extra rows are filled as -1
| Pixel properties | Quadrant properties | ||||||
|---|---|---|---|---|---|---|---|
| Quadrant | DetID | PixID | Counts | Sigma | Mean | Median | Sigma |
| A | 15 | 169 | 1442260 | 11811.99 | 609 | 597 | 122.1 |
| A | 10 | 83 | 17563 | 139.0 | 609 | 597 | 122.1 |
| A | 13 | 6 | 13852 | 108.6 | 609 | 597 | 122.1 |
| B | 5 | 172 | 1081003 | 9485.84 | 604 | 591 | 113.9 |
| B | 15 | 222 | 117136 | 1023.25 | 604 | 591 | 113.9 |
| B | 0 | 189 | 60262 | 523.9 | 604 | 591 | 113.9 |
| C | 3 | 233 | 809962 | 5930.82 | 587 | 592 | 136.5 |
| C | 4 | 254 | 559510 | 4095.58 | 587 | 592 | 136.5 |
| C | 15 | 214 | 236443 | 1728.24 | 587 | 592 | 136.5 |
| D | 8 | 195 | 828993 | 5690.36 | 595 | 580 | 145.6 |
| D | 2 | 249 | 489317 | 3357.13 | 595 | 580 | 145.6 |
| D | 13 | 249 | 184052 | 1260.27 | 595 | 580 | 145.6 |
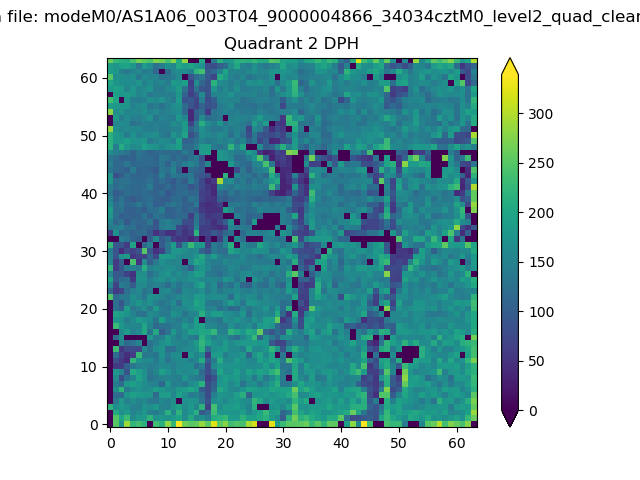
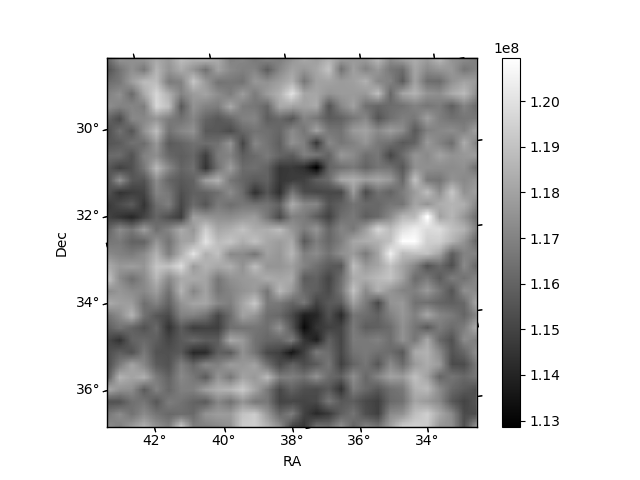
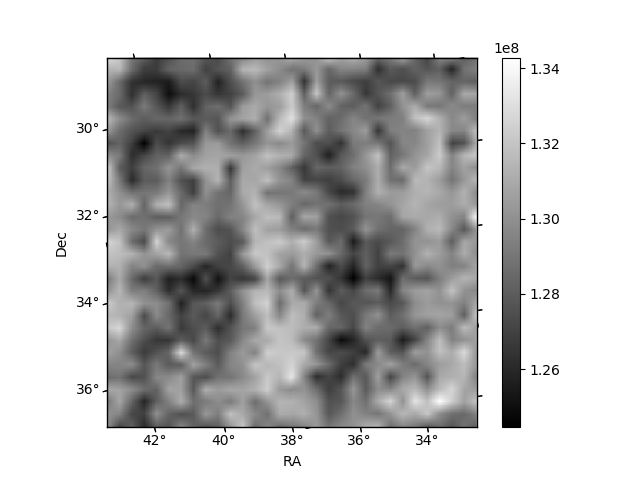
Histogram calculated using DETX and DETY for each event in the final _common_clean file
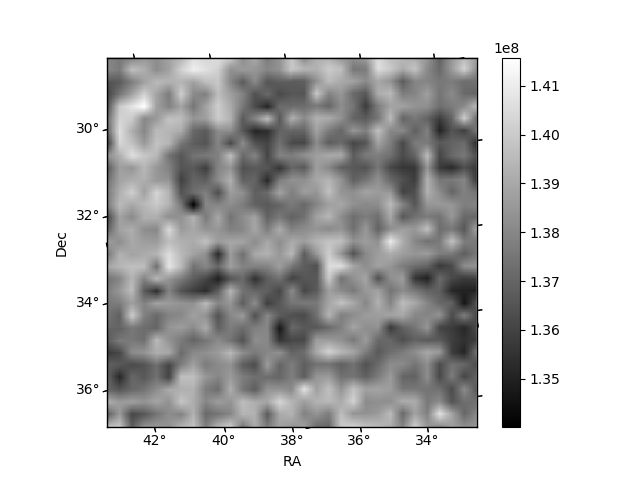
| Quadrant A |  |
 |
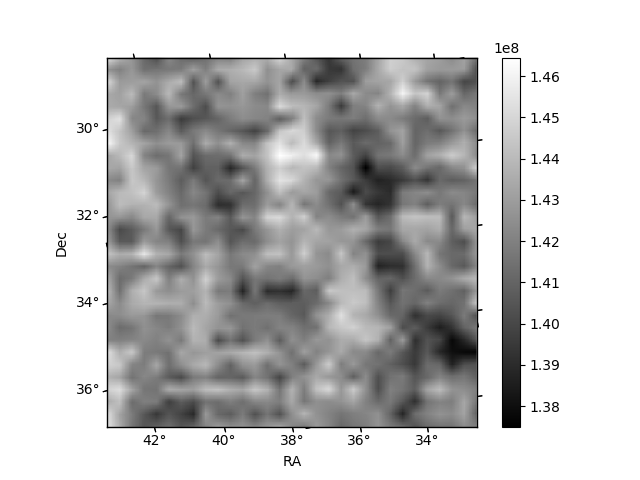
Quadrant B |
|---|---|---|---|
| Quadrant D | 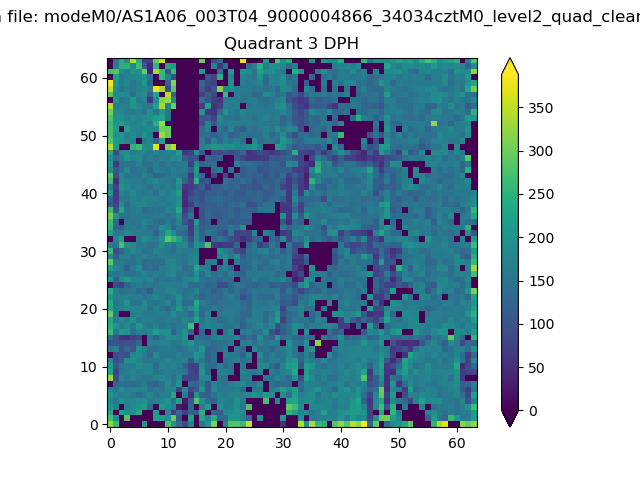 |
 |
Quadrant C |
| Plot type | Count rate plots | Images |
|---|---|---|
| Comparison with Poisson distribution Blue bars denote a histogram of data divided into 1 sec bins. Red curve is a Poisson curve with rate = median count rate of data. |
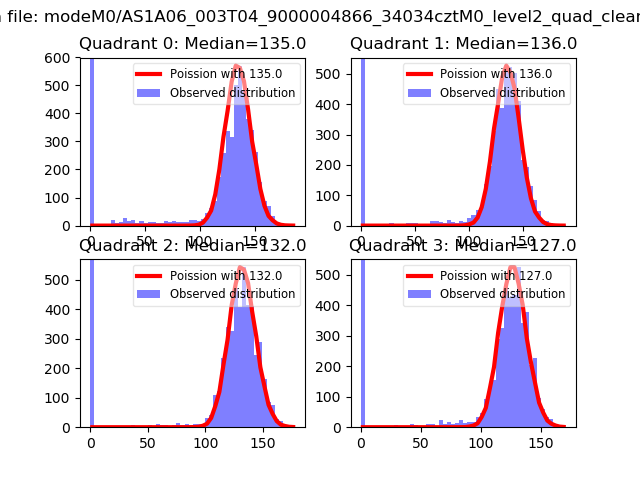 |
 |
| Quadrant-wise count rates Data is divided into 100 sec bins |
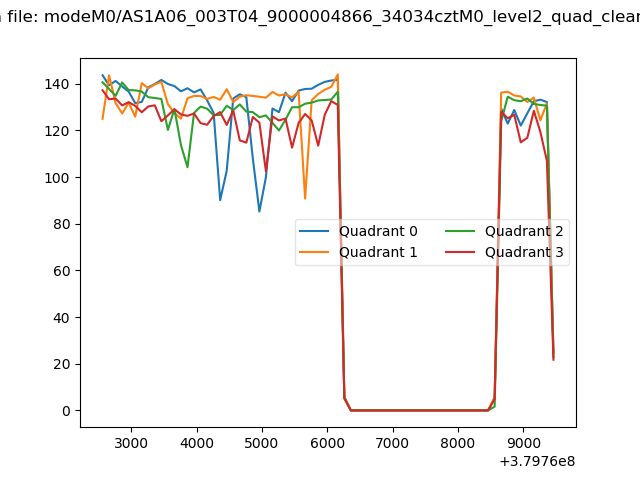 |
|
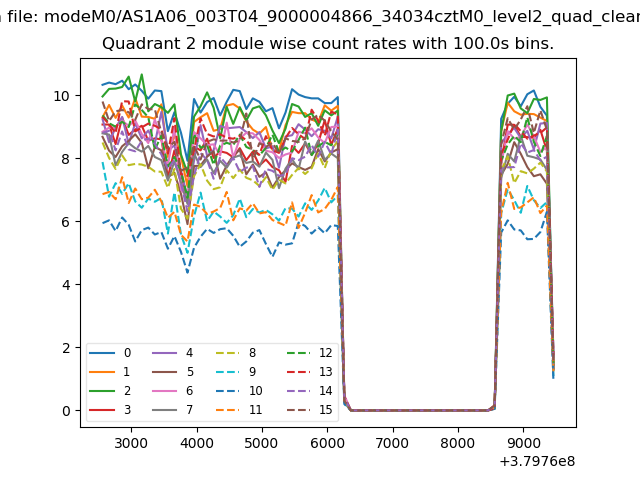
| Module-wise count rates for Quadrant A Data is divided into 100 sec bins |
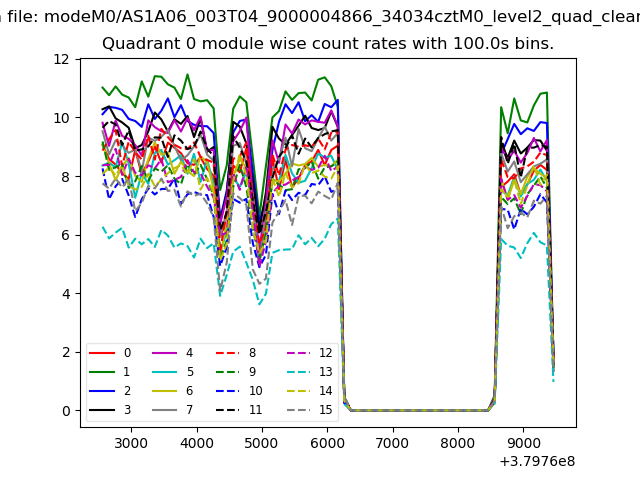 |
 |
| Module-wise count rates for Quadrant B Data is divided into 100 sec bins |
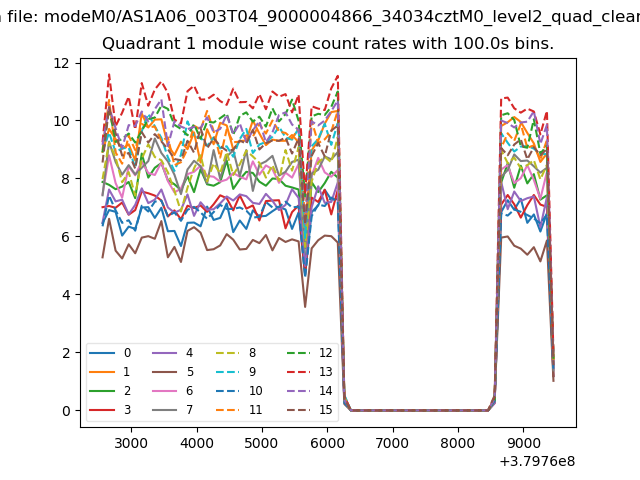 |
 |
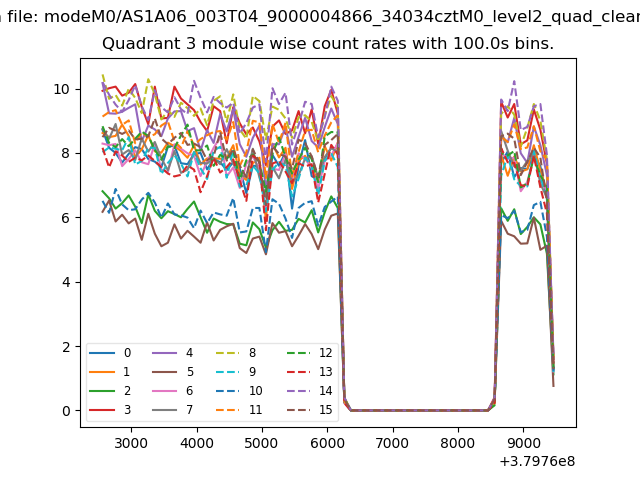
| Module-wise count rates for Quadrant C Data is divided into 100 sec bins |
 |
 |
| Module-wise count rates for Quadrant D Data is divided into 100 sec bins |
 |
 |
| Parameter | Plot |
|---|---|
| CZT HV Monitor | 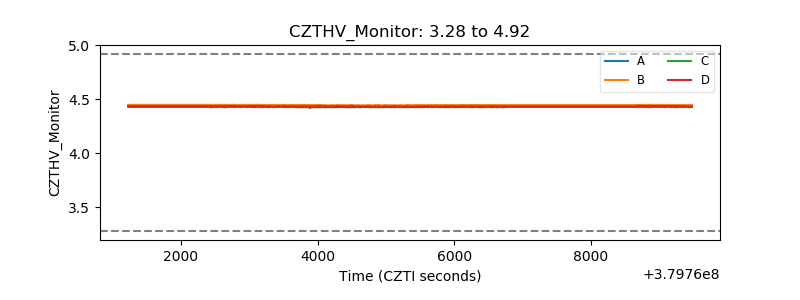 |
| D_VDD | 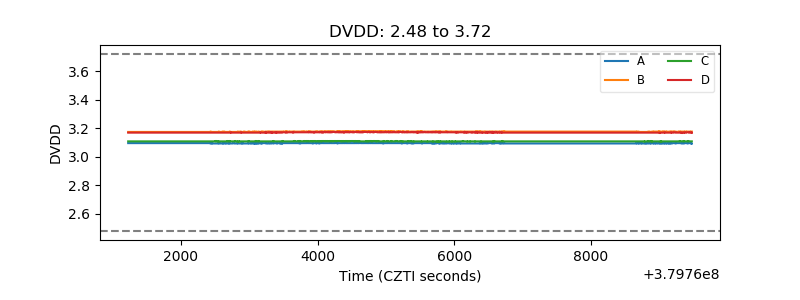 |
| Temperature 1 | 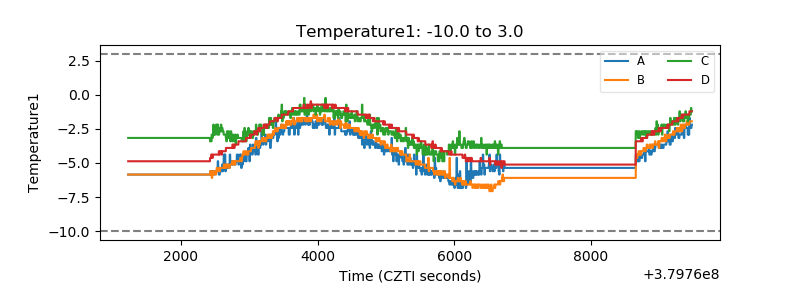 |
| Veto HV Monitor |  |
| Veto LLD | 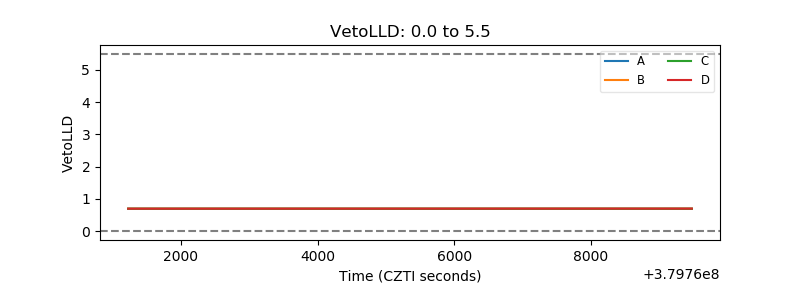 |
| Alpha Counter | 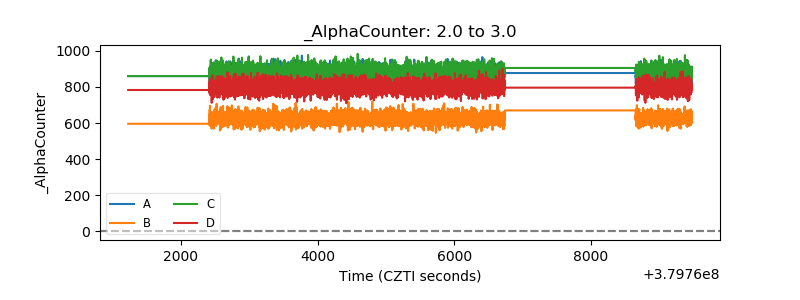 |
| _CPM_Rate | 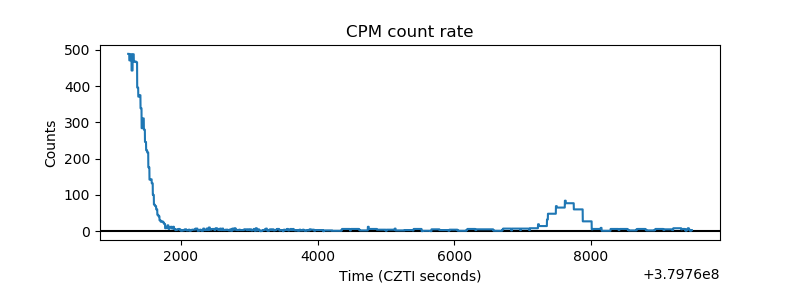 |
| CZT Counter | 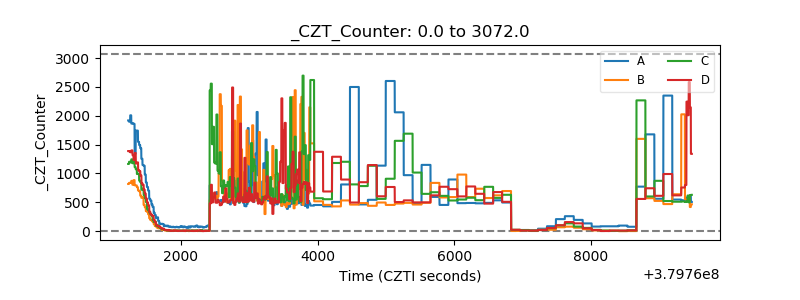 |
| +2.5 Volts monitor |  |
| +5 Volts monitor |  |
| _ROLL_ROT | 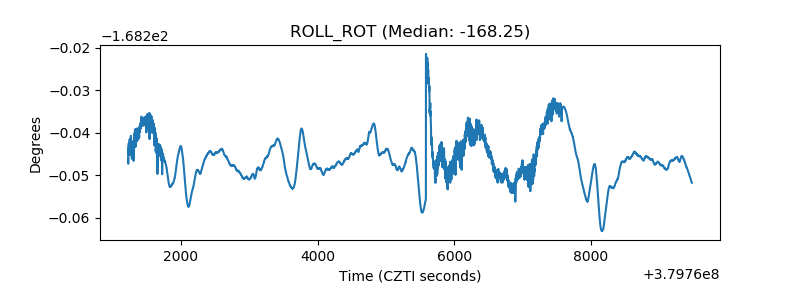 |
| _Roll_DEC | 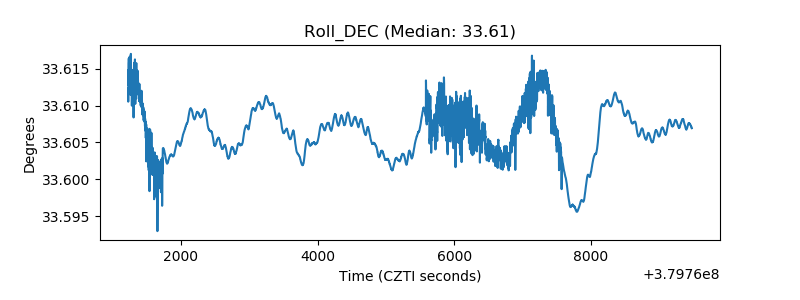 |
| _Roll_RA | 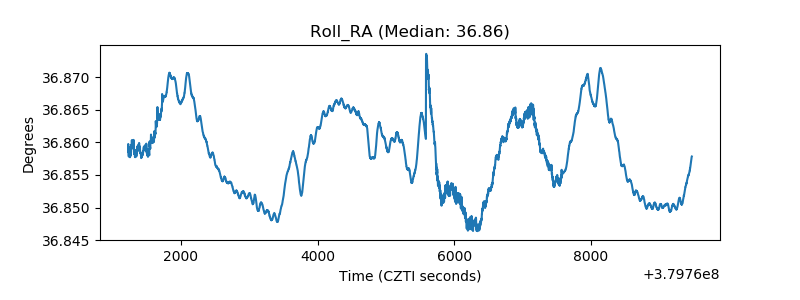 |
| Veto Counter | 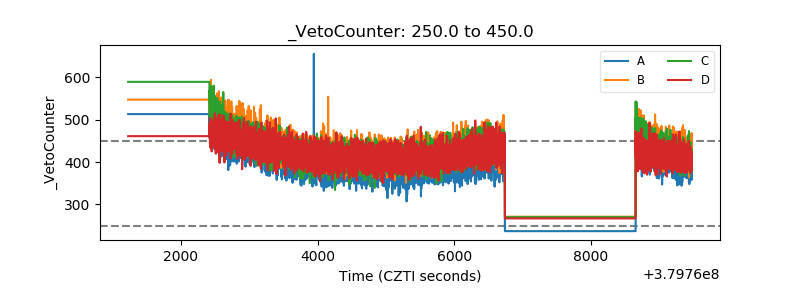 |