| Param | Original file | Final file |
|---|---|---|
| Filename | modeM0/AS1A06_003T04_9000004866_34035cztM0_level2.evt | modeM0/AS1A06_003T04_9000004866_34035cztM0_level2_quad_clean.evt |
| Size (bytes) | 577,177,920 | 83,888,640 |
| Size | 550.4 MB | 80.0 MB |
| Events in quadrant A | 3,517,074 | 551,913 |
| Events in quadrant B | 3,821,929 | 553,343 |
| Events in quadrant C | 3,970,625 | 541,539 |
| Events in quadrant D | 5,793,306 | 503,212 |
| Mode M9 | |||
|---|---|---|---|
| Quadrant | BADHDUFLAG | Total packets | Discarded packets |
| A | 0 | 16 | 0 |
| B | 0 | 16 | 0 |
| C | 0 | 16 | 0 |
| D | 0 | 16 | 0 |
| Mode M0 | |||
|---|---|---|---|
| Quadrant | BADHDUFLAG | Total packets | Discarded packets |
| A | 0 | 14022 | 2 |
| B | 0 | 14927 | 1 |
| C | 0 | 15315 | 1 |
| D | 0 | 21046 | 1 |
| Mode SS | |||
|---|---|---|---|
| Quadrant | BADHDUFLAG | Total packets | Discarded packets |
| A | 0 | 112 | 0 |
| B | 0 | 112 | 0 |
| C | 0 | 112 | 0 |
| D | 0 | 112 | 0 |
| Quadrant | Total seconds | Saturated seconds | Saturation percentage |
|---|---|---|---|
| A | 5580 | 283 | 5.071685% |
| B | 5580 | 226 | 4.050179% |
| C | 5580 | 117 | 2.096774% |
| D | 5580 | 745 | 13.351254% |
Noise dominated data is calculated using 1-second bins in cleaned event files. If a bin has >2000 counts, and if more than 50% of those come from <1% of pixels, then it is considered to be noise-dominated and hence unusable.
| Quadrant | # 1 sec bins | Bins with >0 counts | Bins with >2000 counts | High rate bins dominated by noise | Noise dominated (total time) | Noise dominated (detector-on time) | Marked lightcurve |
|---|---|---|---|---|---|---|---|
| A | 7133 | 5581 | 244 | 244 | 3.42% | 4.37% | 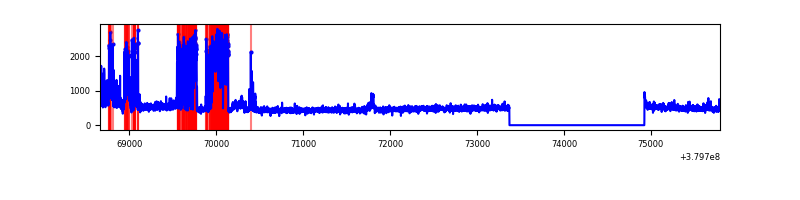 |
| B | 7133 | 5581 | 168 | 168 | 2.36% | 3.01% | 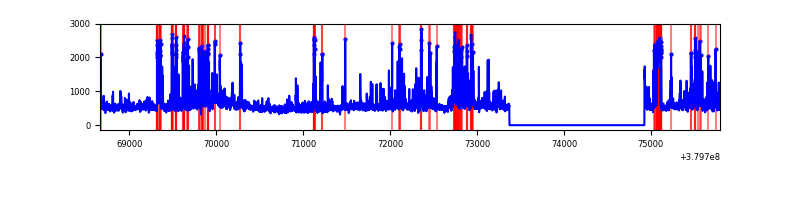 |
| C | 7133 | 5581 | 93 | 93 | 1.30% | 1.67% | 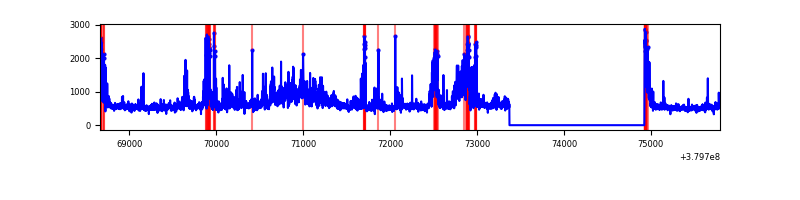 |
| D | 7133 | 5581 | 720 | 720 | 10.09% | 12.90% | 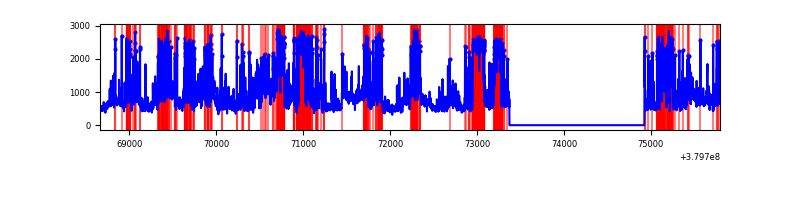 |
Top three noisy pixels from each quadrant. If the there are fewer than three noisy pixels in the level2.evt file, extra rows are filled as -1
| Pixel properties | Quadrant properties | ||||||
|---|---|---|---|---|---|---|---|
| Quadrant | DetID | PixID | Counts | Sigma | Mean | Median | Sigma |
| A | 15 | 169 | 931899 | 7153.81 | 651 | 638 | 130.2 |
| A | 0 | 31 | 45373 | 343.65 | 651 | 638 | 130.2 |
| A | 10 | 83 | 16695 | 123.35 | 651 | 638 | 130.2 |
| B | 5 | 172 | 784321 | 6324.44 | 645 | 630 | 123.9 |
| B | 0 | 219 | 188565 | 1516.65 | 645 | 630 | 123.9 |
| B | 0 | 189 | 111120 | 891.66 | 645 | 630 | 123.9 |
| C | 3 | 233 | 826919 | 5698.23 | 629 | 635 | 145.0 |
| C | 15 | 214 | 259803 | 1787.28 | 629 | 635 | 145.0 |
| C | 0 | 10 | 186659 | 1282.86 | 629 | 635 | 145.0 |
| D | 2 | 249 | 1633246 | 10386.06 | 599 | 584 | 157.2 |
| D | 8 | 195 | 869818 | 5529.57 | 599 | 584 | 157.2 |
| D | 13 | 249 | 448958 | 2852.3 | 599 | 584 | 157.2 |
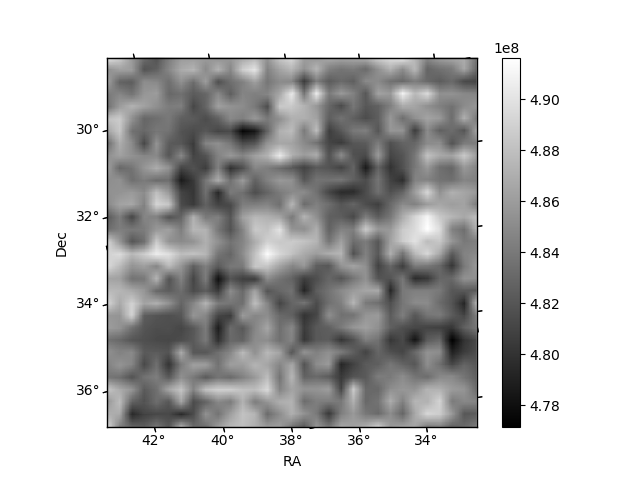
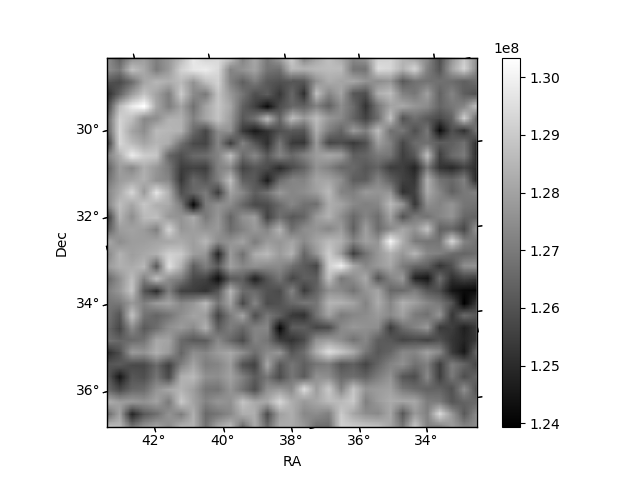
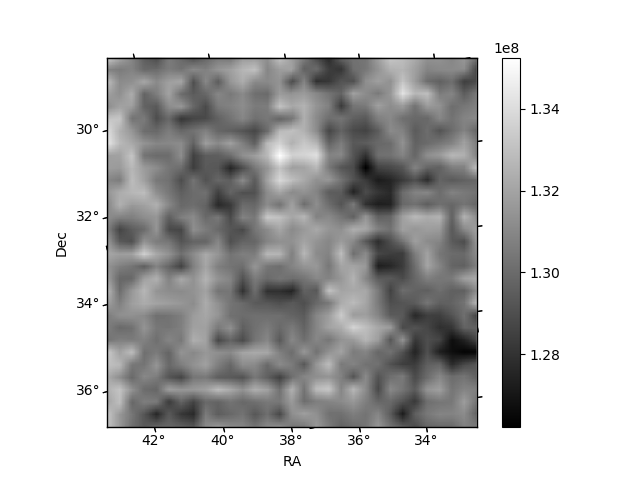
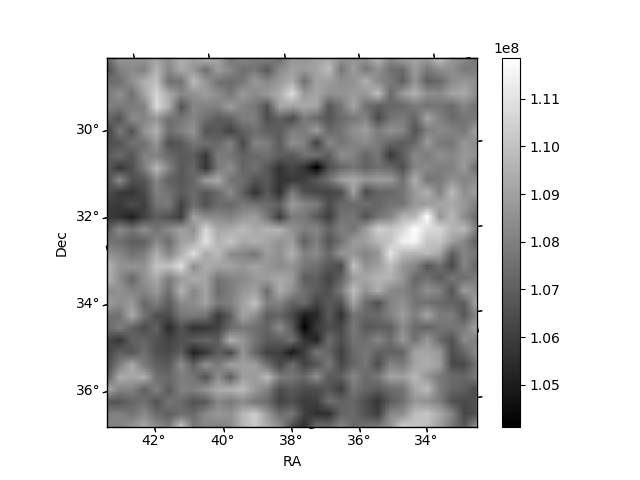
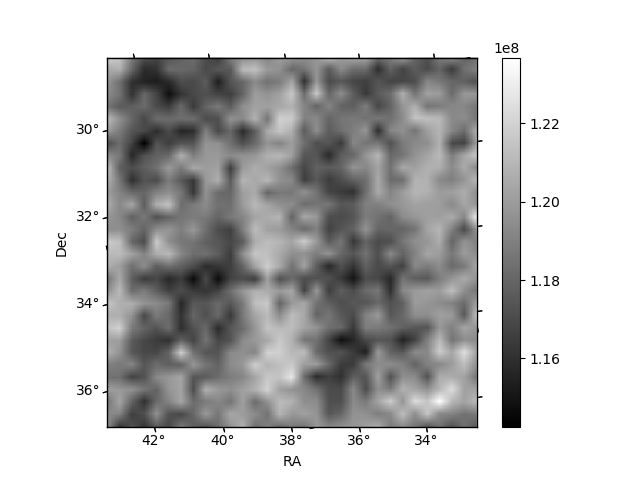
Histogram calculated using DETX and DETY for each event in the final _common_clean file
| Quadrant A | 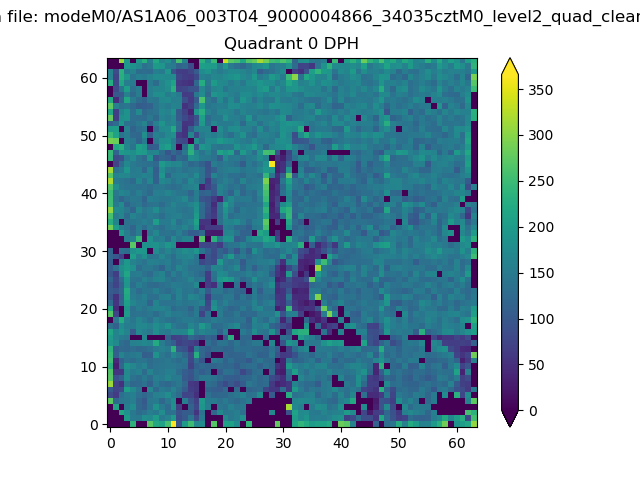 |
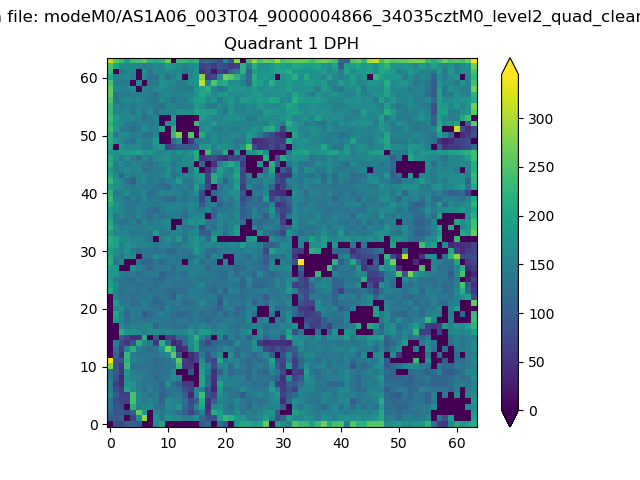 |
Quadrant B |
|---|---|---|---|
| Quadrant D | 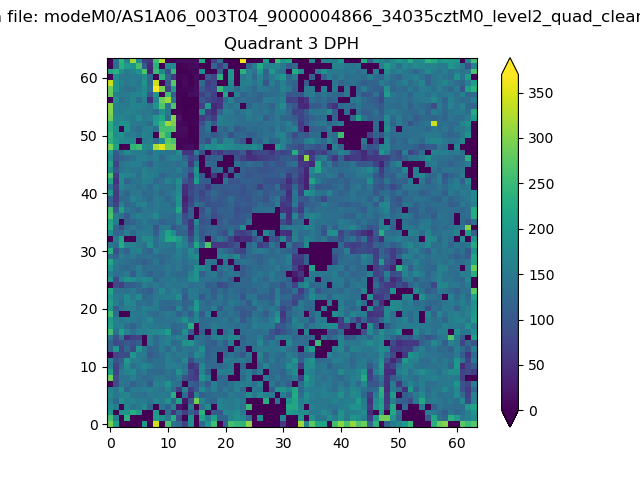 |
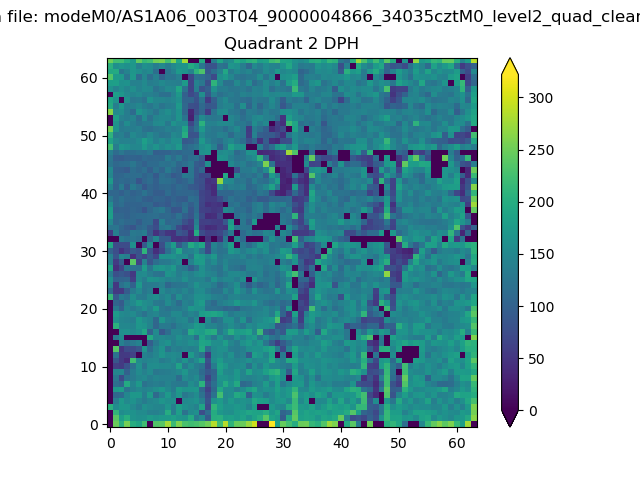 |
Quadrant C |
| Plot type | Count rate plots | Images |
|---|---|---|
| Comparison with Poisson distribution Blue bars denote a histogram of data divided into 1 sec bins. Red curve is a Poisson curve with rate = median count rate of data. |
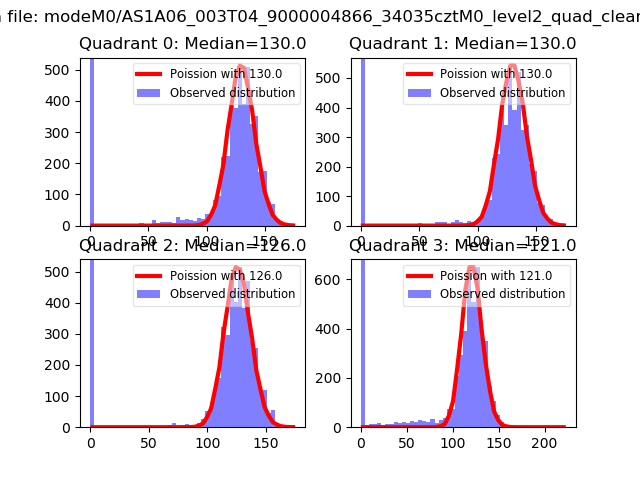 |
 |
| Quadrant-wise count rates Data is divided into 100 sec bins |
 |
|
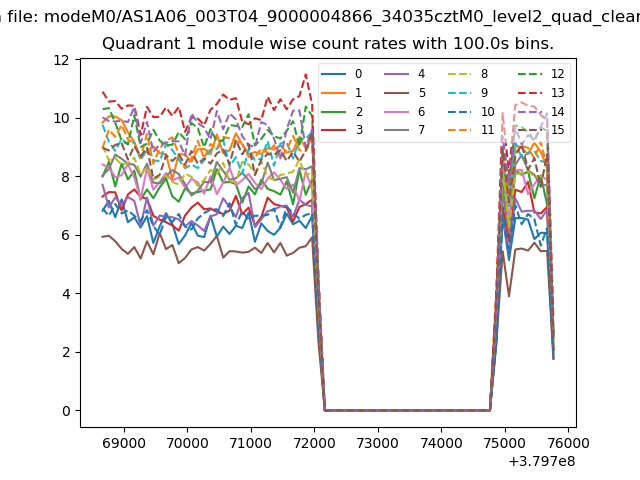
| Module-wise count rates for Quadrant A Data is divided into 100 sec bins |
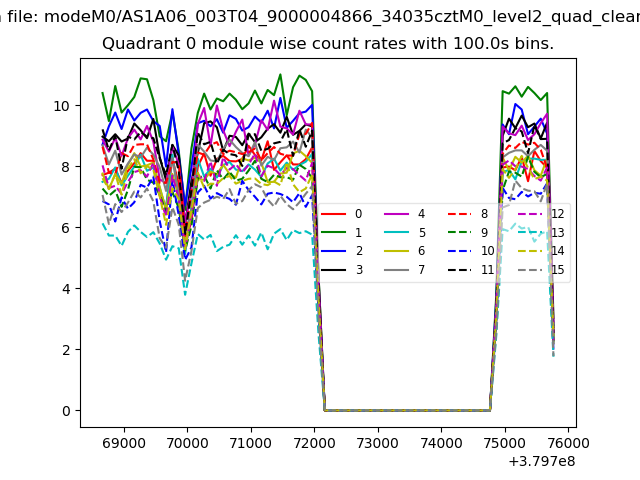 |
 |
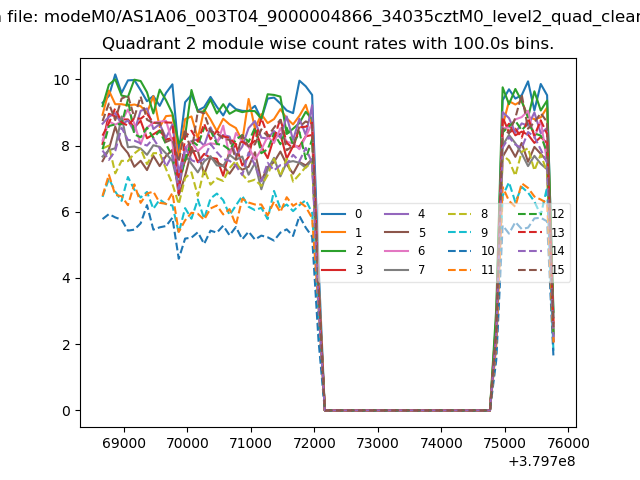
| Module-wise count rates for Quadrant B Data is divided into 100 sec bins |
 |
 |
| Module-wise count rates for Quadrant C Data is divided into 100 sec bins |
 |
 |
| Module-wise count rates for Quadrant D Data is divided into 100 sec bins |
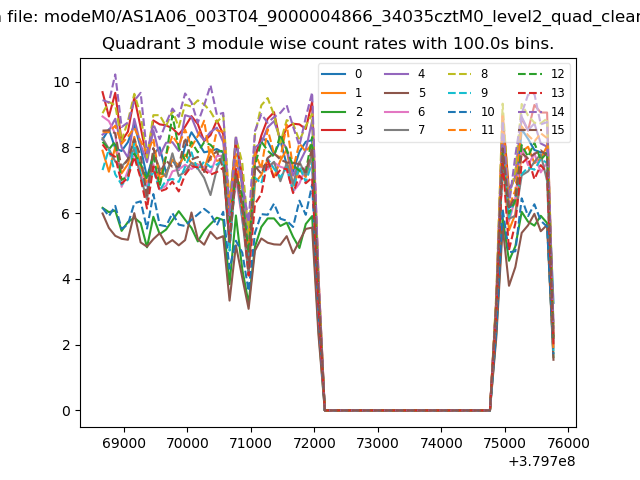 |
 |
| Parameter | Plot |
|---|---|
| CZT HV Monitor | 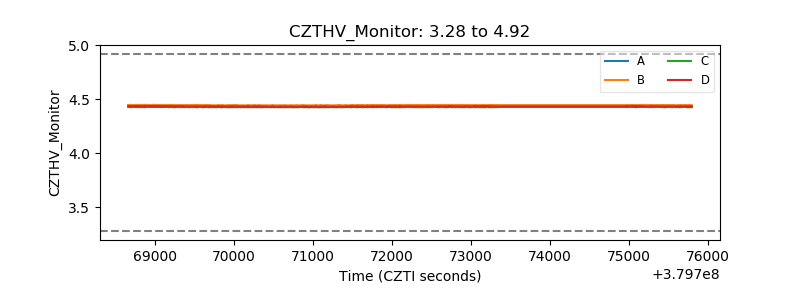 |
| D_VDD | 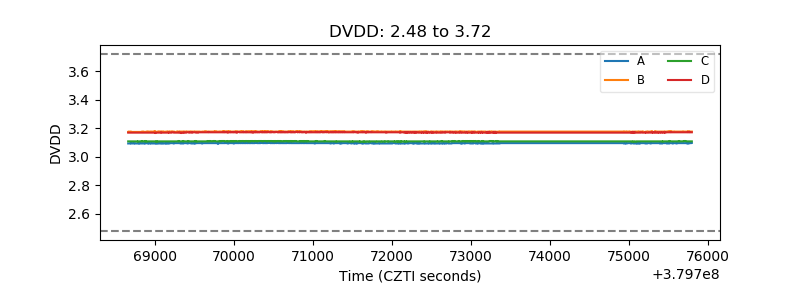 |
| Temperature 1 | 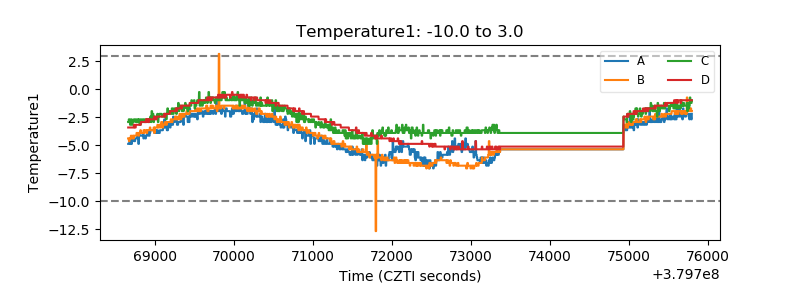 |
| Veto HV Monitor |  |
| Veto LLD |  |
| Alpha Counter |  |
| _CPM_Rate | 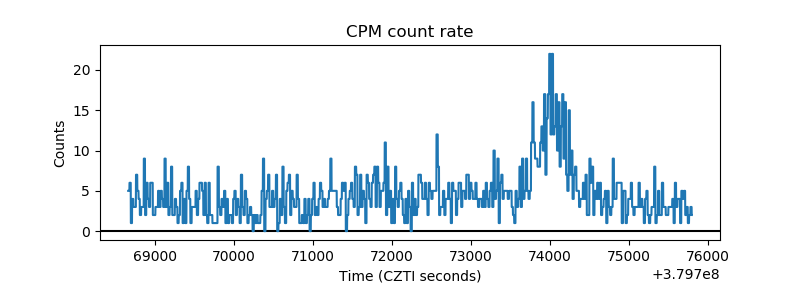 |
| CZT Counter | 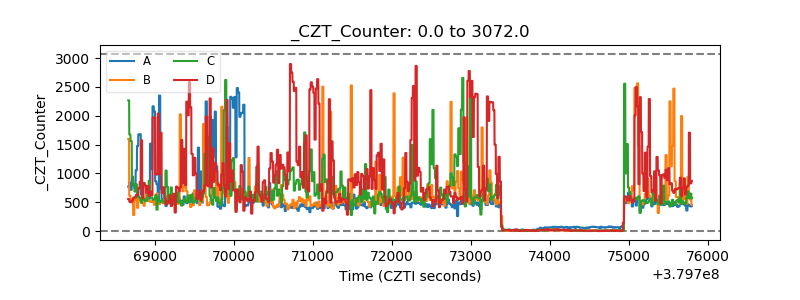 |
| +2.5 Volts monitor |  |
| +5 Volts monitor |  |
| _ROLL_ROT | 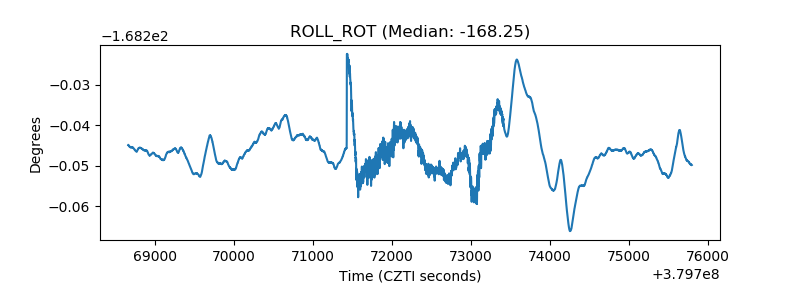 |
| _Roll_DEC | 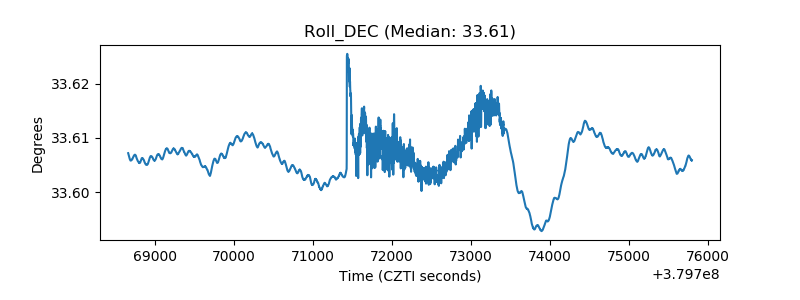 |
| _Roll_RA | 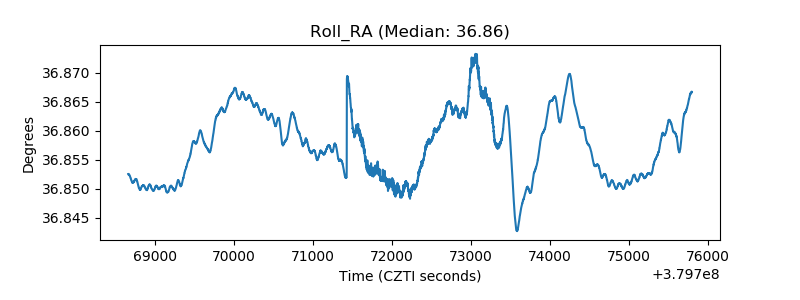 |
| Veto Counter | 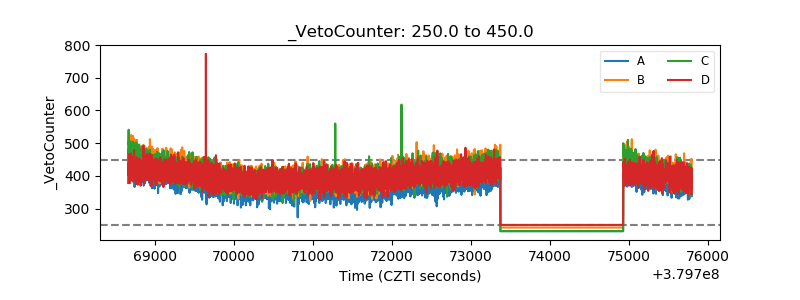 |