| Param | Original file | Final file |
|---|---|---|
| Filename | modeM0/AS1A06_003T04_9000004866_34036cztM0_level2.evt | modeM0/AS1A06_003T04_9000004866_34036cztM0_level2_quad_clean.evt |
| Size (bytes) | 540,849,600 | 77,866,560 |
| Size | 515.8 MB | 74.3 MB |
| Events in quadrant A | 2,708,771 | 508,072 |
| Events in quadrant B | 4,311,349 | 491,113 |
| Events in quadrant C | 4,020,925 | 484,702 |
| Events in quadrant D | 4,942,311 | 464,994 |
| Mode M9 | |||
|---|---|---|---|
| Quadrant | BADHDUFLAG | Total packets | Discarded packets |
| A | 0 | 19 | 0 |
| B | 0 | 19 | 0 |
| C | 0 | 19 | 0 |
| D | 0 | 20 | 0 |
| Mode M0 | |||
|---|---|---|---|
| Quadrant | BADHDUFLAG | Total packets | Discarded packets |
| A | 0 | 11871 | 2 |
| B | 0 | 16643 | 1 |
| C | 0 | 15691 | 1 |
| D | 0 | 18617 | 1 |
| Mode SS | |||
|---|---|---|---|
| Quadrant | BADHDUFLAG | Total packets | Discarded packets |
| A | 0 | 118 | 0 |
| B | 0 | 118 | 0 |
| C | 0 | 118 | 0 |
| D | 0 | 118 | 0 |
| Quadrant | Total seconds | Saturated seconds | Saturation percentage |
|---|---|---|---|
| A | 5853 | 9 | 0.153767% |
| B | 5853 | 349 | 5.962754% |
| C | 5853 | 130 | 2.221083% |
| D | 5853 | 478 | 8.166752% |
Noise dominated data is calculated using 1-second bins in cleaned event files. If a bin has >2000 counts, and if more than 50% of those come from <1% of pixels, then it is considered to be noise-dominated and hence unusable.
| Quadrant | # 1 sec bins | Bins with >0 counts | Bins with >2000 counts | High rate bins dominated by noise | Noise dominated (total time) | Noise dominated (detector-on time) | Marked lightcurve |
|---|---|---|---|---|---|---|---|
| A | 7196 | 5854 | 3 | 3 | 0.04% | 0.05% | 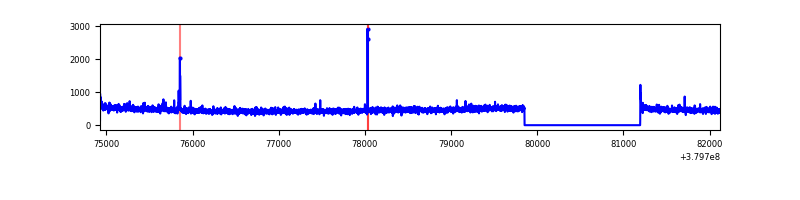 |
| B | 7196 | 5854 | 258 | 258 | 3.59% | 4.41% | 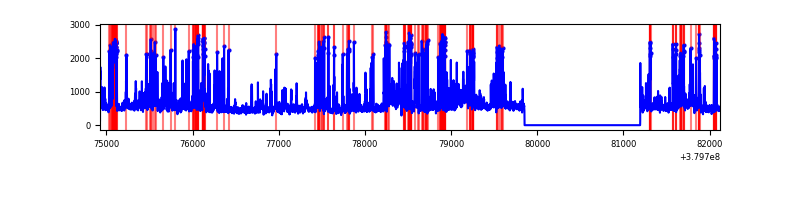 |
| C | 7196 | 5854 | 100 | 100 | 1.39% | 1.71% | 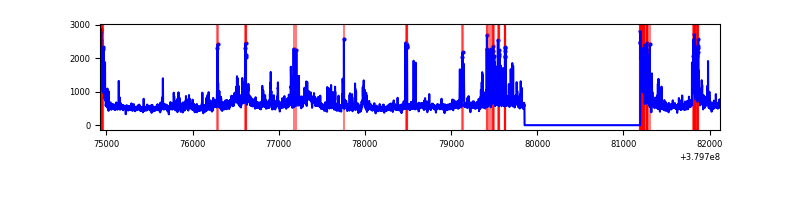 |
| D | 7196 | 5854 | 459 | 459 | 6.38% | 7.84% | 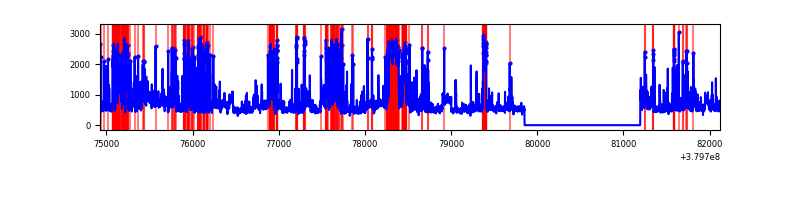 |
Top three noisy pixels from each quadrant. If the there are fewer than three noisy pixels in the level2.evt file, extra rows are filled as -1
| Pixel properties | Quadrant properties | ||||||
|---|---|---|---|---|---|---|---|
| Quadrant | DetID | PixID | Counts | Sigma | Mean | Median | Sigma |
| A | 0 | 31 | 25801 | 183.12 | 683 | 669 | 137.2 |
| A | 10 | 83 | 18871 | 132.63 | 683 | 669 | 137.2 |
| A | 13 | 6 | 16658 | 116.5 | 683 | 669 | 137.2 |
| B | 5 | 172 | 1102747 | 8613.41 | 663 | 646 | 128.0 |
| B | 0 | 189 | 180081 | 1402.36 | 663 | 646 | 128.0 |
| B | 15 | 85 | 123535 | 960.43 | 663 | 646 | 128.0 |
| C | 3 | 233 | 509898 | 3381.78 | 655 | 661 | 150.6 |
| C | 0 | 207 | 474312 | 3145.46 | 655 | 661 | 150.6 |
| C | 15 | 214 | 271144 | 1796.24 | 655 | 661 | 150.6 |
| D | 2 | 249 | 666108 | 4214.53 | 643 | 625 | 157.9 |
| D | 8 | 195 | 567340 | 3589.02 | 643 | 625 | 157.9 |
| D | 13 | 249 | 519773 | 3287.78 | 643 | 625 | 157.9 |
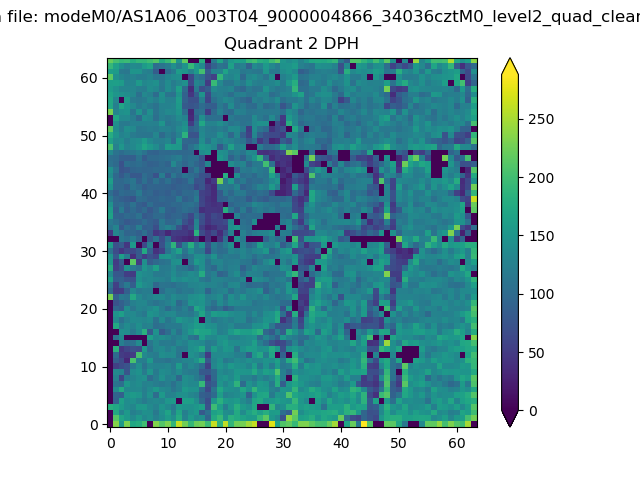
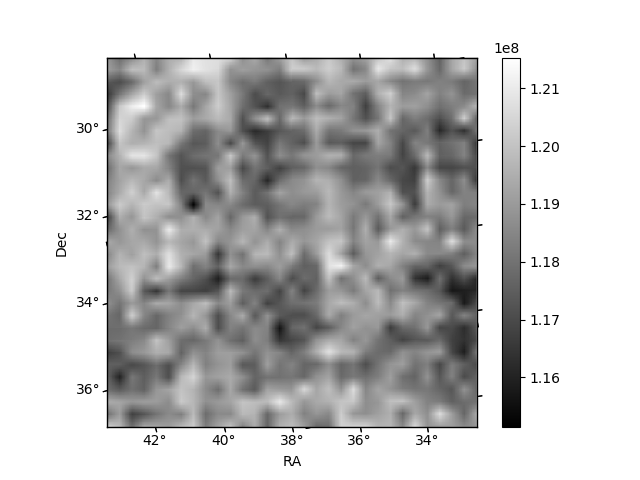
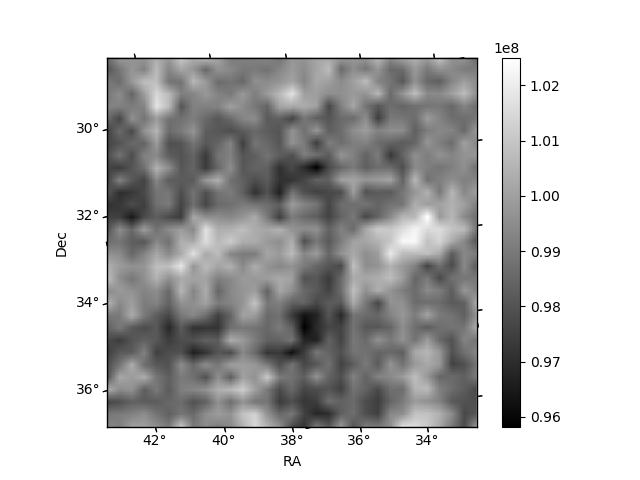
Histogram calculated using DETX and DETY for each event in the final _common_clean file
| Quadrant A |  |
 |
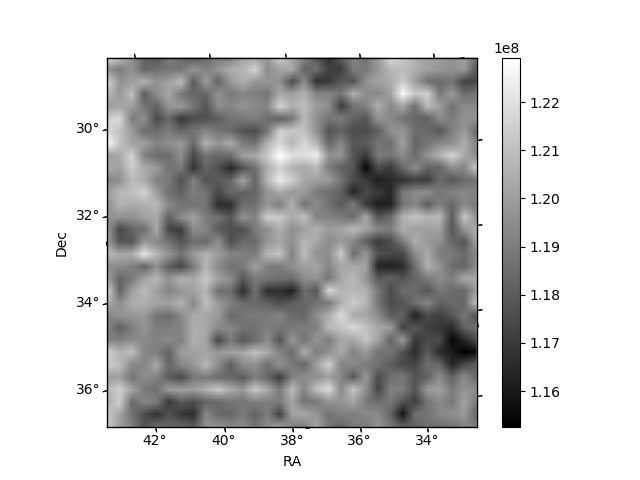
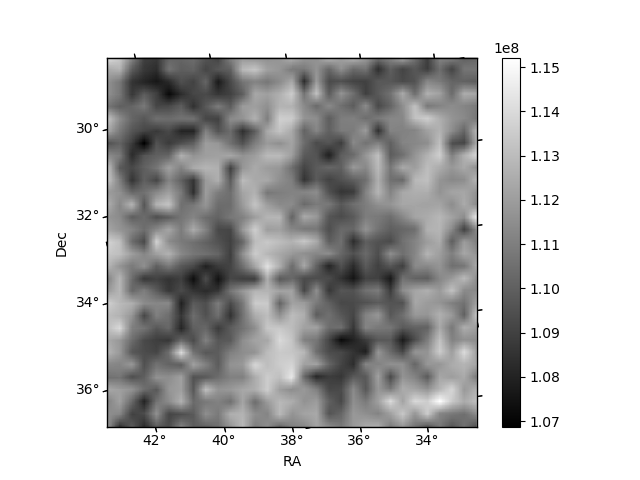
Quadrant B |
|---|---|---|---|
| Quadrant D |  |
 |
Quadrant C |
| Plot type | Count rate plots | Images |
|---|---|---|
| Comparison with Poisson distribution Blue bars denote a histogram of data divided into 1 sec bins. Red curve is a Poisson curve with rate = median count rate of data. |
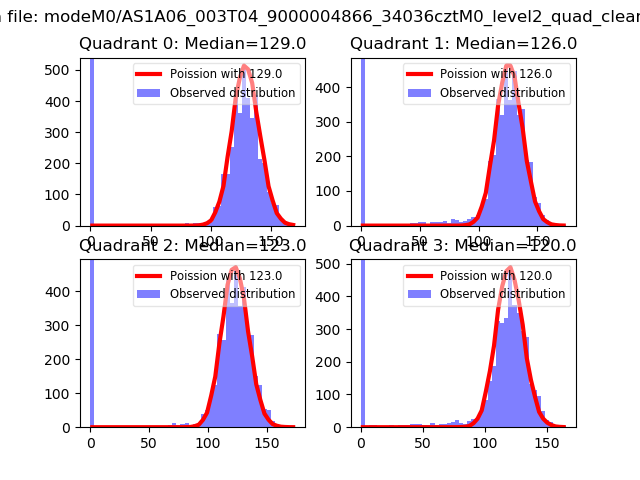 |
 |
| Quadrant-wise count rates Data is divided into 100 sec bins |
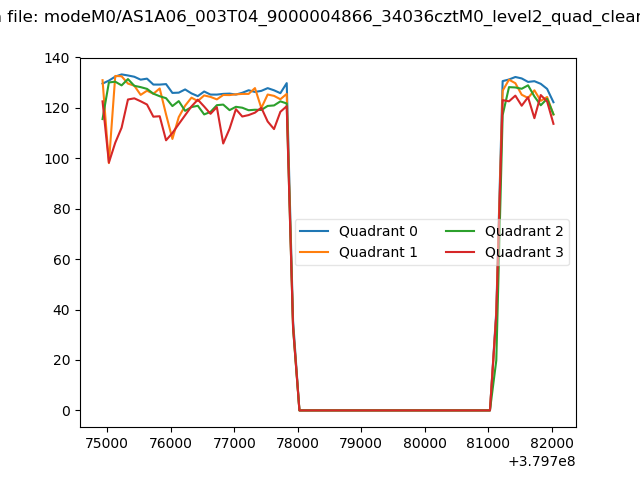 |
|
| Module-wise count rates for Quadrant A Data is divided into 100 sec bins |
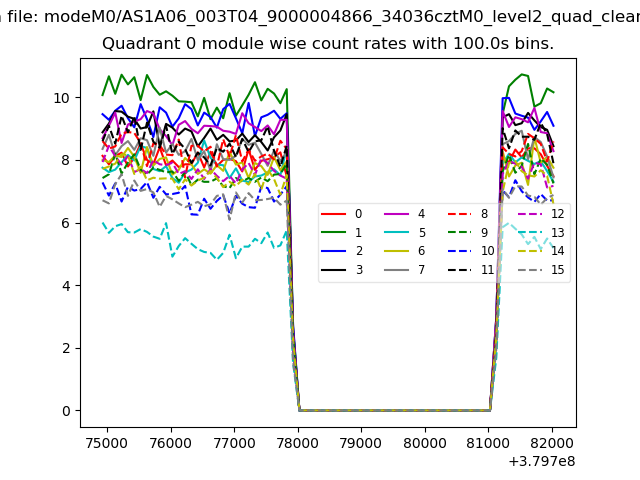 |
 |
| Module-wise count rates for Quadrant B Data is divided into 100 sec bins |
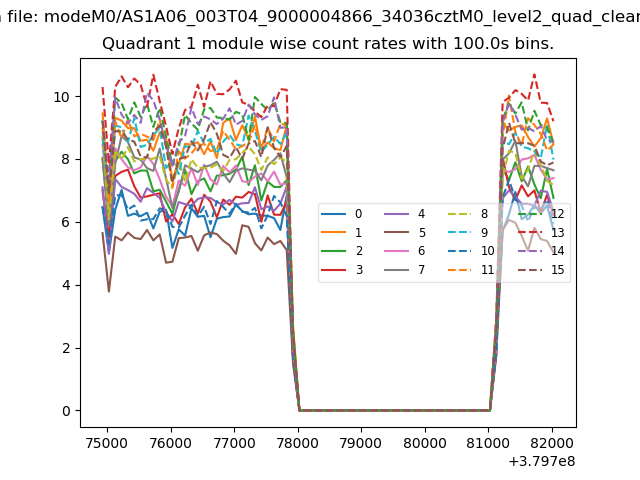 |
 |
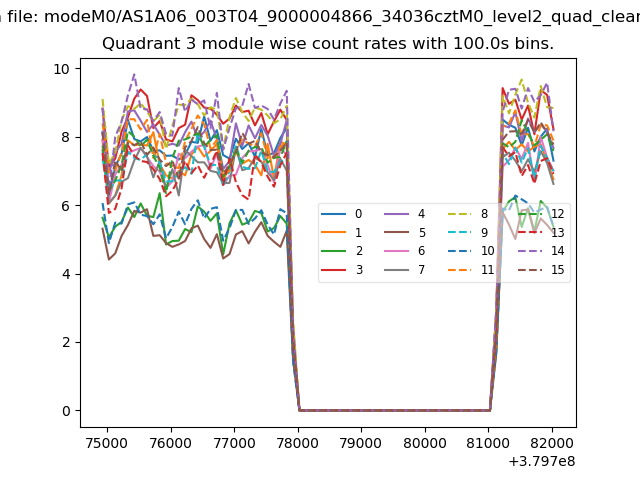
| Module-wise count rates for Quadrant C Data is divided into 100 sec bins |
 |
 |
| Module-wise count rates for Quadrant D Data is divided into 100 sec bins |
 |
 |
| Parameter | Plot |
|---|---|
| CZT HV Monitor |  |
| D_VDD | 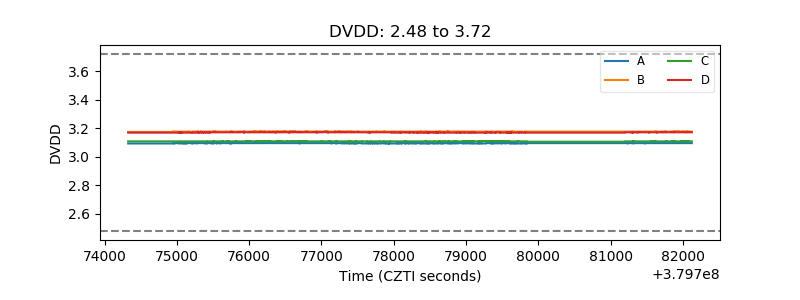 |
| Temperature 1 | 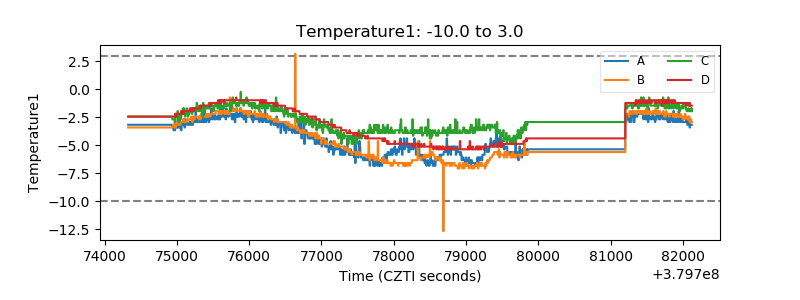 |
| Veto HV Monitor | 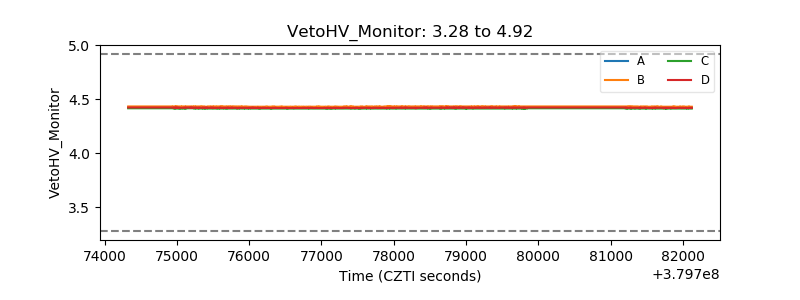 |
| Veto LLD | 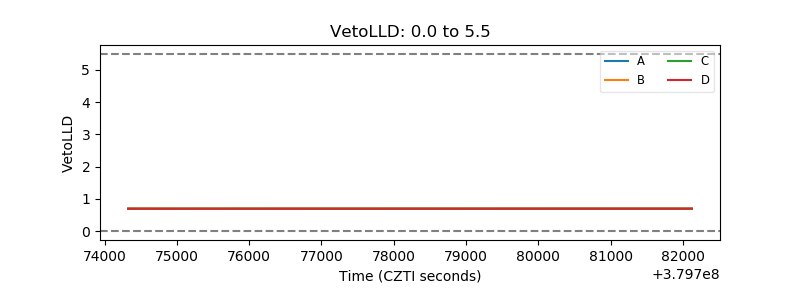 |
| Alpha Counter | 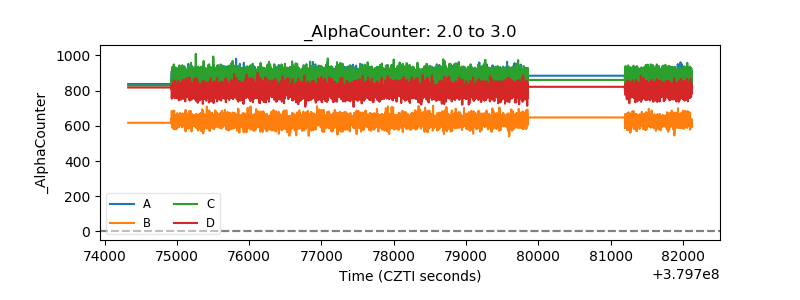 |
| _CPM_Rate | 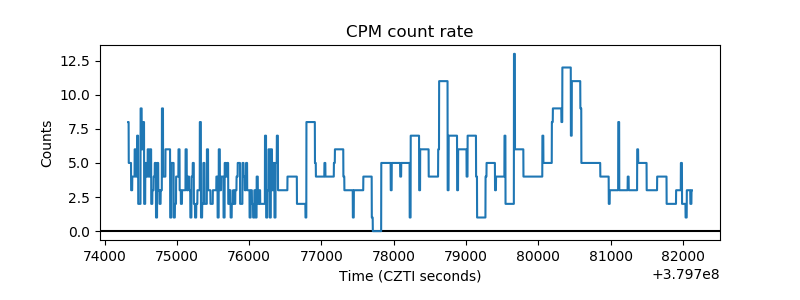 |
| CZT Counter | 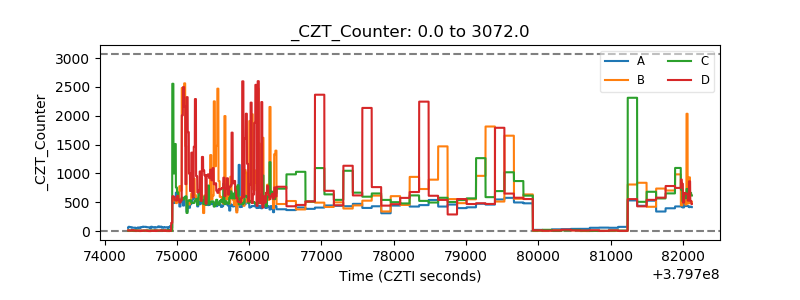 |
| +2.5 Volts monitor |  |
| +5 Volts monitor | 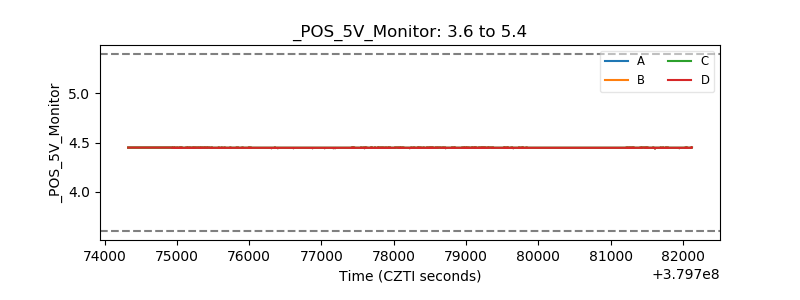 |
| _ROLL_ROT | 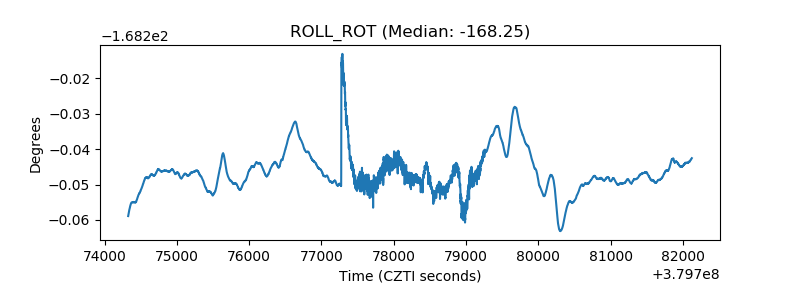 |
| _Roll_DEC | 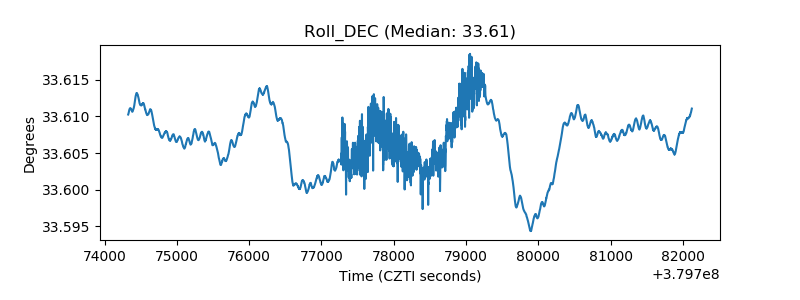 |
| _Roll_RA | 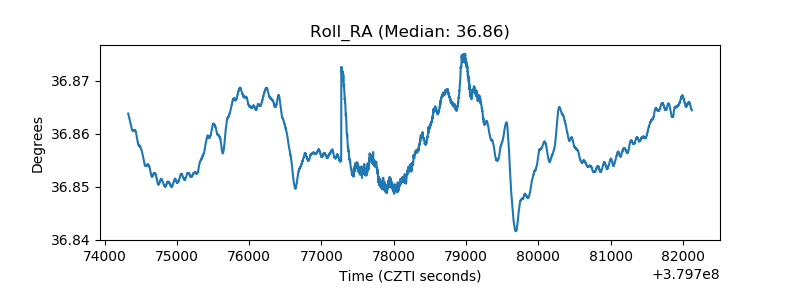 |
| Veto Counter | 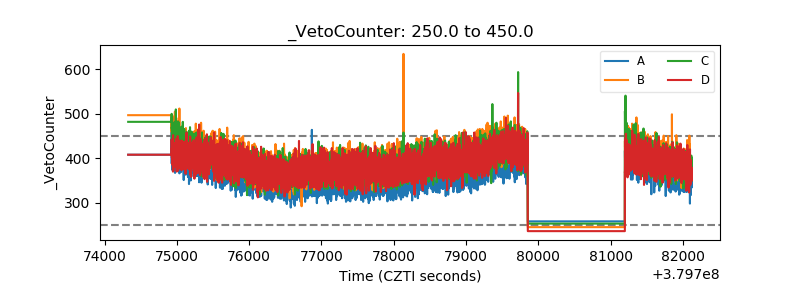 |