| Param | Original file | Final file |
|---|---|---|
| Filename | modeM0/AS1A06_003T04_9000004866_34040cztM0_level2.evt | modeM0/AS1A06_003T04_9000004866_34040cztM0_level2_quad_clean.evt |
| Size (bytes) | 591,255,360 | 70,113,600 |
| Size | 563.9 MB | 66.9 MB |
| Events in quadrant A | 3,158,889 | 449,013 |
| Events in quadrant B | 5,663,533 | 418,184 |
| Events in quadrant C | 4,041,416 | 433,647 |
| Events in quadrant D | 4,654,438 | 420,804 |
| Mode M9 | |||
|---|---|---|---|
| Quadrant | BADHDUFLAG | Total packets | Discarded packets |
| A | 0 | 29 | 0 |
| B | 0 | 29 | 0 |
| C | 0 | 29 | 0 |
| D | 0 | 29 | 0 |
| Mode M0 | |||
|---|---|---|---|
| Quadrant | BADHDUFLAG | Total packets | Discarded packets |
| A | 0 | 13162 | 3 |
| B | 0 | 20700 | 2 |
| C | 0 | 15754 | 2 |
| D | 0 | 17923 | 2 |
| Mode SS | |||
|---|---|---|---|
| Quadrant | BADHDUFLAG | Total packets | Discarded packets |
| A | 0 | 116 | 0 |
| B | 0 | 116 | 0 |
| C | 0 | 116 | 0 |
| D | 0 | 116 | 0 |
| Quadrant | Total seconds | Saturated seconds | Saturation percentage |
|---|---|---|---|
| A | 5738 | 91 | 1.585918% |
| B | 5738 | 932 | 16.242593% |
| C | 5738 | 153 | 2.666434% |
| D | 5738 | 350 | 6.099686% |
Noise dominated data is calculated using 1-second bins in cleaned event files. If a bin has >2000 counts, and if more than 50% of those come from <1% of pixels, then it is considered to be noise-dominated and hence unusable.
| Quadrant | # 1 sec bins | Bins with >0 counts | Bins with >2000 counts | High rate bins dominated by noise | Noise dominated (total time) | Noise dominated (detector-on time) | Marked lightcurve |
|---|---|---|---|---|---|---|---|
| A | 7291 | 5739 | 72 | 72 | 0.99% | 1.25% | 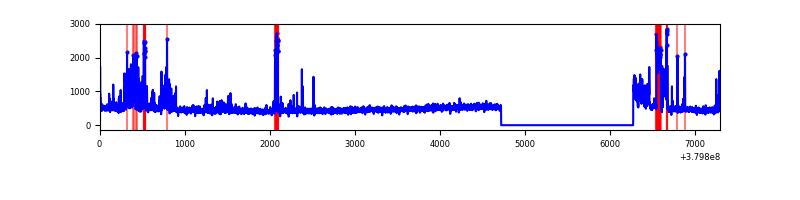 |
| B | 7291 | 5739 | 672 | 672 | 9.22% | 11.71% | 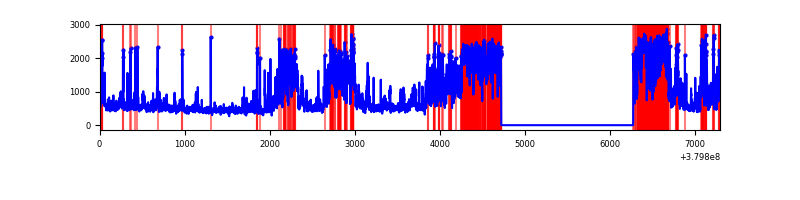 |
| C | 7291 | 5739 | 139 | 139 | 1.91% | 2.42% | 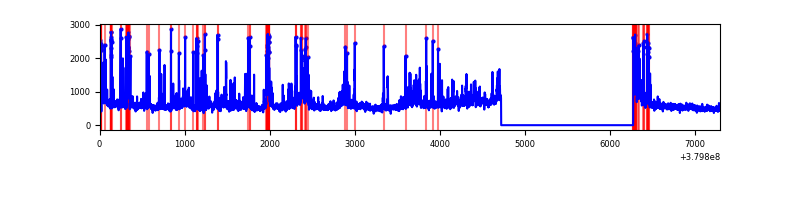 |
| D | 7291 | 5739 | 343 | 343 | 4.70% | 5.98% | 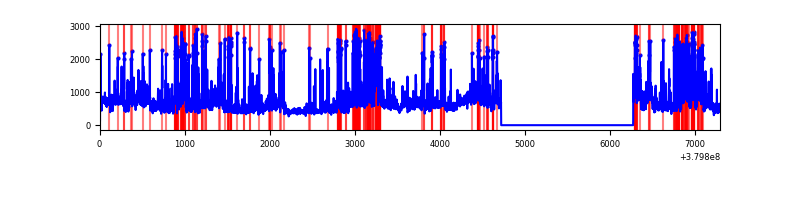 |
Top three noisy pixels from each quadrant. If the there are fewer than three noisy pixels in the level2.evt file, extra rows are filled as -1
| Pixel properties | Quadrant properties | ||||||
|---|---|---|---|---|---|---|---|
| Quadrant | DetID | PixID | Counts | Sigma | Mean | Median | Sigma |
| A | 15 | 169 | 563126 | 4242.94 | 662 | 649 | 132.6 |
| A | 10 | 83 | 19329 | 140.91 | 662 | 649 | 132.6 |
| A | 13 | 6 | 10845 | 76.91 | 662 | 649 | 132.6 |
| B | 5 | 31 | 1705985 | 14016.34 | 633 | 616 | 121.7 |
| B | 5 | 15 | 646768 | 5310.69 | 633 | 616 | 121.7 |
| B | 5 | 172 | 338219 | 2774.74 | 633 | 616 | 121.7 |
| C | 3 | 233 | 780504 | 5196.67 | 645 | 650 | 150.1 |
| C | 0 | 10 | 403228 | 2682.64 | 645 | 650 | 150.1 |
| C | 15 | 214 | 262898 | 1747.53 | 645 | 650 | 150.1 |
| D | 8 | 195 | 590079 | 3438.19 | 631 | 620 | 171.4 |
| D | 2 | 249 | 559723 | 3261.13 | 631 | 620 | 171.4 |
| D | 2 | 250 | 399296 | 2325.39 | 631 | 620 | 171.4 |
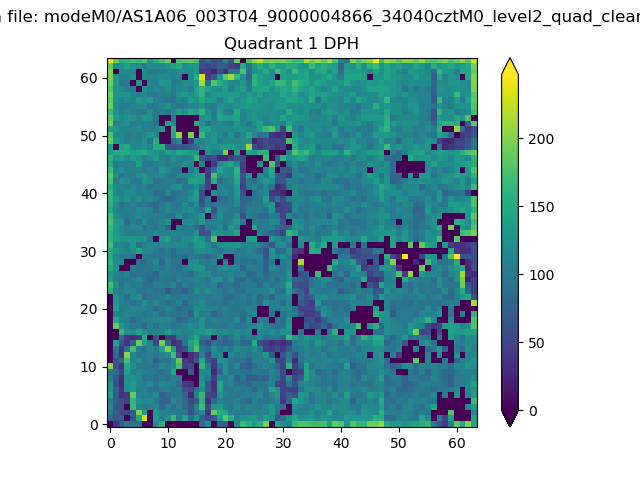
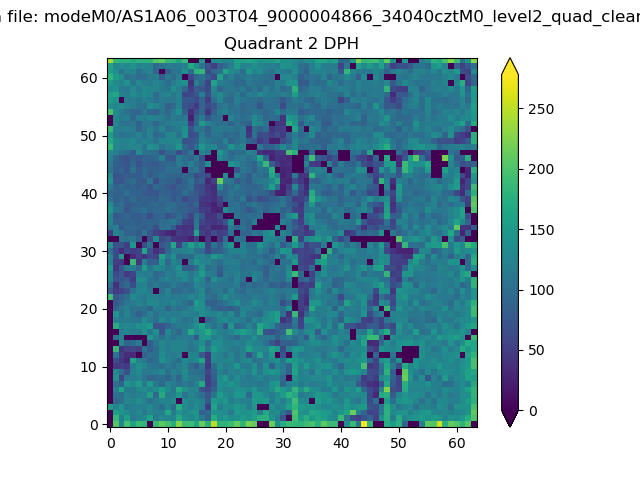
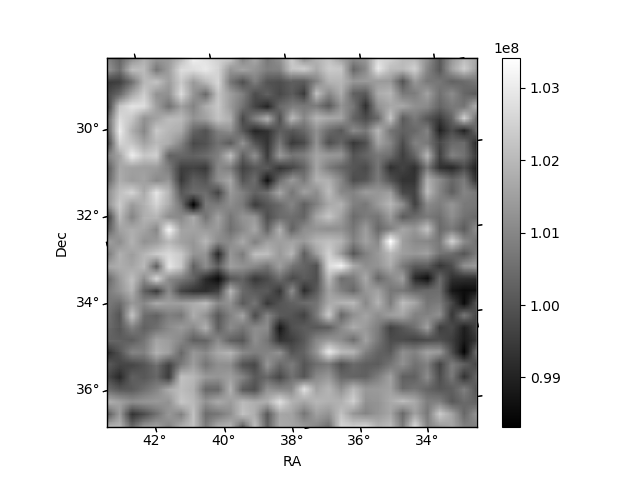
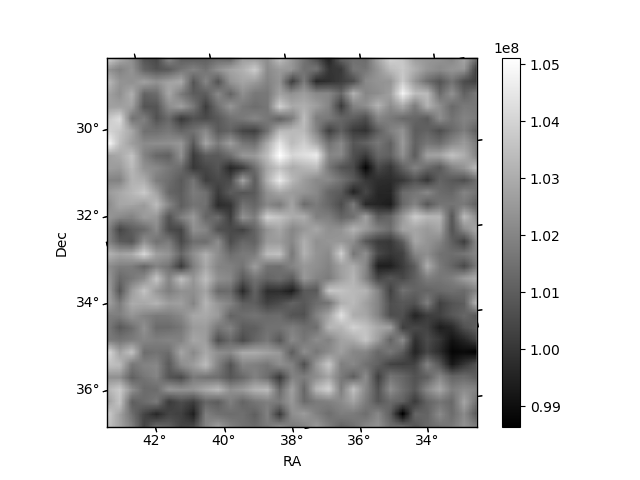
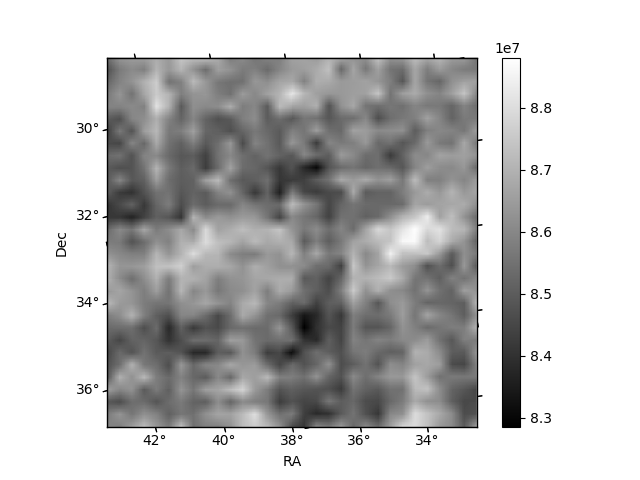
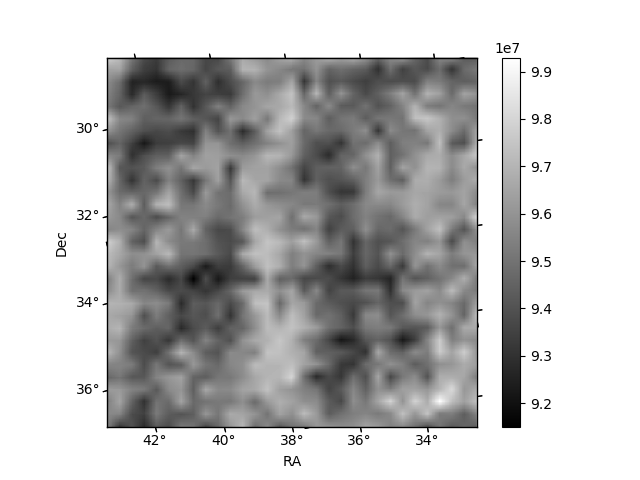
Histogram calculated using DETX and DETY for each event in the final _common_clean file
| Quadrant A |  |
 |
Quadrant B |
|---|---|---|---|
| Quadrant D | 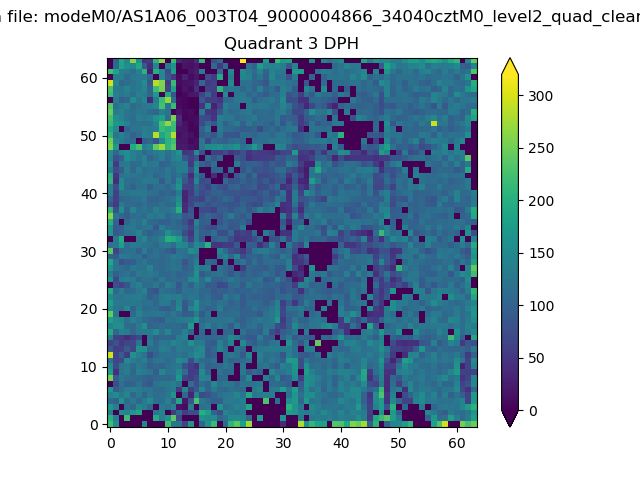 |
 |
Quadrant C |
| Plot type | Count rate plots | Images |
|---|---|---|
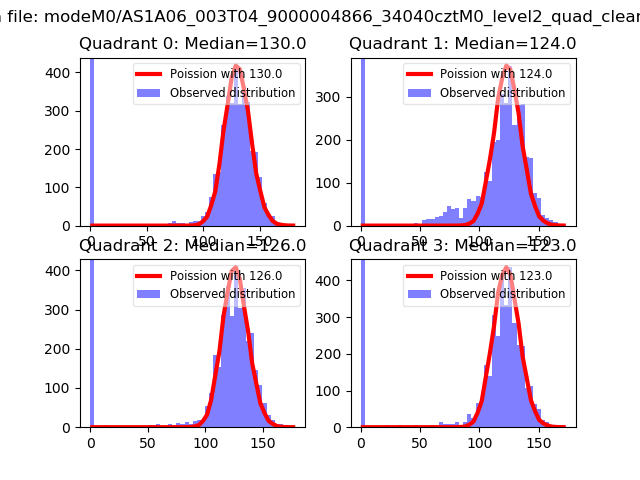
| Comparison with Poisson distribution Blue bars denote a histogram of data divided into 1 sec bins. Red curve is a Poisson curve with rate = median count rate of data. |
 |
 |
| Quadrant-wise count rates Data is divided into 100 sec bins |
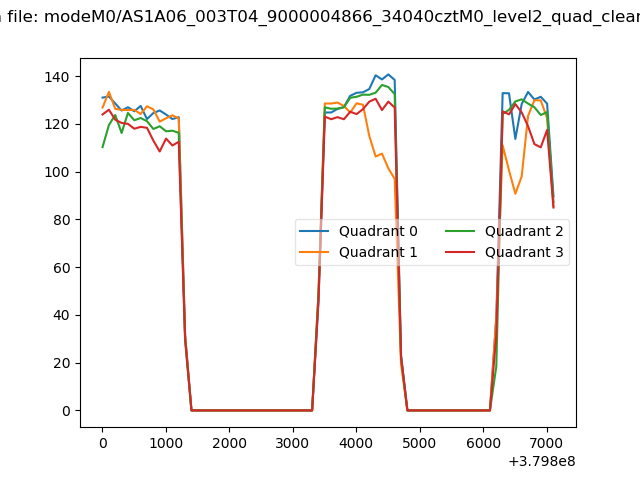 |
|
| Module-wise count rates for Quadrant A Data is divided into 100 sec bins |
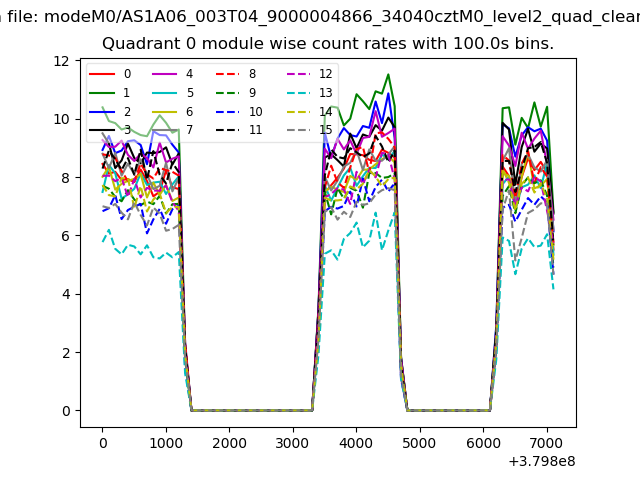 |
 |
| Module-wise count rates for Quadrant B Data is divided into 100 sec bins |
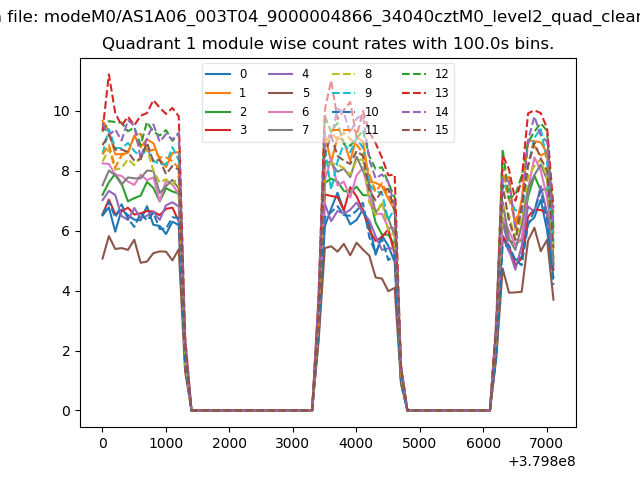 |
 |
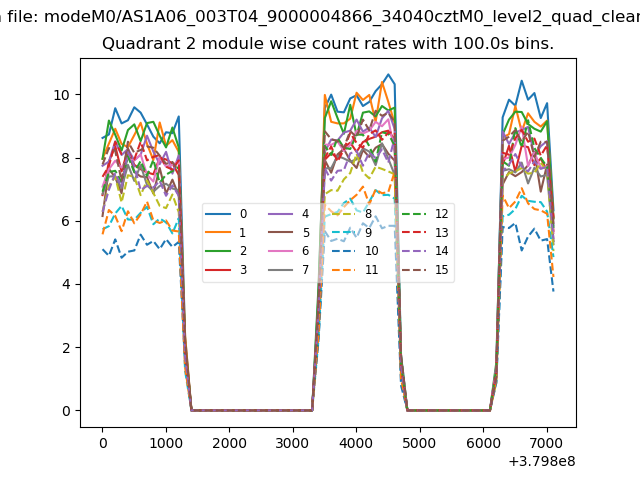
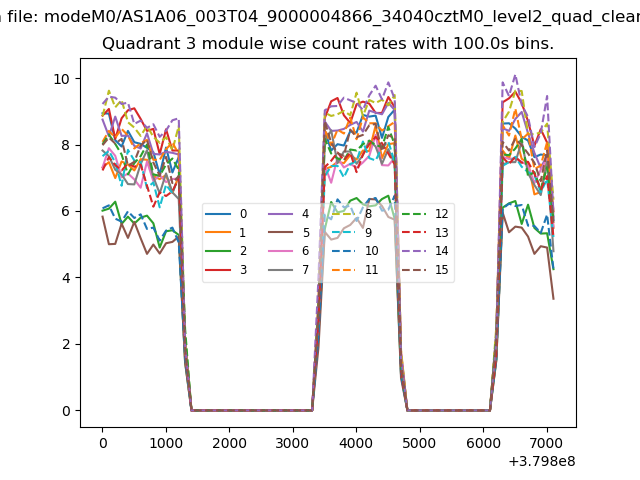
| Module-wise count rates for Quadrant C Data is divided into 100 sec bins |
 |
 |
| Module-wise count rates for Quadrant D Data is divided into 100 sec bins |
 |
 |
| Parameter | Plot |
|---|---|
| CZT HV Monitor | 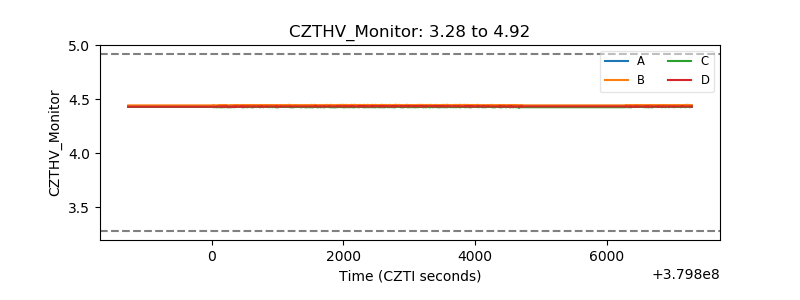 |
| D_VDD | 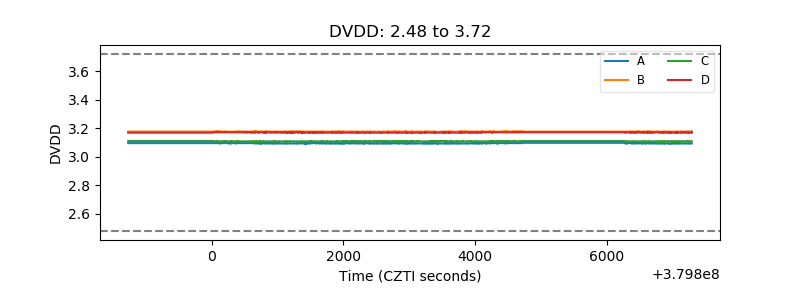 |
| Temperature 1 | 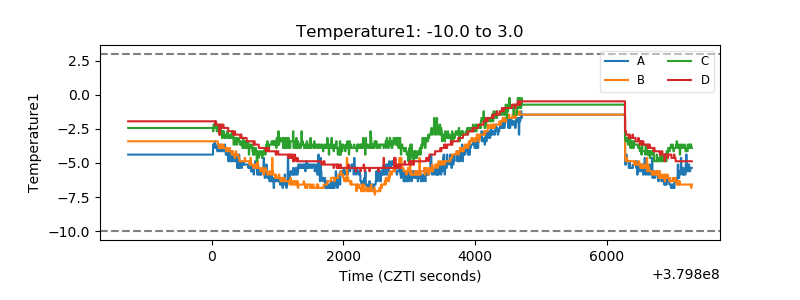 |
| Veto HV Monitor | 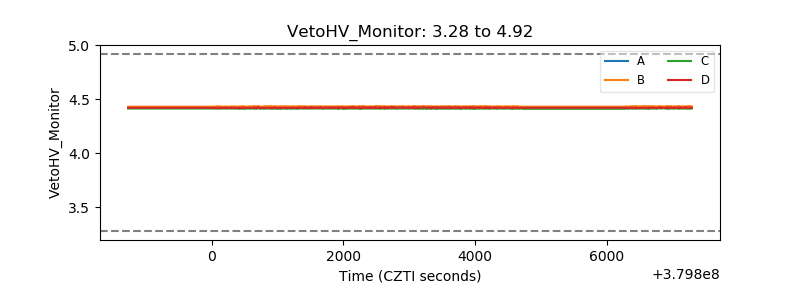 |
| Veto LLD | 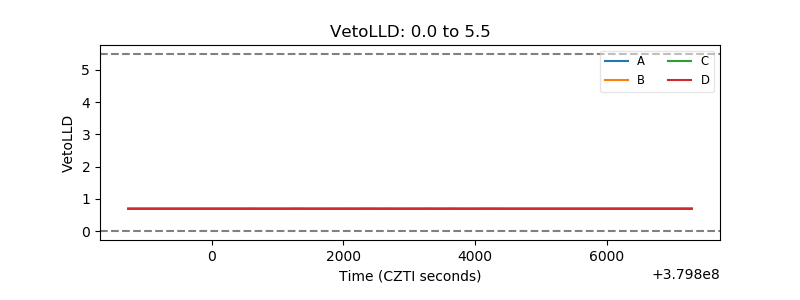 |
| Alpha Counter | 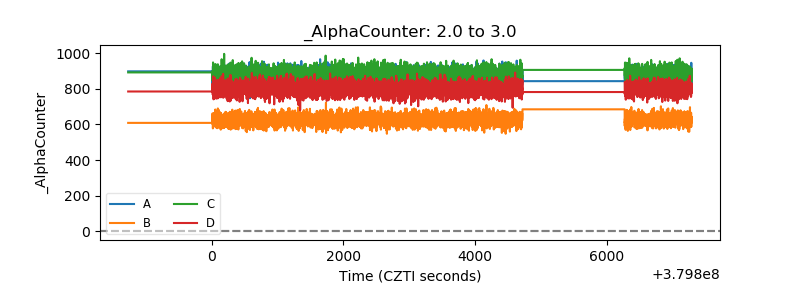 |
| _CPM_Rate | 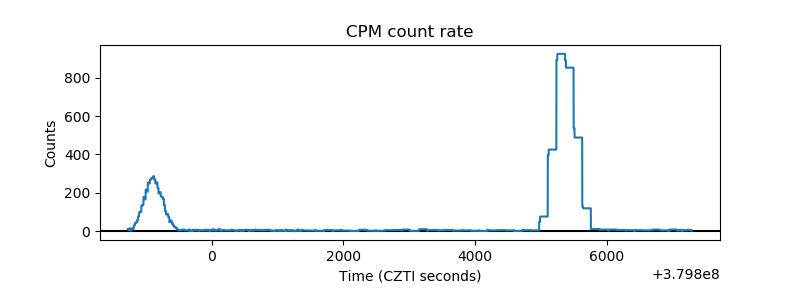 |
| CZT Counter | 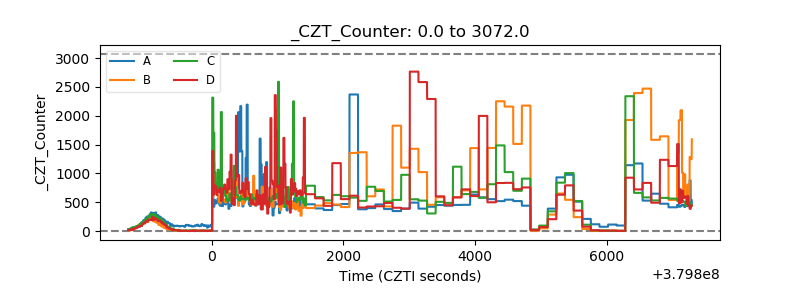 |
| +2.5 Volts monitor |  |
| +5 Volts monitor | 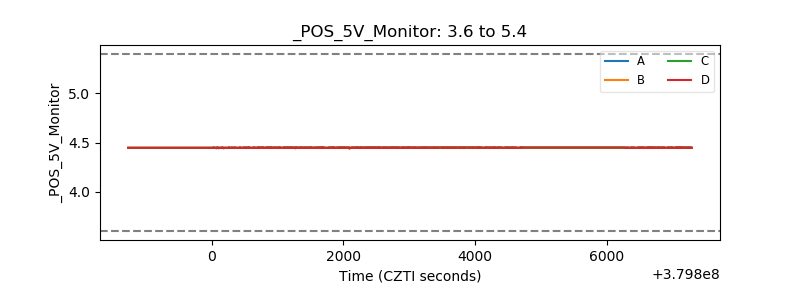 |
| _ROLL_ROT | 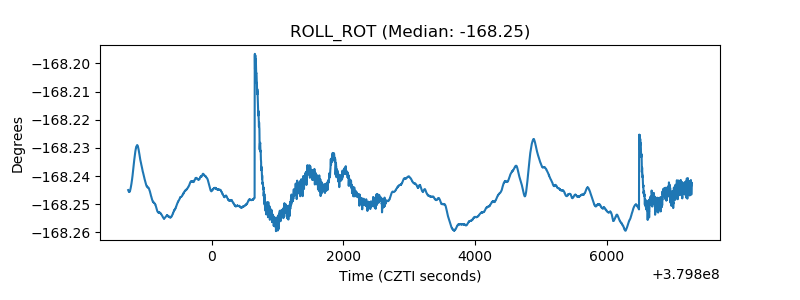 |
| _Roll_DEC | 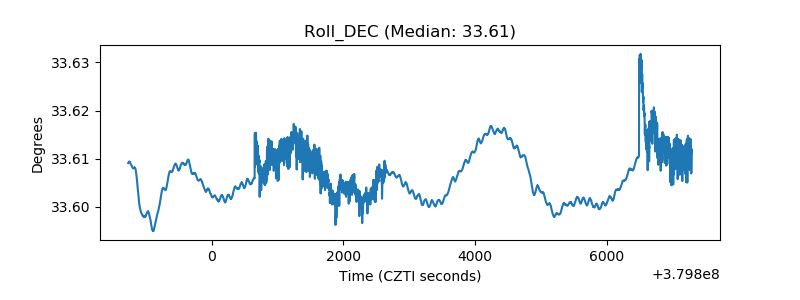 |
| _Roll_RA | 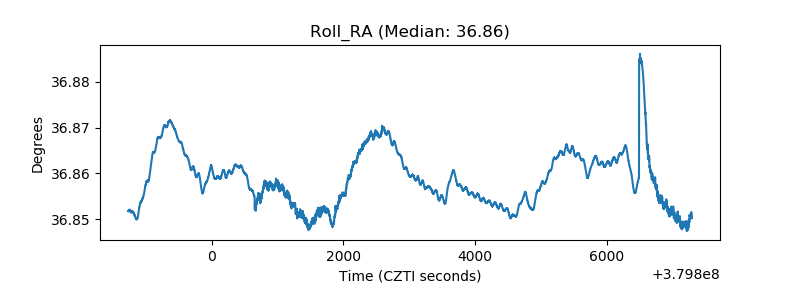 |
| Veto Counter | 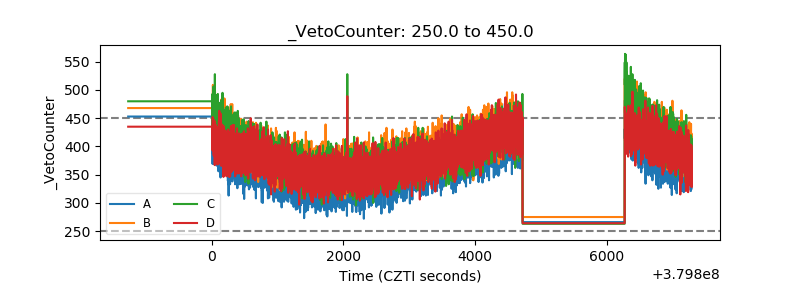 |