| Param | Original file | Final file |
|---|---|---|
| Filename | modeM0/AS1A06_003T04_9000004866_34043cztM0_level2.evt | modeM0/AS1A06_003T04_9000004866_34043cztM0_level2_quad_clean.evt |
| Size (bytes) | 556,511,040 | 53,959,680 |
| Size | 530.7 MB | 51.5 MB |
| Events in quadrant A | 2,788,368 | 325,951 |
| Events in quadrant B | 6,246,596 | 295,846 |
| Events in quadrant C | 3,290,007 | 320,690 |
| Events in quadrant D | 4,149,102 | 298,142 |
| Mode M9 | |||
|---|---|---|---|
| Quadrant | BADHDUFLAG | Total packets | Discarded packets |
| A | 0 | 35 | 0 |
| B | 0 | 35 | 0 |
| C | 0 | 35 | 0 |
| D | 0 | 35 | 0 |
| Mode M0 | |||
|---|---|---|---|
| Quadrant | BADHDUFLAG | Total packets | Discarded packets |
| A | 0 | 11833 | 3 |
| B | 0 | 22389 | 2 |
| C | 0 | 13020 | 2 |
| D | 0 | 16155 | 2 |
| Mode SS | |||
|---|---|---|---|
| Quadrant | BADHDUFLAG | Total packets | Discarded packets |
| A | 0 | 116 | 0 |
| B | 0 | 116 | 0 |
| C | 0 | 116 | 0 |
| D | 0 | 116 | 0 |
| Quadrant | Total seconds | Saturated seconds | Saturation percentage |
|---|---|---|---|
| A | 5611 | 33 | 0.588130% |
| B | 5611 | 1082 | 19.283550% |
| C | 5611 | 79 | 1.407949% |
| D | 5611 | 255 | 4.544644% |
Noise dominated data is calculated using 1-second bins in cleaned event files. If a bin has >2000 counts, and if more than 50% of those come from <1% of pixels, then it is considered to be noise-dominated and hence unusable.
| Quadrant | # 1 sec bins | Bins with >0 counts | Bins with >2000 counts | High rate bins dominated by noise | Noise dominated (total time) | Noise dominated (detector-on time) | Marked lightcurve |
|---|---|---|---|---|---|---|---|
| A | 9076 | 5613 | 23 | 23 | 0.25% | 0.41% | 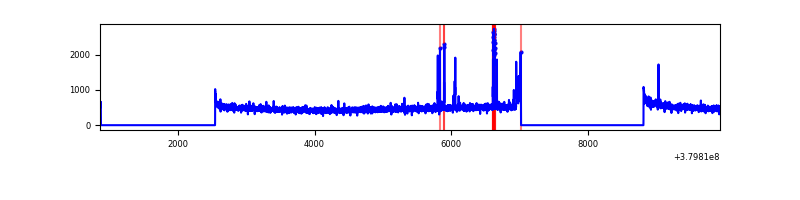 |
| B | 9076 | 5613 | 853 | 853 | 9.40% | 15.20% | 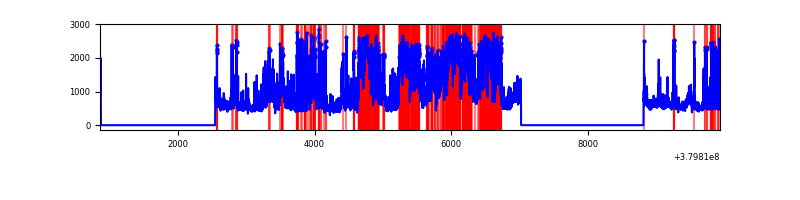 |
| C | 9076 | 5613 | 63 | 63 | 0.69% | 1.12% | 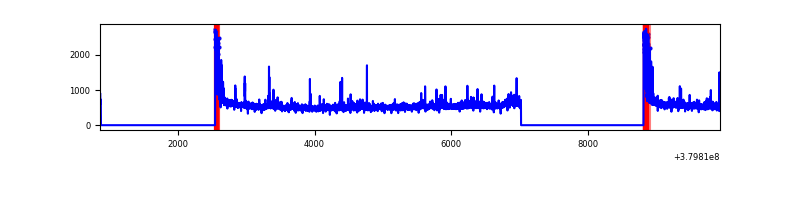 |
| D | 9076 | 5613 | 231 | 231 | 2.55% | 4.12% | 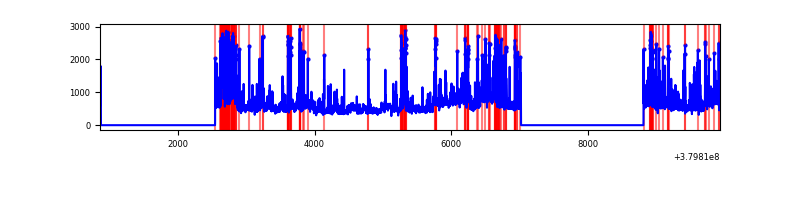 |
Top three noisy pixels from each quadrant. If the there are fewer than three noisy pixels in the level2.evt file, extra rows are filled as -1
| Pixel properties | Quadrant properties | ||||||
|---|---|---|---|---|---|---|---|
| Quadrant | DetID | PixID | Counts | Sigma | Mean | Median | Sigma |
| A | 15 | 169 | 131849 | 959.3 | 680 | 666 | 136.7 |
| A | 10 | 83 | 18736 | 132.14 | 680 | 666 | 136.7 |
| A | 13 | 254 | 9798 | 66.78 | 680 | 666 | 136.7 |
| B | 5 | 31 | 1859742 | 15055.32 | 651 | 636 | 123.5 |
| B | 5 | 15 | 845791 | 6844.19 | 651 | 636 | 123.5 |
| B | 5 | 172 | 563664 | 4559.48 | 651 | 636 | 123.5 |
| C | 15 | 214 | 258378 | 1669.07 | 660 | 666 | 154.4 |
| C | 0 | 10 | 241106 | 1557.21 | 660 | 666 | 154.4 |
| C | 3 | 233 | 174296 | 1124.51 | 660 | 666 | 154.4 |
| D | 8 | 195 | 519146 | 3250.67 | 649 | 631 | 159.5 |
| D | 2 | 249 | 438824 | 2747.12 | 649 | 631 | 159.5 |
| D | 13 | 249 | 220542 | 1378.66 | 649 | 631 | 159.5 |
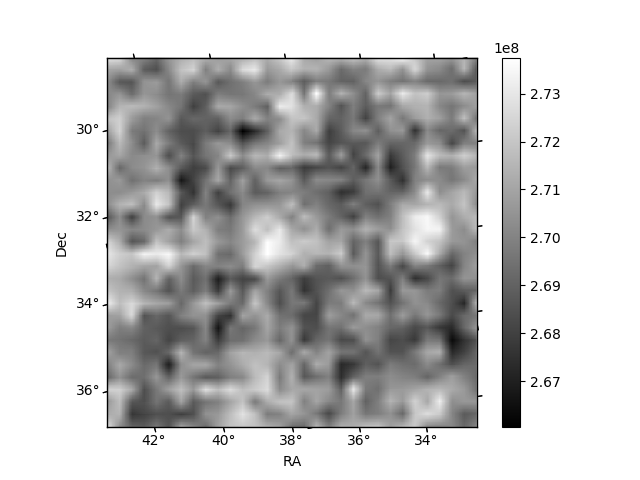
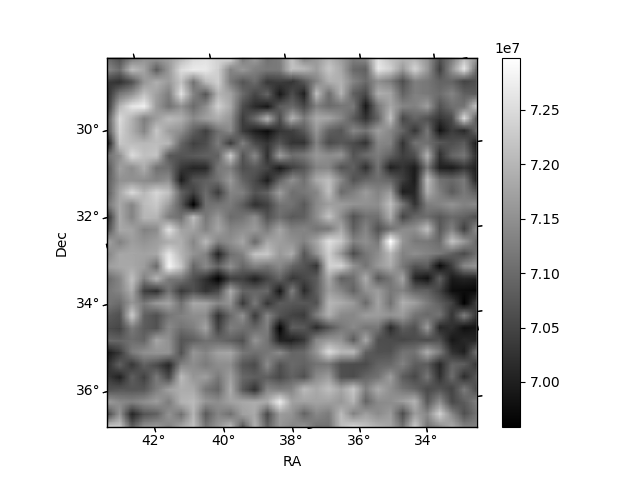
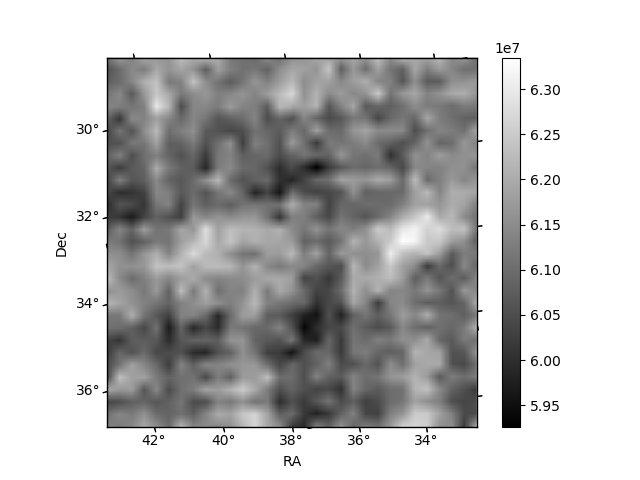
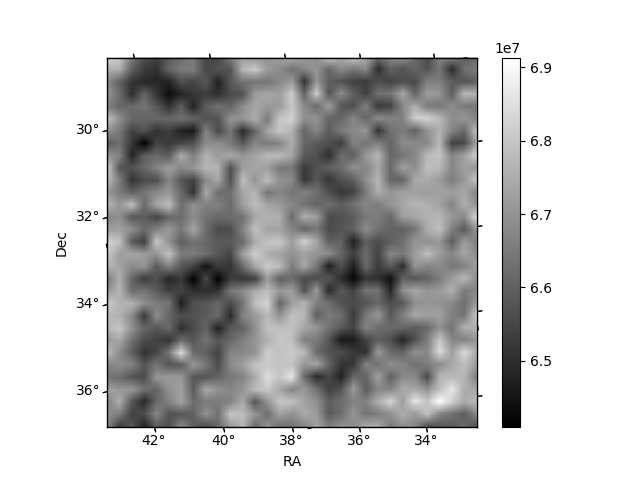
Histogram calculated using DETX and DETY for each event in the final _common_clean file
| Quadrant A | 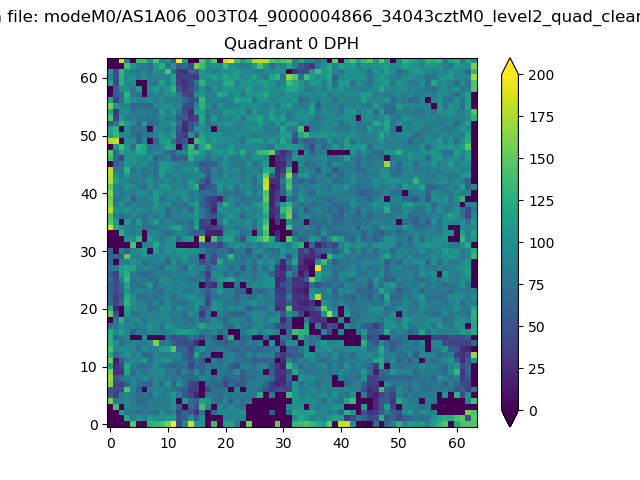 |
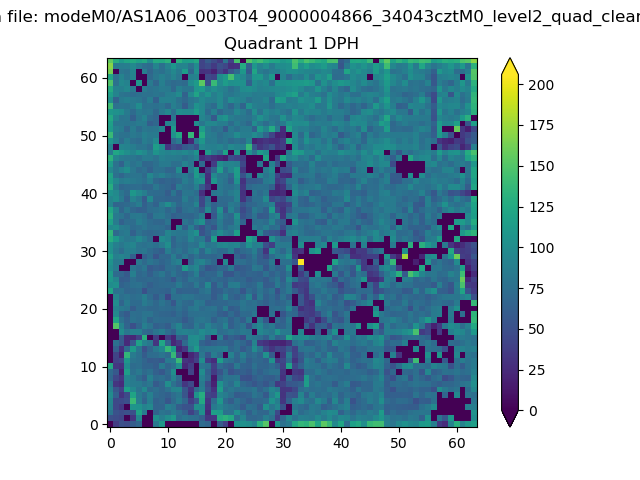 |
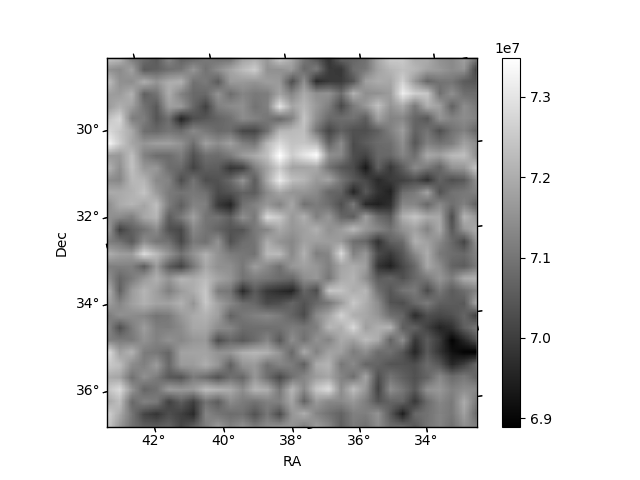
Quadrant B |
|---|---|---|---|
| Quadrant D | 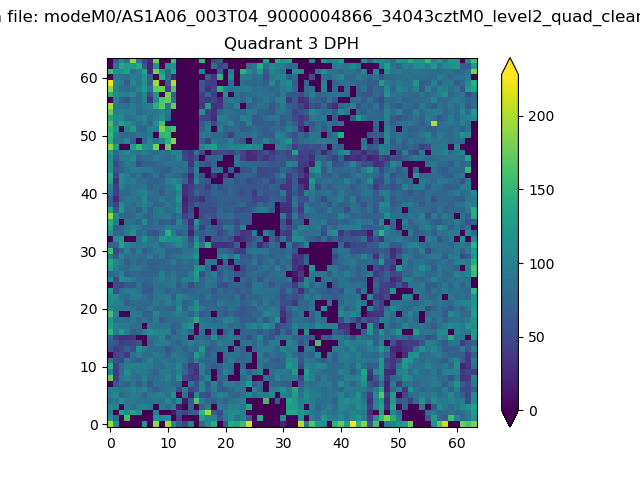 |
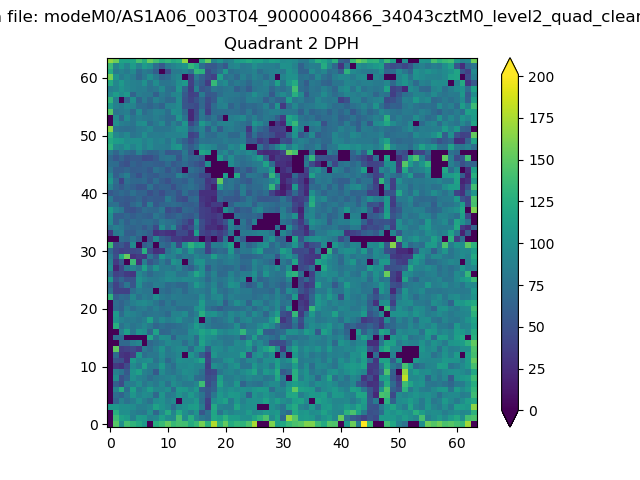 |
Quadrant C |
| Plot type | Count rate plots | Images |
|---|---|---|
| Comparison with Poisson distribution Blue bars denote a histogram of data divided into 1 sec bins. Red curve is a Poisson curve with rate = median count rate of data. |
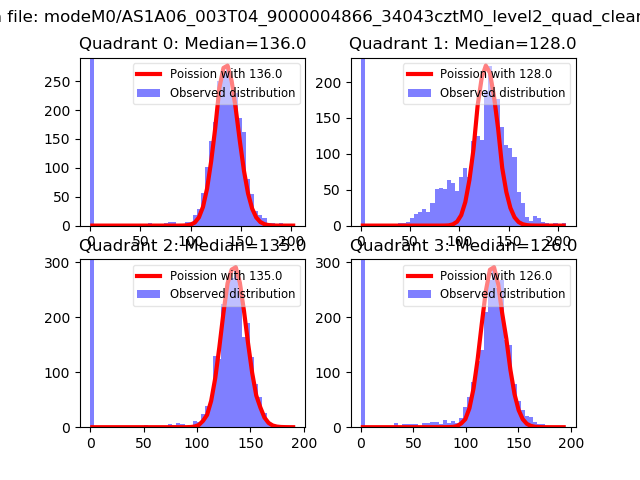 |
 |
| Quadrant-wise count rates Data is divided into 100 sec bins |
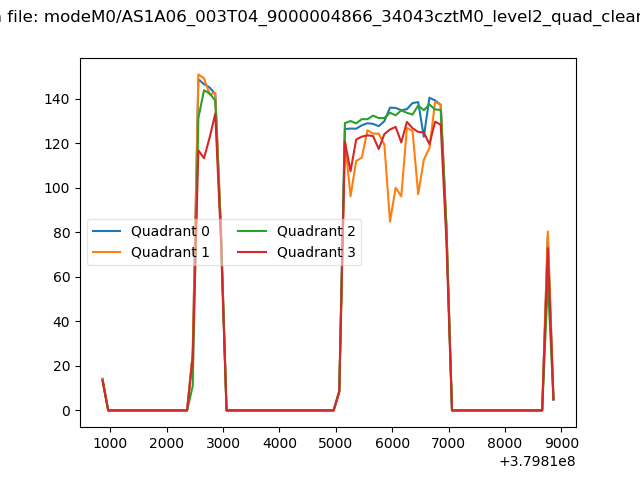 |
|
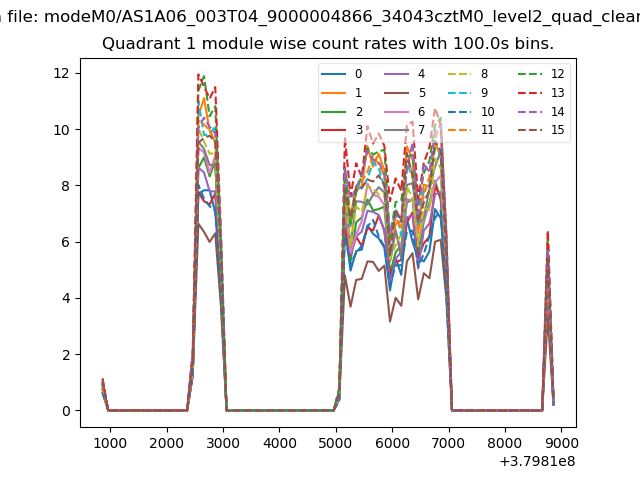
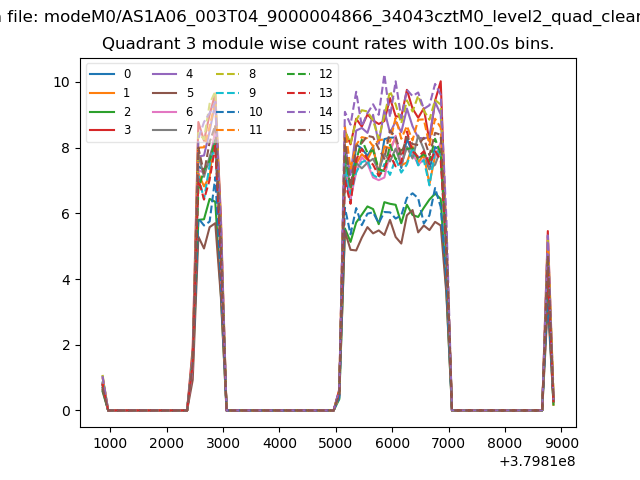
| Module-wise count rates for Quadrant A Data is divided into 100 sec bins |
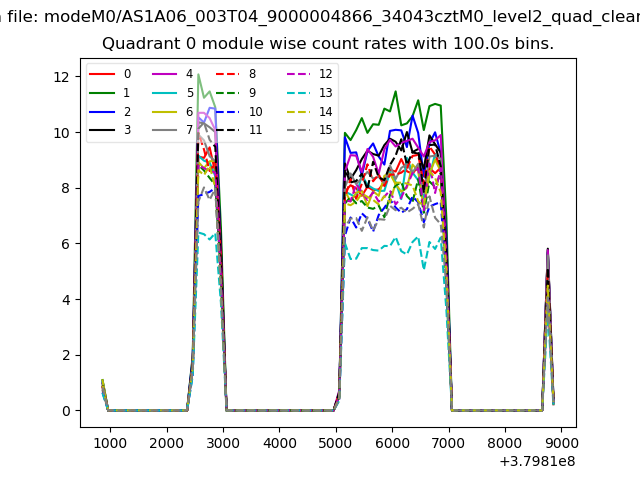 |
 |
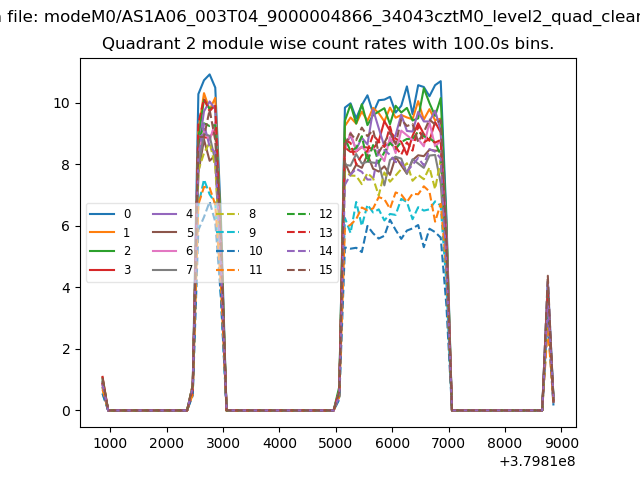
| Module-wise count rates for Quadrant B Data is divided into 100 sec bins |
 |
 |
| Module-wise count rates for Quadrant C Data is divided into 100 sec bins |
 |
 |
| Module-wise count rates for Quadrant D Data is divided into 100 sec bins |
 |
 |
| Parameter | Plot |
|---|---|
| CZT HV Monitor | 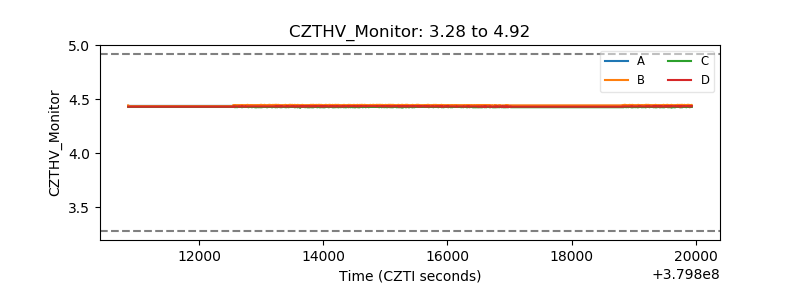 |
| D_VDD | 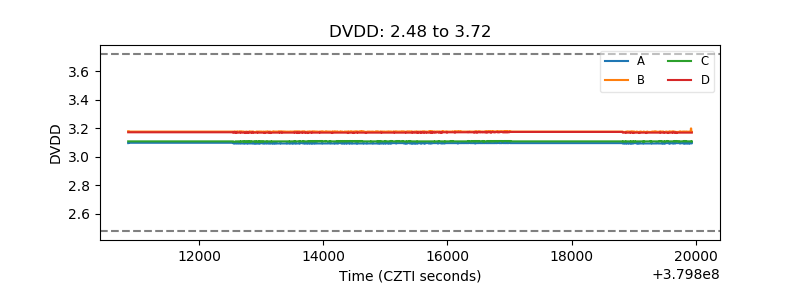 |
| Temperature 1 | 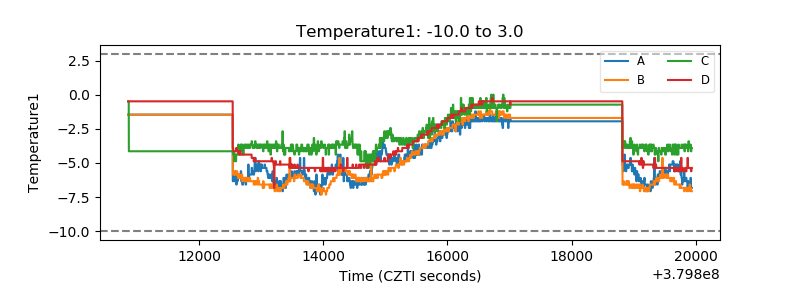 |
| Veto HV Monitor | 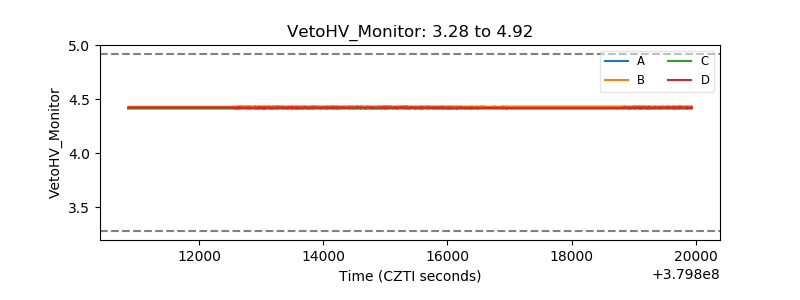 |
| Veto LLD | 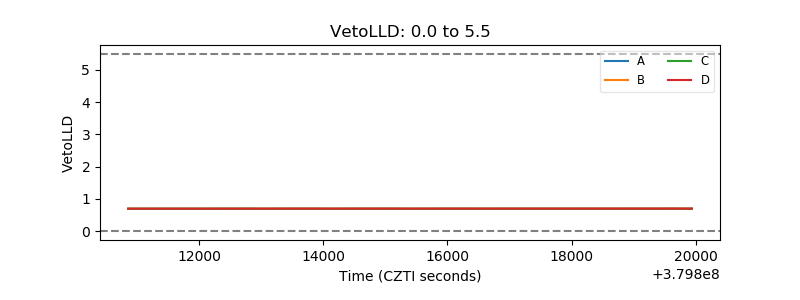 |
| Alpha Counter | 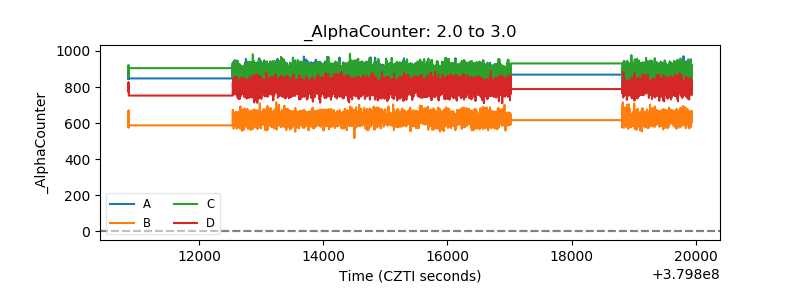 |
| _CPM_Rate | 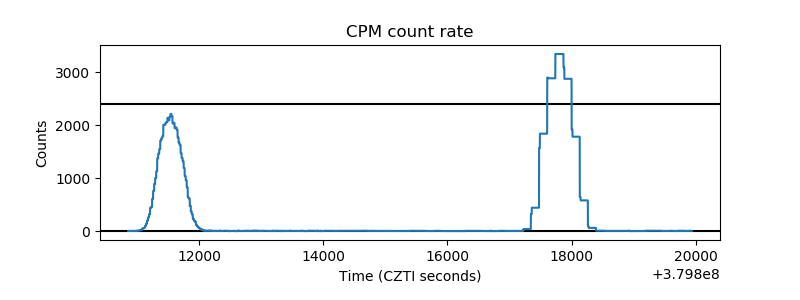 |
| CZT Counter | 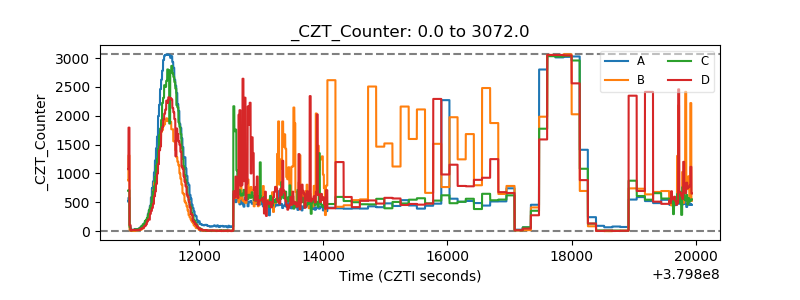 |
| +2.5 Volts monitor | 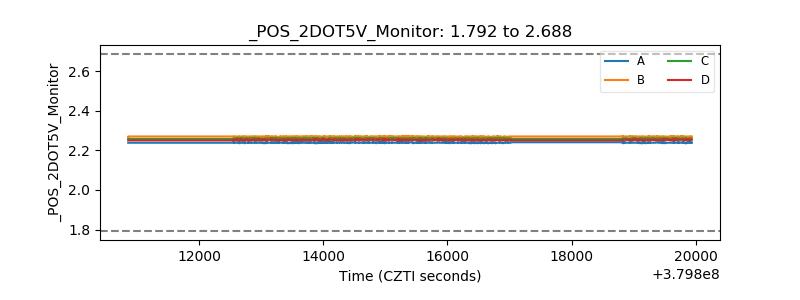 |
| +5 Volts monitor | 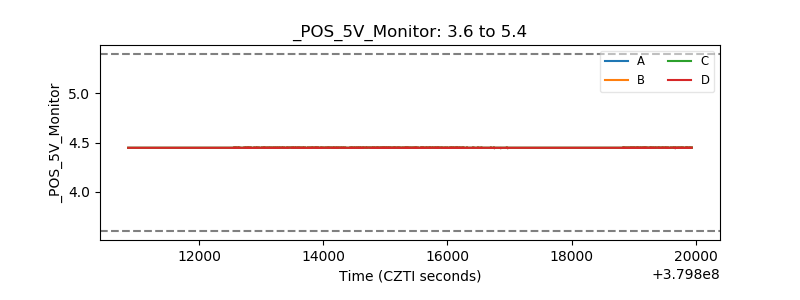 |
| _ROLL_ROT | 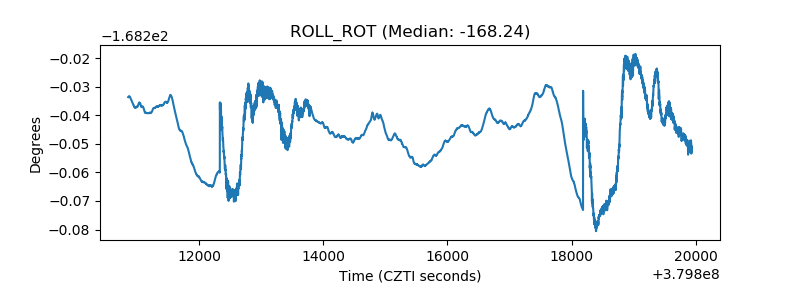 |
| _Roll_DEC | 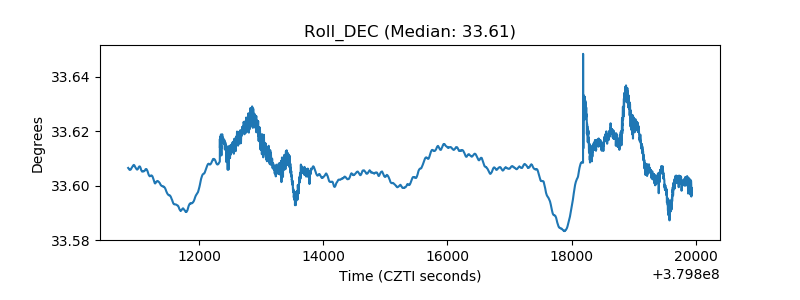 |
| _Roll_RA | 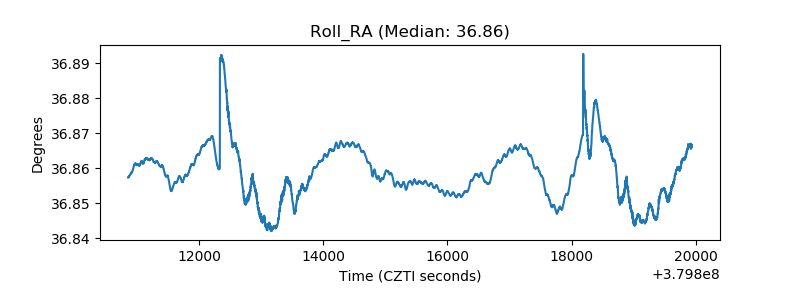 |
| Veto Counter | 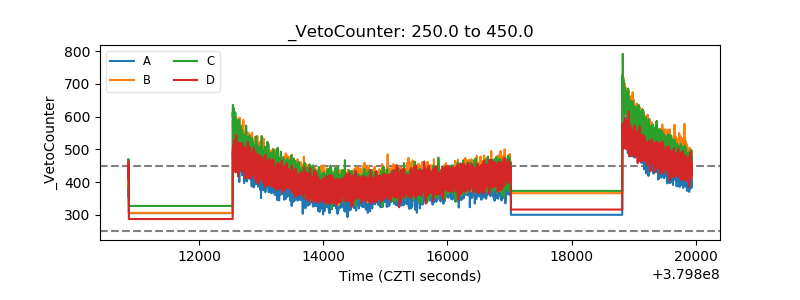 |