| Param | Original file | Final file |
|---|---|---|
| Filename | modeM0/AS1A06_003T04_9000004866_34044cztM0_level2.evt | modeM0/AS1A06_003T04_9000004866_34044cztM0_level2_quad_clean.evt |
| Size (bytes) | 614,462,400 | 49,605,120 |
| Size | 586.0 MB | 47.3 MB |
| Events in quadrant A | 3,691,017 | 287,792 |
| Events in quadrant B | 6,853,354 | 252,557 |
| Events in quadrant C | 3,455,277 | 298,833 |
| Events in quadrant D | 4,242,614 | 282,279 |
| Mode M9 | |||
|---|---|---|---|
| Quadrant | BADHDUFLAG | Total packets | Discarded packets |
| A | 0 | 29 | 0 |
| B | 0 | 29 | 0 |
| C | 0 | 29 | 0 |
| D | 0 | 30 | 0 |
| Mode M0 | |||
|---|---|---|---|
| Quadrant | BADHDUFLAG | Total packets | Discarded packets |
| A | 0 | 14435 | 3 |
| B | 0 | 23969 | 2 |
| C | 0 | 13555 | 2 |
| D | 0 | 16318 | 2 |
| Mode SS | |||
|---|---|---|---|
| Quadrant | BADHDUFLAG | Total packets | Discarded packets |
| A | 0 | 112 | 0 |
| B | 0 | 112 | 0 |
| C | 0 | 112 | 0 |
| D | 0 | 112 | 0 |
| Quadrant | Total seconds | Saturated seconds | Saturation percentage |
|---|---|---|---|
| A | 5417 | 358 | 6.608824% |
| B | 5417 | 1733 | 31.991877% |
| C | 5417 | 69 | 1.273768% |
| D | 5417 | 205 | 3.784382% |
Noise dominated data is calculated using 1-second bins in cleaned event files. If a bin has >2000 counts, and if more than 50% of those come from <1% of pixels, then it is considered to be noise-dominated and hence unusable.
| Quadrant | # 1 sec bins | Bins with >0 counts | Bins with >2000 counts | High rate bins dominated by noise | Noise dominated (total time) | Noise dominated (detector-on time) | Marked lightcurve |
|---|---|---|---|---|---|---|---|
| A | 7359 | 5418 | 258 | 258 | 3.51% | 4.76% | 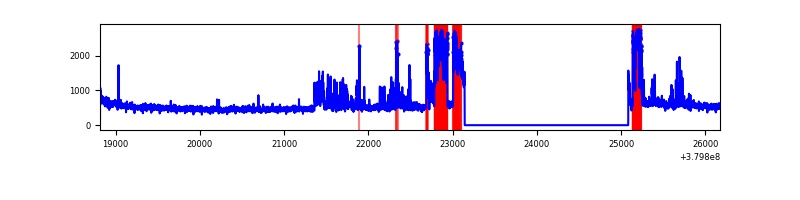 |
| B | 7359 | 5417 | 1546 | 1546 | 21.01% | 28.54% | 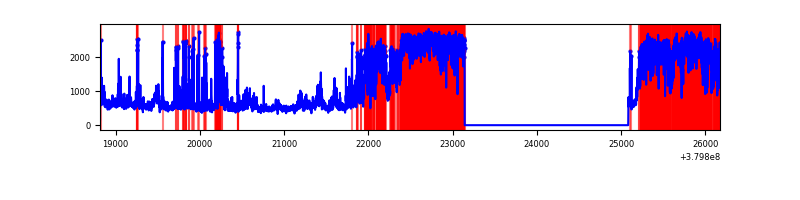 |
| C | 7359 | 5418 | 60 | 60 | 0.82% | 1.11% | 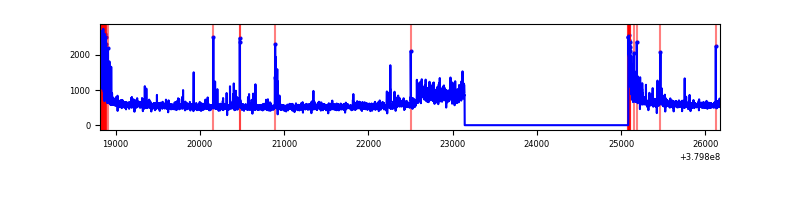 |
| D | 7359 | 5418 | 182 | 182 | 2.47% | 3.36% | 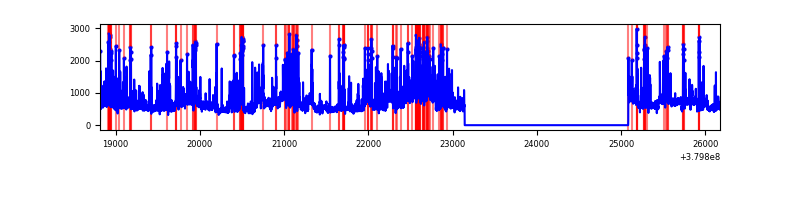 |
Top three noisy pixels from each quadrant. If the there are fewer than three noisy pixels in the level2.evt file, extra rows are filled as -1
| Pixel properties | Quadrant properties | ||||||
|---|---|---|---|---|---|---|---|
| Quadrant | DetID | PixID | Counts | Sigma | Mean | Median | Sigma |
| A | 15 | 169 | 1071089 | 7957.77 | 672 | 660 | 134.5 |
| A | 10 | 83 | 17585 | 125.82 | 672 | 660 | 134.5 |
| A | 13 | 254 | 9371 | 64.76 | 672 | 660 | 134.5 |
| B | 5 | 31 | 2234630 | 19078.05 | 623 | 607 | 117.1 |
| B | 5 | 15 | 1206787 | 10300.51 | 623 | 607 | 117.1 |
| B | 5 | 172 | 392267 | 3344.69 | 623 | 607 | 117.1 |
| C | 3 | 233 | 280020 | 1832.44 | 666 | 673 | 152.4 |
| C | 0 | 10 | 268363 | 1755.97 | 666 | 673 | 152.4 |
| C | 15 | 214 | 255031 | 1668.52 | 666 | 673 | 152.4 |
| D | 2 | 249 | 570982 | 3535.67 | 656 | 638 | 161.3 |
| D | 8 | 195 | 568597 | 3520.89 | 656 | 638 | 161.3 |
| D | 13 | 249 | 253642 | 1568.42 | 656 | 638 | 161.3 |
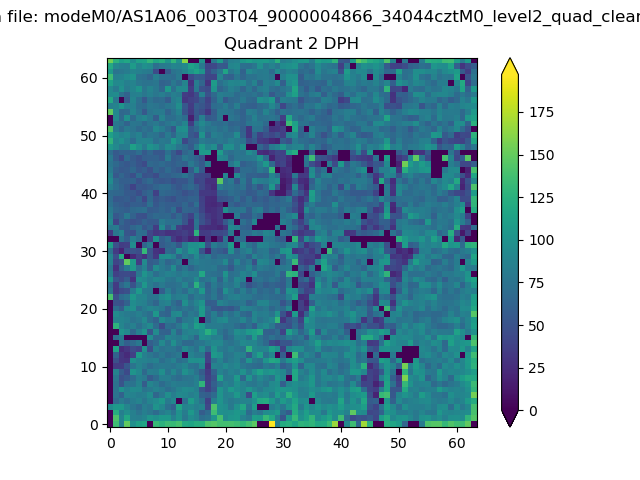
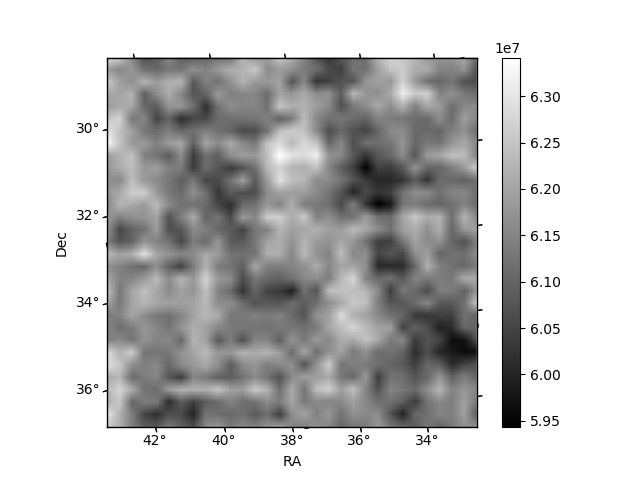
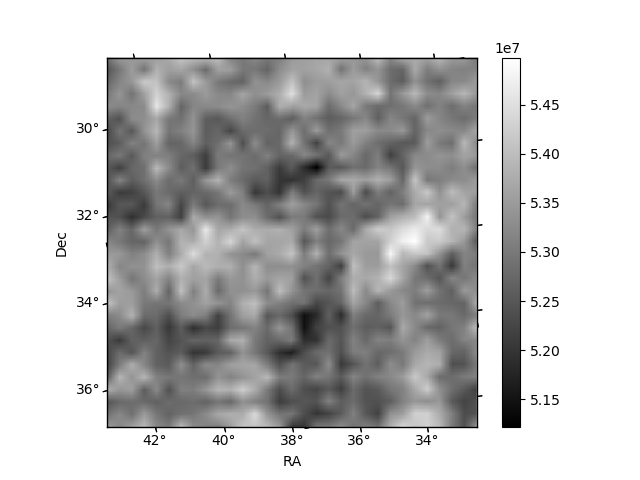
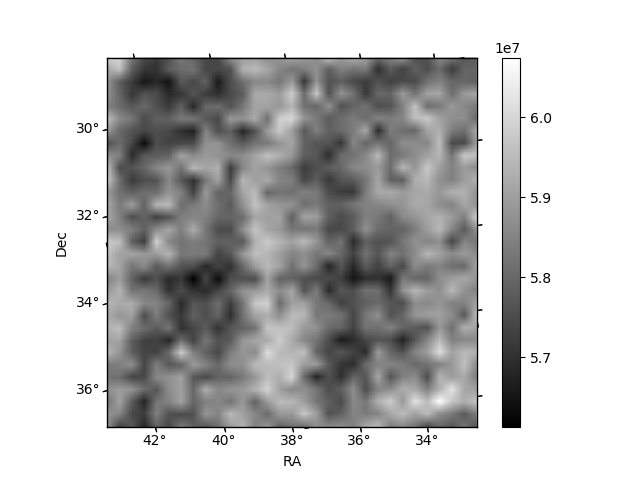
Histogram calculated using DETX and DETY for each event in the final _common_clean file
| Quadrant A | 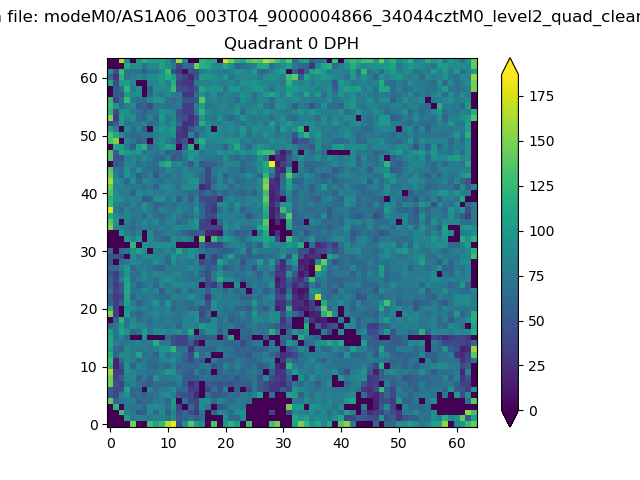 |
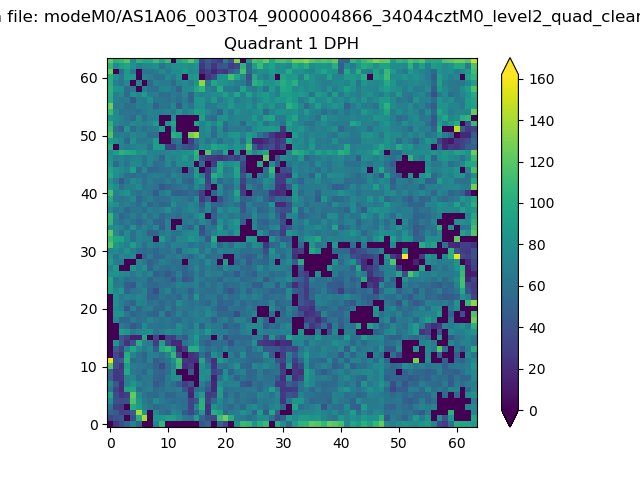 |
Quadrant B |
|---|---|---|---|
| Quadrant D | 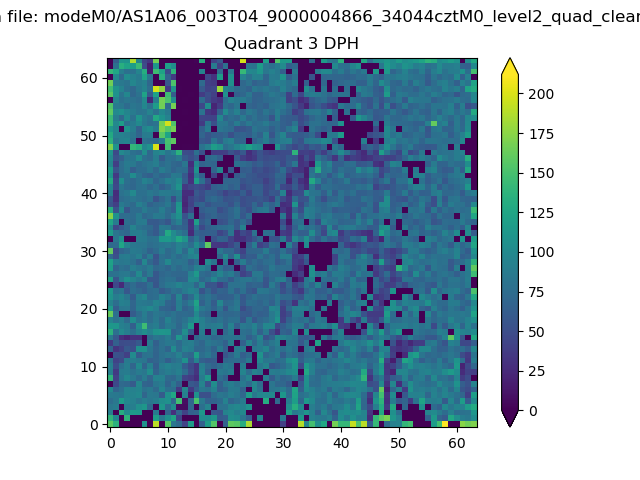 |
 |
Quadrant C |
| Plot type | Count rate plots | Images |
|---|---|---|
| Comparison with Poisson distribution Blue bars denote a histogram of data divided into 1 sec bins. Red curve is a Poisson curve with rate = median count rate of data. |
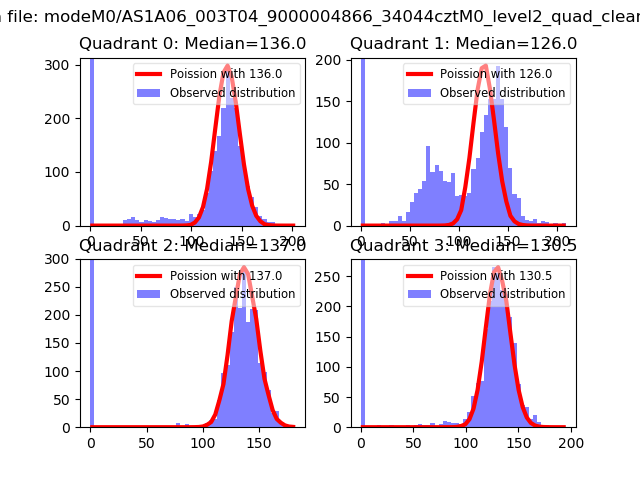 |
 |
| Quadrant-wise count rates Data is divided into 100 sec bins |
 |
|
| Module-wise count rates for Quadrant A Data is divided into 100 sec bins |
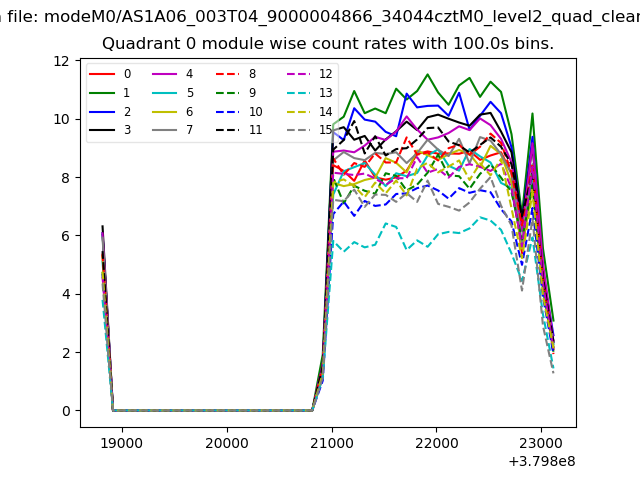 |
 |
| Module-wise count rates for Quadrant B Data is divided into 100 sec bins |
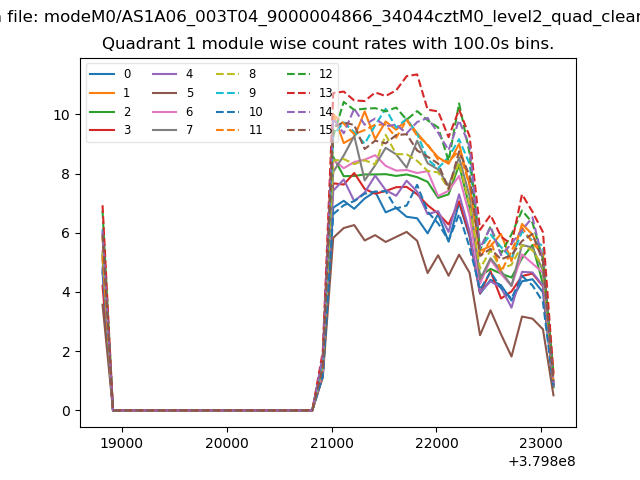 |
 |
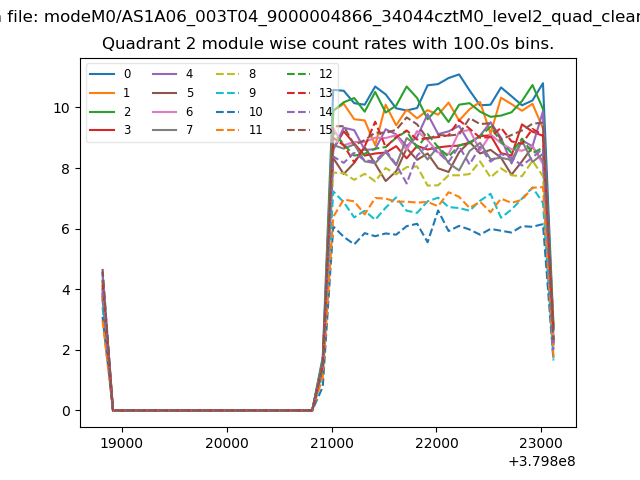
| Module-wise count rates for Quadrant C Data is divided into 100 sec bins |
 |
 |
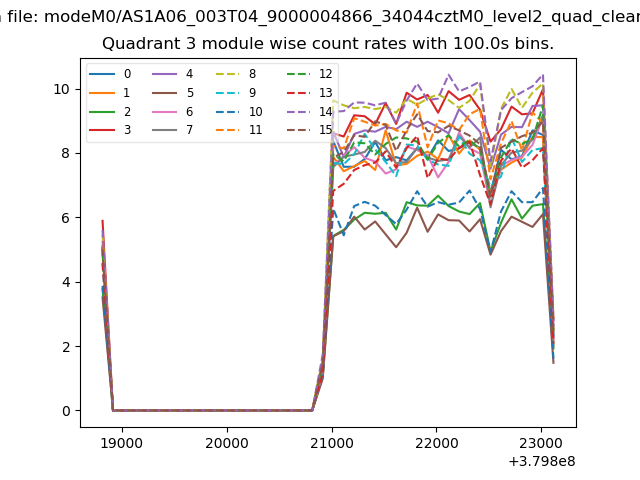
| Module-wise count rates for Quadrant D Data is divided into 100 sec bins |
 |
 |
| Parameter | Plot |
|---|---|
| CZT HV Monitor | 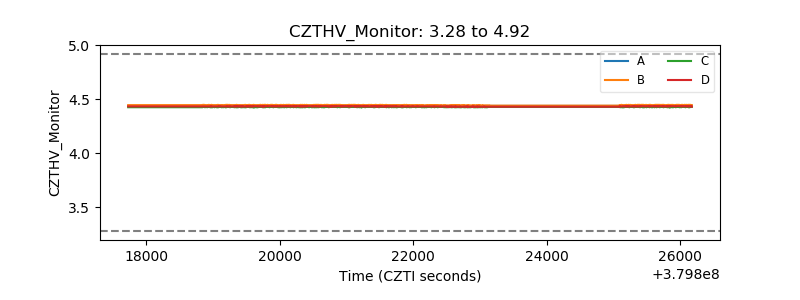 |
| D_VDD | 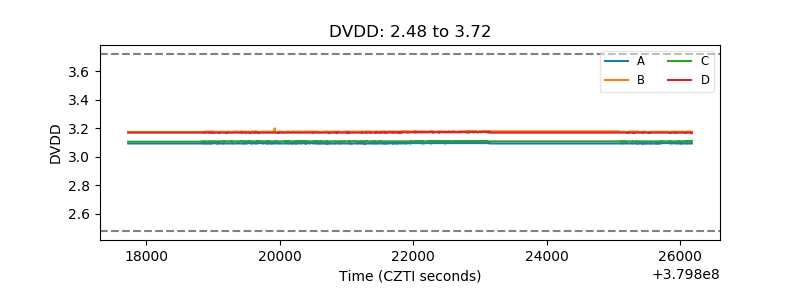 |
| Temperature 1 | 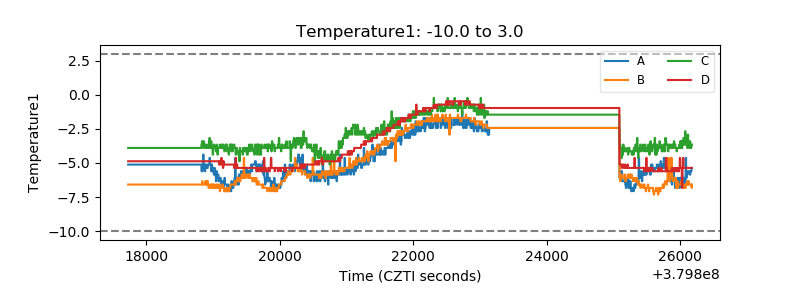 |
| Veto HV Monitor | 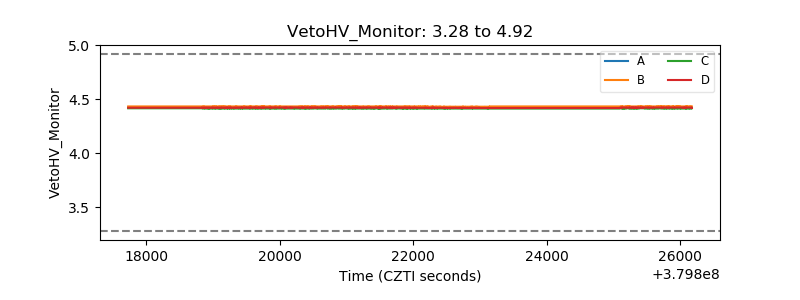 |
| Veto LLD | 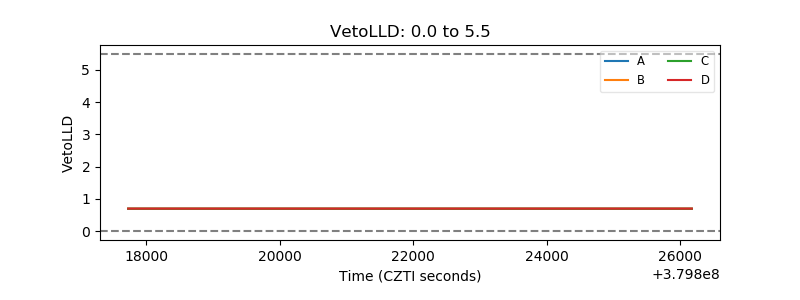 |
| Alpha Counter | 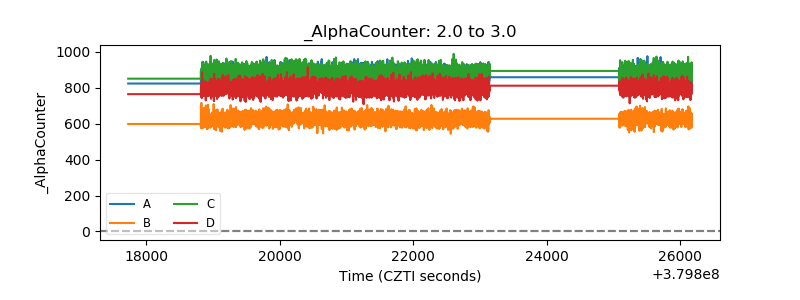 |
| _CPM_Rate | 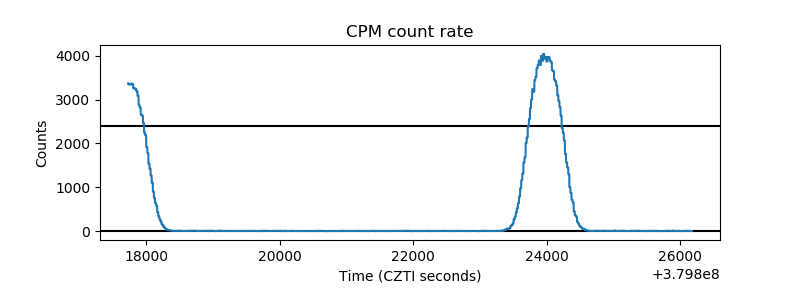 |
| CZT Counter |  |
| +2.5 Volts monitor |  |
| +5 Volts monitor |  |
| _ROLL_ROT | 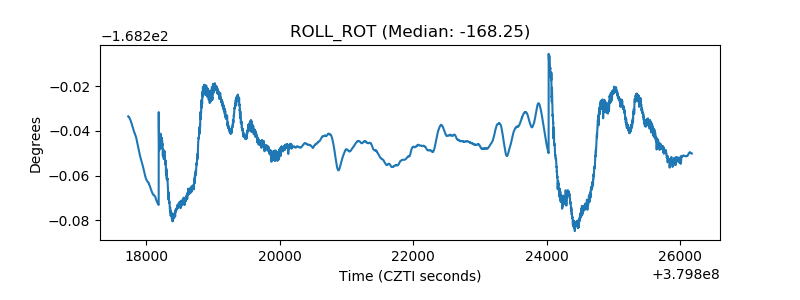 |
| _Roll_DEC | 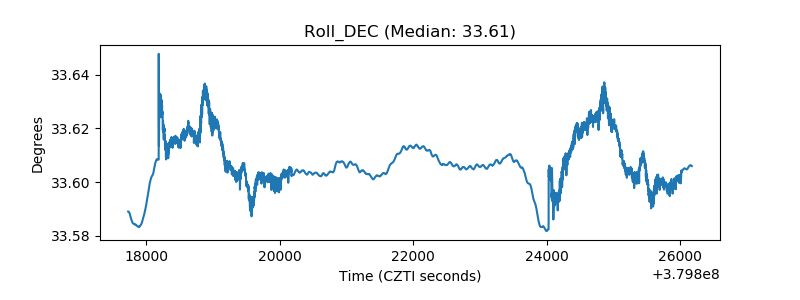 |
| _Roll_RA |  |
| Veto Counter | 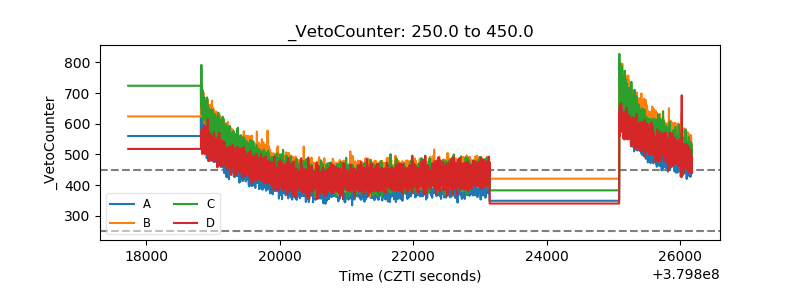 |