| Param | Original file | Final file |
|---|---|---|
| Filename | modeM0/AS1A06_003T04_9000004866_34045cztM0_level2.evt | modeM0/AS1A06_003T04_9000004866_34045cztM0_level2_quad_clean.evt |
| Size (bytes) | 663,552,000 | 56,304,000 |
| Size | 632.8 MB | 53.7 MB |
| Events in quadrant A | 3,173,265 | 362,740 |
| Events in quadrant B | 8,903,129 | 298,325 |
| Events in quadrant C | 3,240,119 | 354,344 |
| Events in quadrant D | 4,427,509 | 323,763 |
| Mode M9 | |||
|---|---|---|---|
| Quadrant | BADHDUFLAG | Total packets | Discarded packets |
| A | 0 | 30 | 0 |
| B | 0 | 30 | 0 |
| C | 0 | 30 | 0 |
| D | 0 | 31 | 0 |
| Mode M0 | |||
|---|---|---|---|
| Quadrant | BADHDUFLAG | Total packets | Discarded packets |
| A | 0 | 12536 | 3 |
| B | 0 | 30106 | 2 |
| C | 0 | 12938 | 2 |
| D | 0 | 16847 | 2 |
| Mode SS | |||
|---|---|---|---|
| Quadrant | BADHDUFLAG | Total packets | Discarded packets |
| A | 0 | 106 | 0 |
| B | 0 | 106 | 0 |
| C | 0 | 106 | 0 |
| D | 0 | 106 | 0 |
| Quadrant | Total seconds | Saturated seconds | Saturation percentage |
|---|---|---|---|
| A | 5207 | 98 | 1.882082% |
| B | 5207 | 2474 | 47.512963% |
| C | 5207 | 60 | 1.152295% |
| D | 5207 | 327 | 6.280008% |
Noise dominated data is calculated using 1-second bins in cleaned event files. If a bin has >2000 counts, and if more than 50% of those come from <1% of pixels, then it is considered to be noise-dominated and hence unusable.
| Quadrant | # 1 sec bins | Bins with >0 counts | Bins with >2000 counts | High rate bins dominated by noise | Noise dominated (total time) | Noise dominated (detector-on time) | Marked lightcurve |
|---|---|---|---|---|---|---|---|
| A | 7241 | 5208 | 87 | 87 | 1.20% | 1.67% | 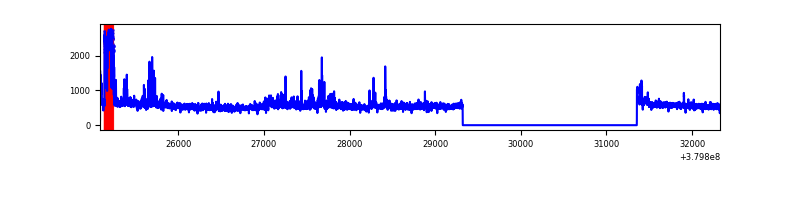 |
| B | 7241 | 5207 | 2192 | 2192 | 30.27% | 42.10% | 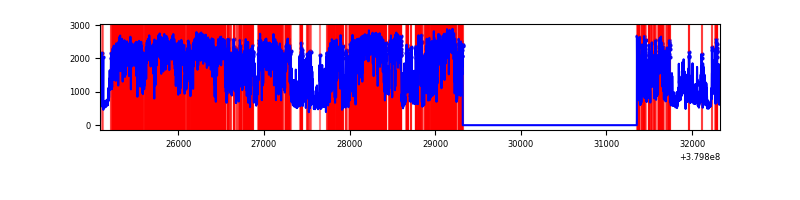 |
| C | 7241 | 5208 | 48 | 48 | 0.66% | 0.92% | 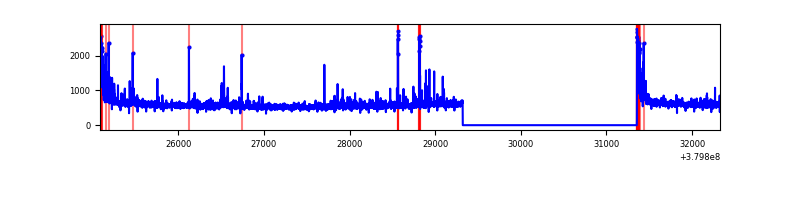 |
| D | 7241 | 5208 | 323 | 323 | 4.46% | 6.20% | 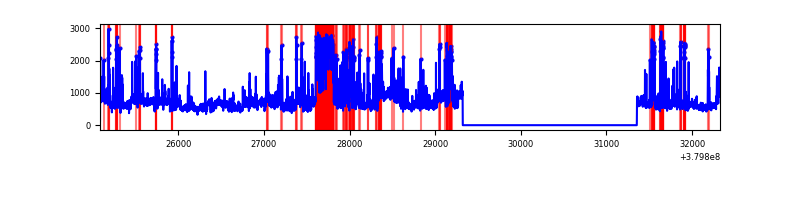 |
Top three noisy pixels from each quadrant. If the there are fewer than three noisy pixels in the level2.evt file, extra rows are filled as -1
| Pixel properties | Quadrant properties | ||||||
|---|---|---|---|---|---|---|---|
| Quadrant | DetID | PixID | Counts | Sigma | Mean | Median | Sigma |
| A | 15 | 169 | 484579 | 3549.72 | 690 | 680 | 136.3 |
| A | 10 | 83 | 17590 | 124.05 | 690 | 680 | 136.3 |
| A | 13 | 6 | 10557 | 72.45 | 690 | 680 | 136.3 |
| B | 5 | 31 | 3910614 | 34975.17 | 604 | 592 | 111.8 |
| B | 5 | 15 | 1650155 | 14755.35 | 604 | 592 | 111.8 |
| B | 5 | 172 | 487320 | 4353.78 | 604 | 592 | 111.8 |
| C | 15 | 214 | 246240 | 1623.34 | 663 | 670 | 151.3 |
| C | 0 | 10 | 242837 | 1600.85 | 663 | 670 | 151.3 |
| C | 3 | 233 | 83854 | 549.89 | 663 | 670 | 151.3 |
| D | 8 | 195 | 599900 | 3829.75 | 647 | 631 | 156.5 |
| D | 2 | 250 | 536638 | 3425.46 | 647 | 631 | 156.5 |
| D | 2 | 249 | 303794 | 1937.42 | 647 | 631 | 156.5 |
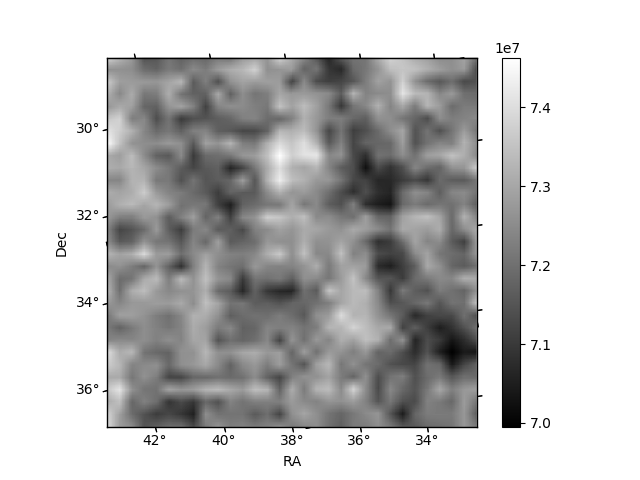
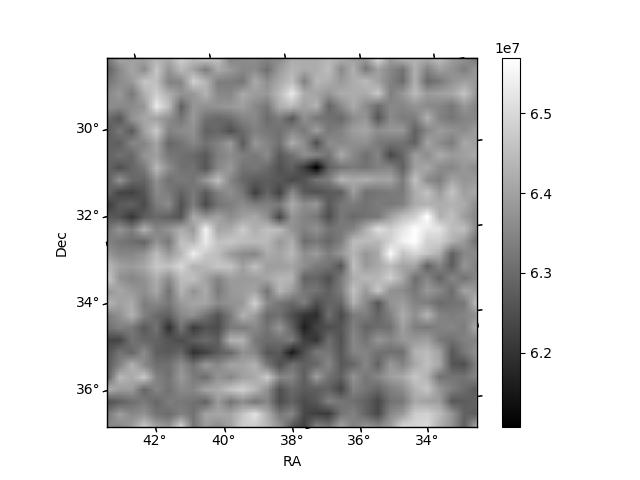
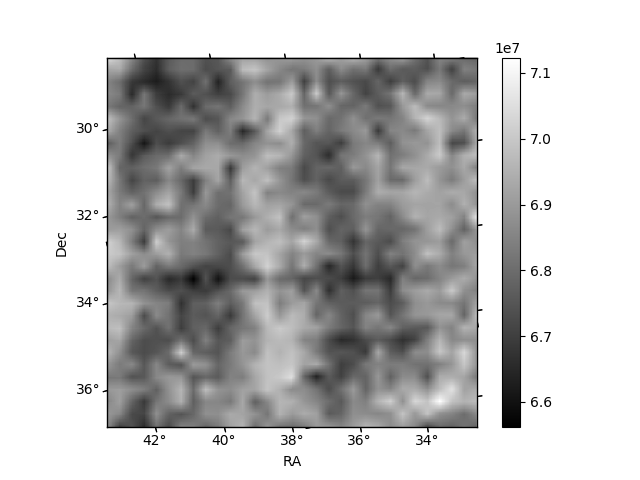
Histogram calculated using DETX and DETY for each event in the final _common_clean file
| Quadrant A | 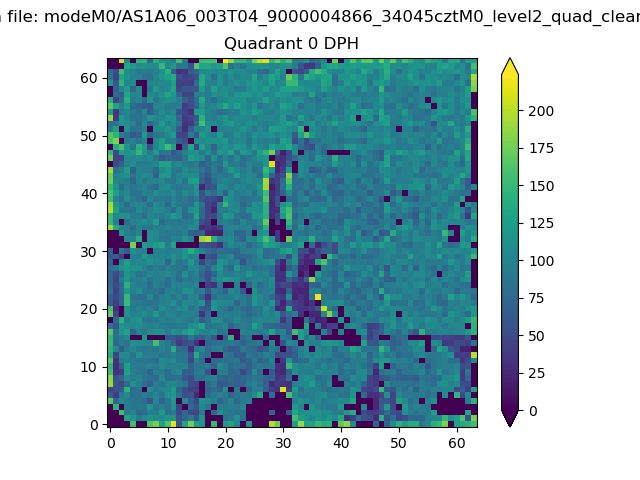 |
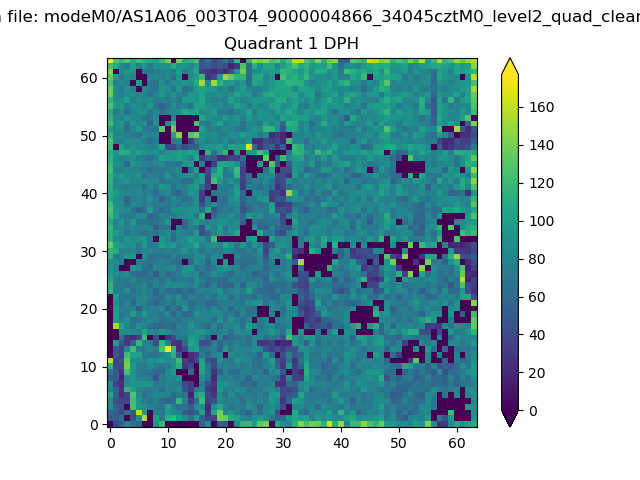 |
Quadrant B |
|---|---|---|---|
| Quadrant D | 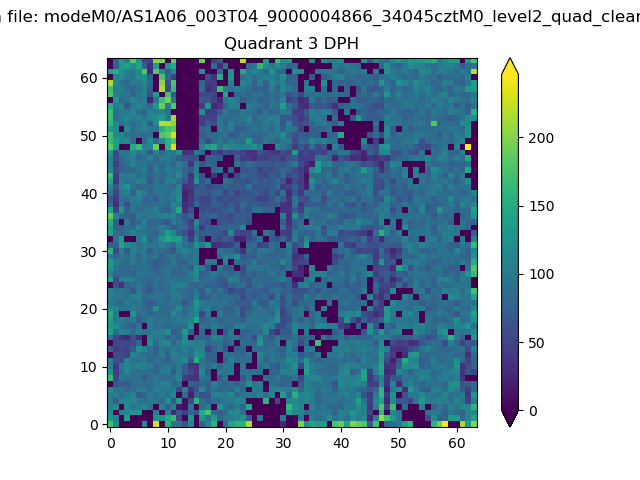 |
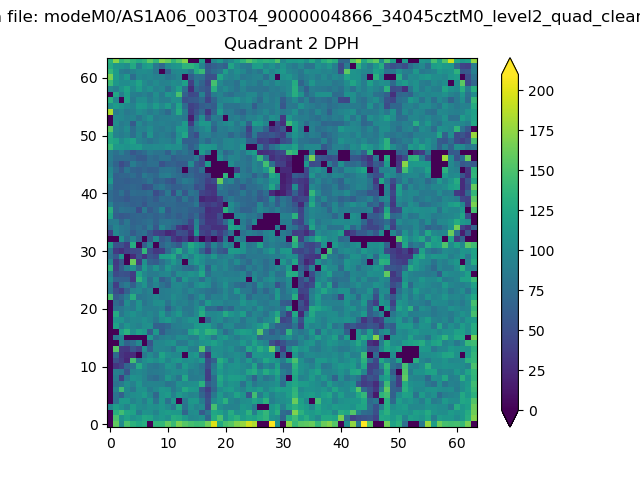 |
Quadrant C |
| Plot type | Count rate plots | Images |
|---|---|---|
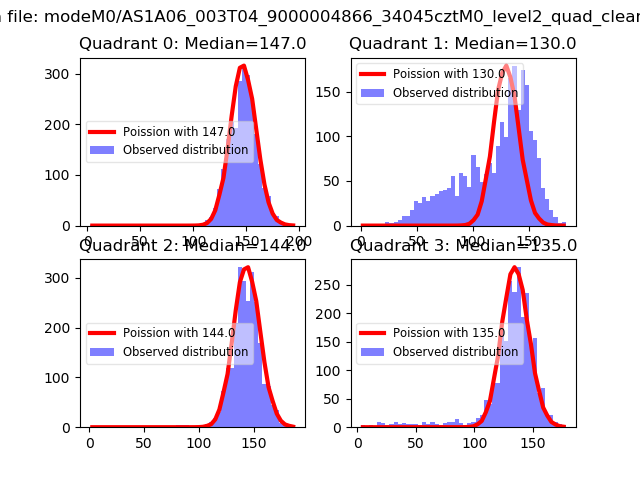
| Comparison with Poisson distribution Blue bars denote a histogram of data divided into 1 sec bins. Red curve is a Poisson curve with rate = median count rate of data. |
 |
 |
| Quadrant-wise count rates Data is divided into 100 sec bins |
 |
|
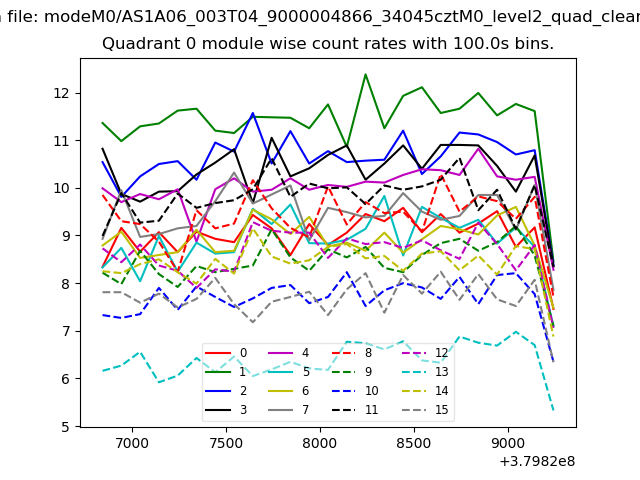
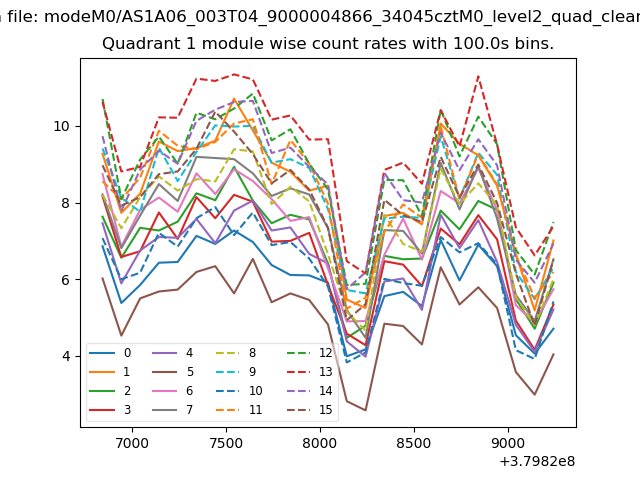
| Module-wise count rates for Quadrant A Data is divided into 100 sec bins |
 |
 |
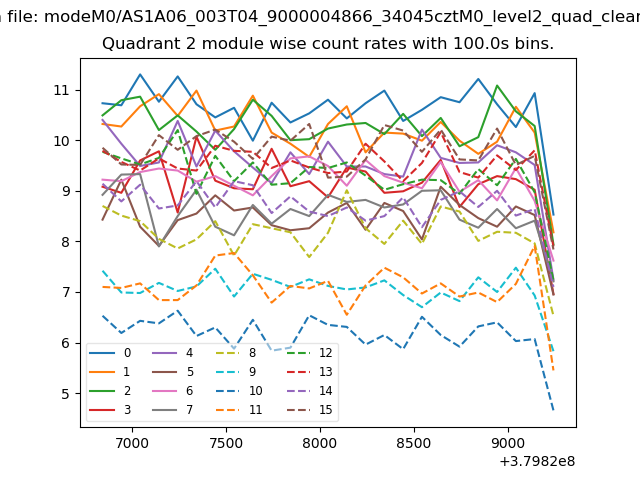
| Module-wise count rates for Quadrant B Data is divided into 100 sec bins |
 |
 |
| Module-wise count rates for Quadrant C Data is divided into 100 sec bins |
 |
 |
| Module-wise count rates for Quadrant D Data is divided into 100 sec bins |
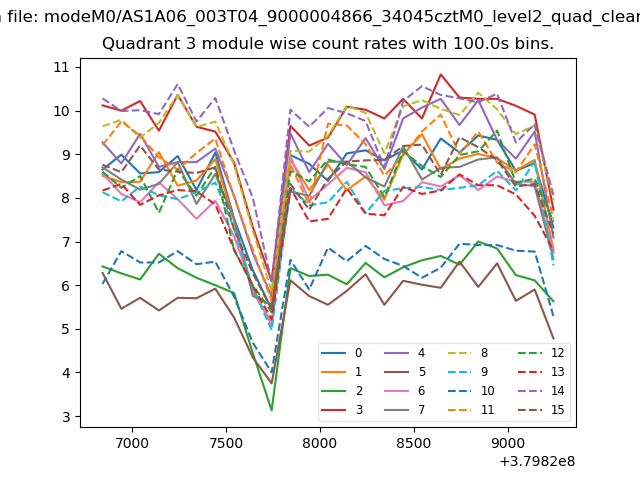 |
 |
| Parameter | Plot |
|---|---|
| CZT HV Monitor | 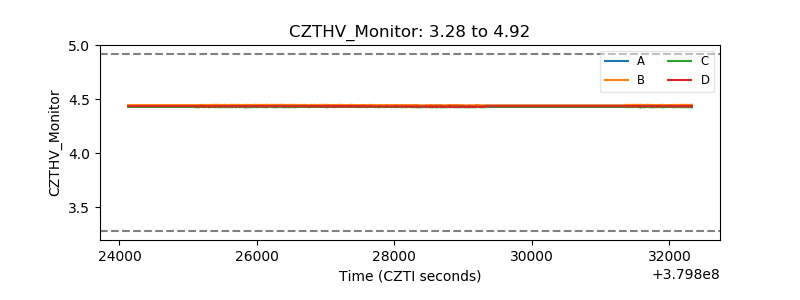 |
| D_VDD | 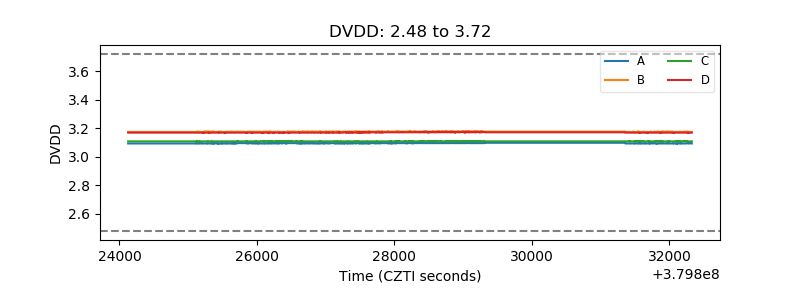 |
| Temperature 1 |  |
| Veto HV Monitor | 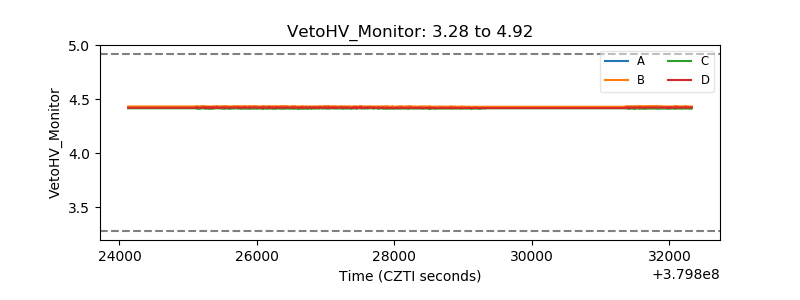 |
| Veto LLD | 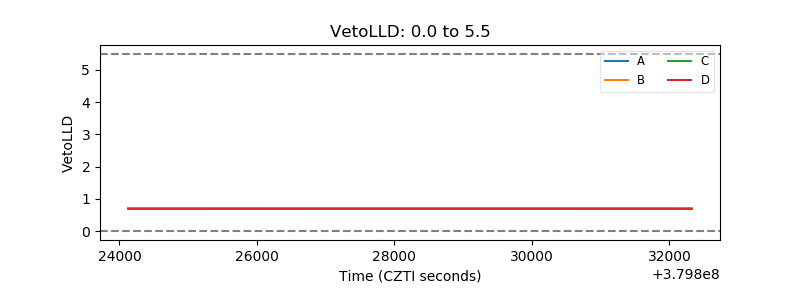 |
| Alpha Counter | 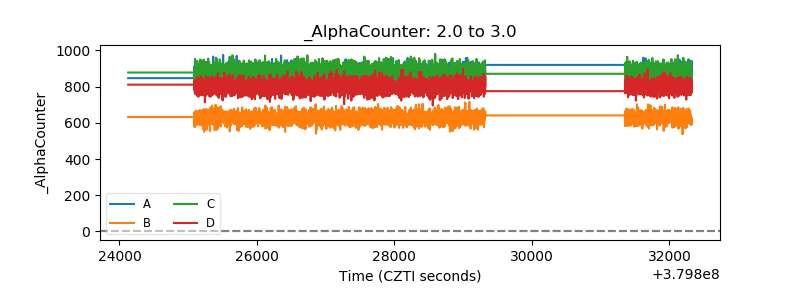 |
| _CPM_Rate | 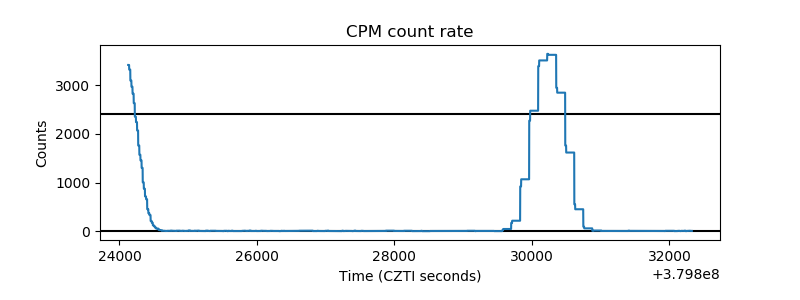 |
| CZT Counter |  |
| +2.5 Volts monitor |  |
| +5 Volts monitor |  |
| _ROLL_ROT | 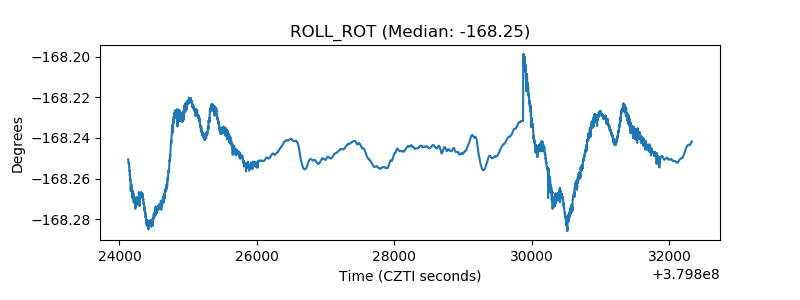 |
| _Roll_DEC | 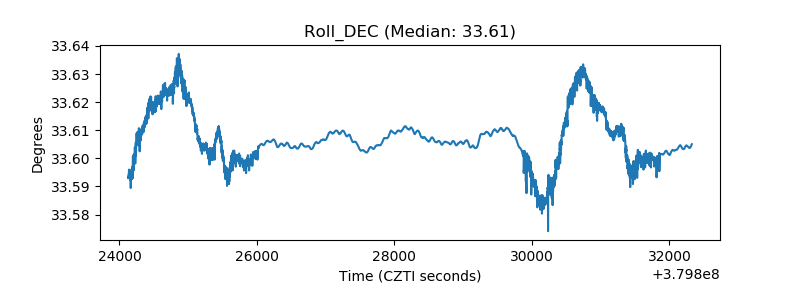 |
| _Roll_RA |  |
| Veto Counter | 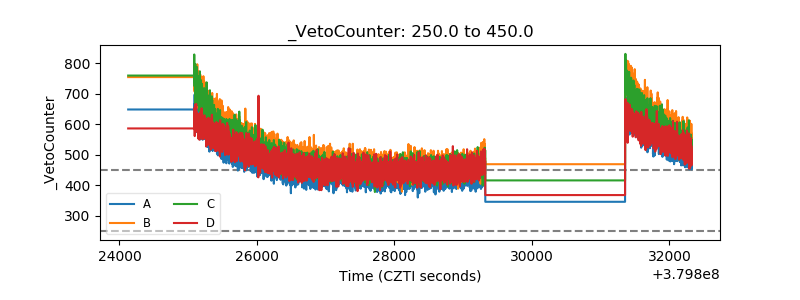 |