| Param | Original file | Final file |
|---|---|---|
| Filename | modeM0/AS1A06_003T04_9000004866_34046cztM0_level2.evt | modeM0/AS1A06_003T04_9000004866_34046cztM0_level2_quad_clean.evt |
| Size (bytes) | 737,735,040 | 60,566,400 |
| Size | 703.6 MB | 57.8 MB |
| Events in quadrant A | 5,145,196 | 382,177 |
| Events in quadrant B | 9,588,893 | 298,166 |
| Events in quadrant C | 3,291,324 | 409,091 |
| Events in quadrant D | 3,977,879 | 390,321 |
| Mode M9 | |||
|---|---|---|---|
| Quadrant | BADHDUFLAG | Total packets | Discarded packets |
| A | 0 | 31 | 0 |
| B | 0 | 31 | 0 |
| C | 0 | 31 | 0 |
| D | 0 | 32 | 0 |
| Mode M0 | |||
|---|---|---|---|
| Quadrant | BADHDUFLAG | Total packets | Discarded packets |
| A | 0 | 18665 | 3 |
| B | 0 | 31955 | 2 |
| C | 0 | 13082 | 2 |
| D | 0 | 15415 | 2 |
| Mode SS | |||
|---|---|---|---|
| Quadrant | BADHDUFLAG | Total packets | Discarded packets |
| A | 0 | 102 | 0 |
| B | 0 | 102 | 0 |
| C | 0 | 102 | 0 |
| D | 0 | 102 | 0 |
| Quadrant | Total seconds | Saturated seconds | Saturation percentage |
|---|---|---|---|
| A | 5033 | 694 | 13.788993% |
| B | 5033 | 3025 | 60.103318% |
| C | 5033 | 80 | 1.589509% |
| D | 5033 | 166 | 3.298232% |
Noise dominated data is calculated using 1-second bins in cleaned event files. If a bin has >2000 counts, and if more than 50% of those come from <1% of pixels, then it is considered to be noise-dominated and hence unusable.
| Quadrant | # 1 sec bins | Bins with >0 counts | Bins with >2000 counts | High rate bins dominated by noise | Noise dominated (total time) | Noise dominated (detector-on time) | Marked lightcurve |
|---|---|---|---|---|---|---|---|
| A | 7155 | 5034 | 656 | 656 | 9.17% | 13.03% | 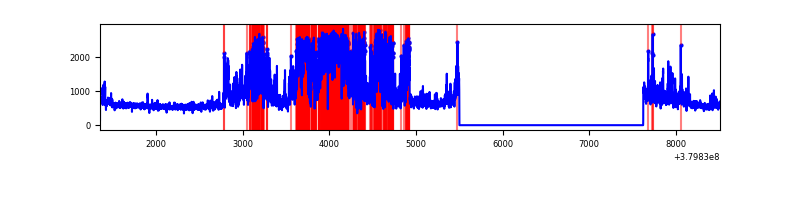 |
| B | 7155 | 5033 | 2782 | 2782 | 38.88% | 55.28% | 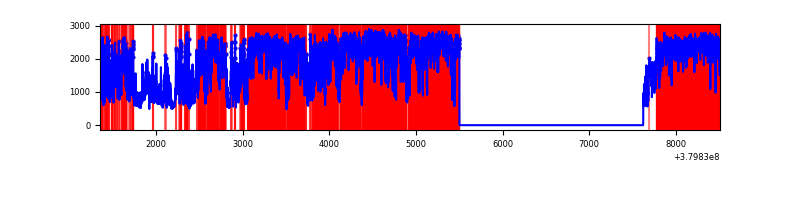 |
| C | 7155 | 5034 | 70 | 70 | 0.98% | 1.39% | 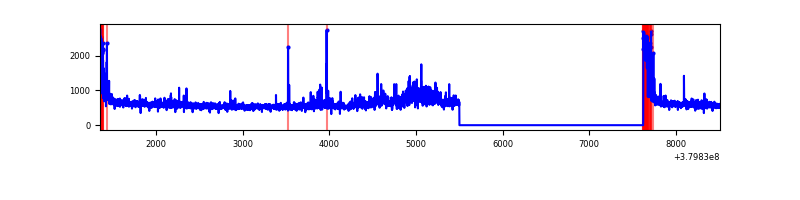 |
| D | 7155 | 5034 | 156 | 156 | 2.18% | 3.10% | 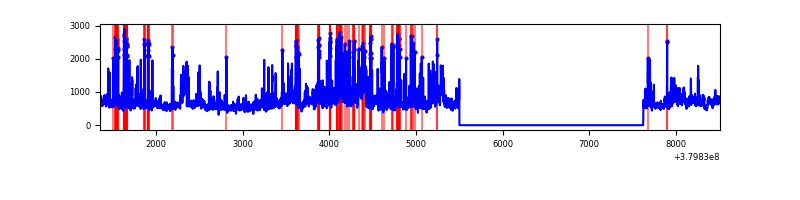 |
Top three noisy pixels from each quadrant. If the there are fewer than three noisy pixels in the level2.evt file, extra rows are filled as -1
| Pixel properties | Quadrant properties | ||||||
|---|---|---|---|---|---|---|---|
| Quadrant | DetID | PixID | Counts | Sigma | Mean | Median | Sigma |
| A | 15 | 169 | 2601845 | 20126.62 | 653 | 643 | 129.2 |
| A | 10 | 83 | 19019 | 142.18 | 653 | 643 | 129.2 |
| A | 13 | 254 | 8279 | 59.08 | 653 | 643 | 129.2 |
| B | 5 | 31 | 4170799 | 42461.0 | 531 | 521 | 98.2 |
| B | 5 | 15 | 2031117 | 20675.15 | 531 | 521 | 98.2 |
| B | 5 | 172 | 773731 | 7872.68 | 531 | 521 | 98.2 |
| C | 0 | 10 | 260956 | 1797.53 | 639 | 647 | 144.8 |
| C | 15 | 214 | 238976 | 1645.75 | 639 | 647 | 144.8 |
| C | 3 | 233 | 220574 | 1518.68 | 639 | 647 | 144.8 |
| D | 8 | 195 | 514780 | 3096.91 | 637 | 624 | 166.0 |
| D | 2 | 249 | 365986 | 2200.68 | 637 | 624 | 166.0 |
| D | 13 | 249 | 111660 | 668.8 | 637 | 624 | 166.0 |
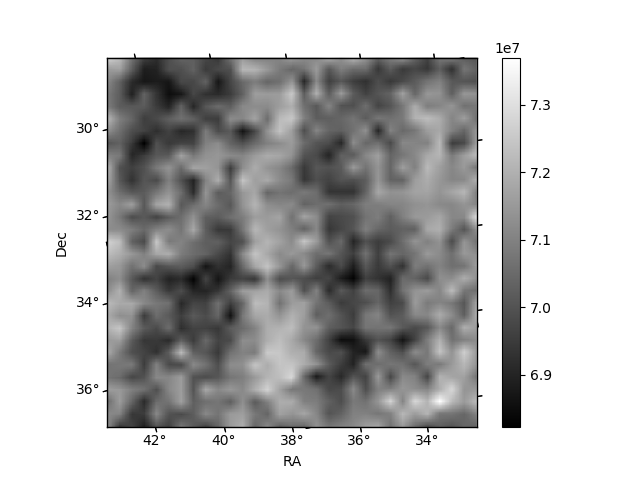
Histogram calculated using DETX and DETY for each event in the final _common_clean file
| Quadrant A | 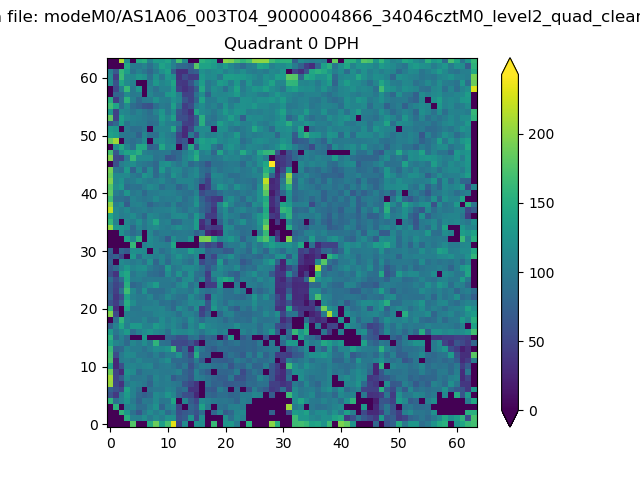 |
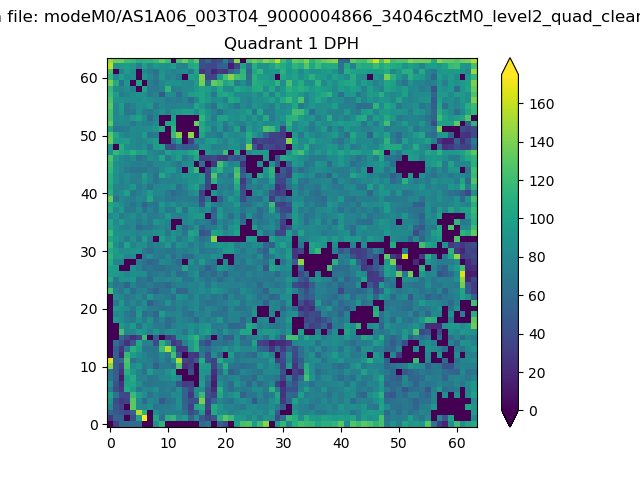 |
Quadrant B |
|---|---|---|---|
| Quadrant D | 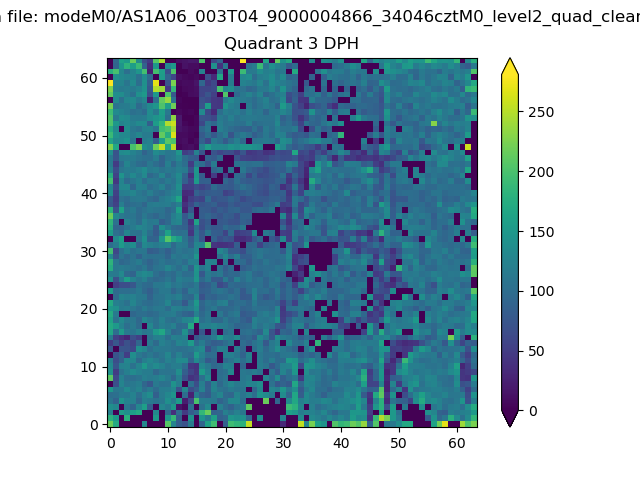 |
 |
Quadrant C |
| Plot type | Count rate plots | Images |
|---|---|---|
| Comparison with Poisson distribution Blue bars denote a histogram of data divided into 1 sec bins. Red curve is a Poisson curve with rate = median count rate of data. |
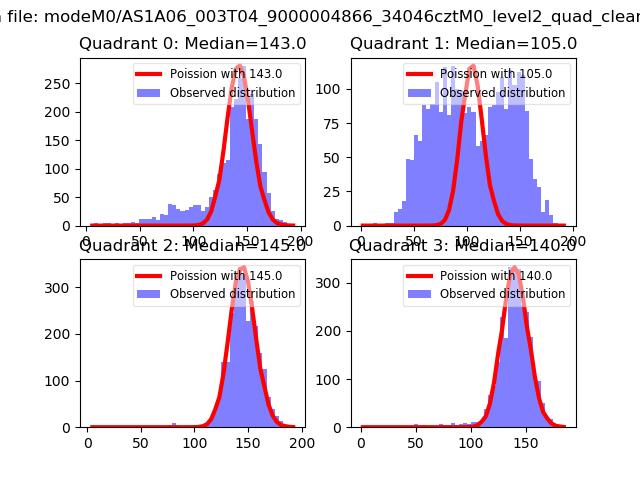 |
 |
| Quadrant-wise count rates Data is divided into 100 sec bins |
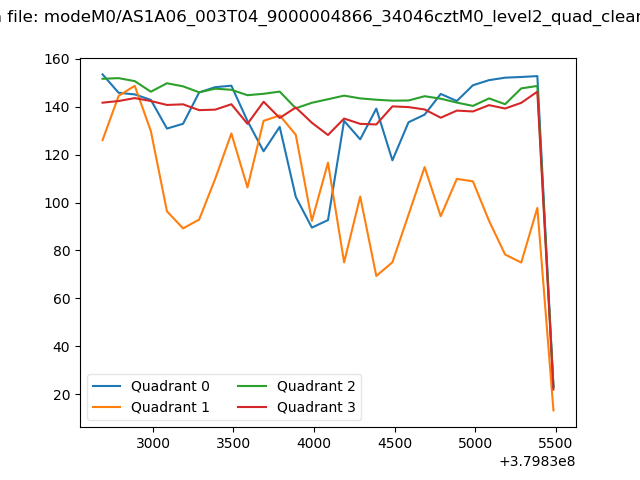 |
|
| Module-wise count rates for Quadrant A Data is divided into 100 sec bins |
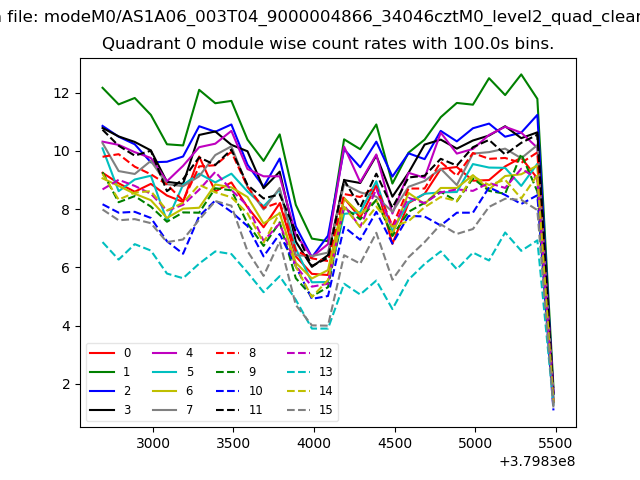 |
 |
| Module-wise count rates for Quadrant B Data is divided into 100 sec bins |
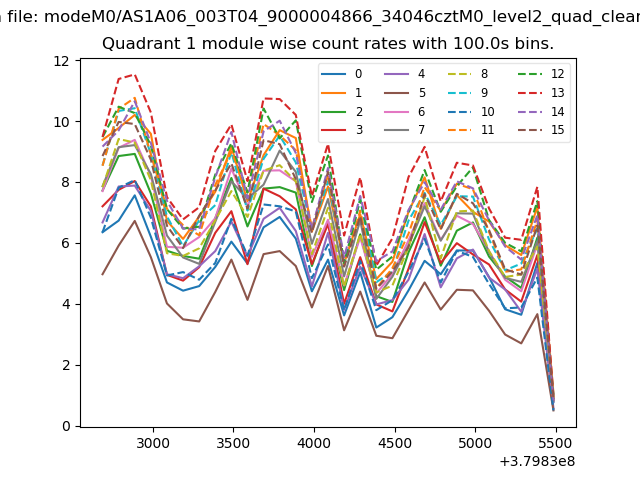 |
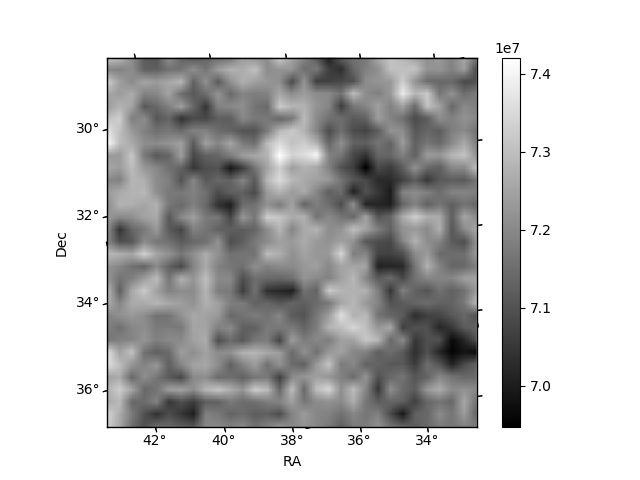 |
| Module-wise count rates for Quadrant C Data is divided into 100 sec bins |
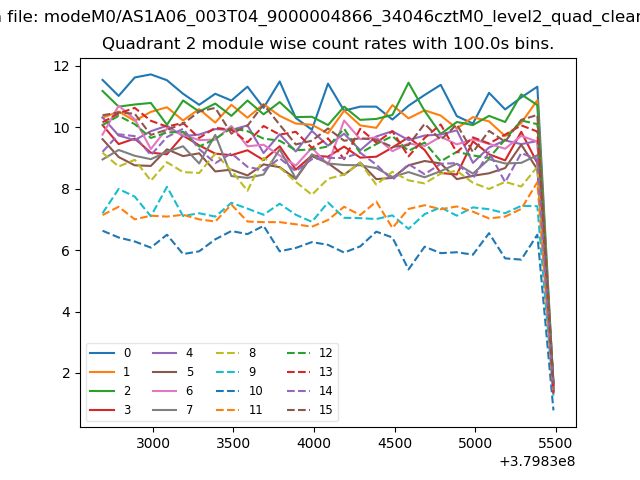 |
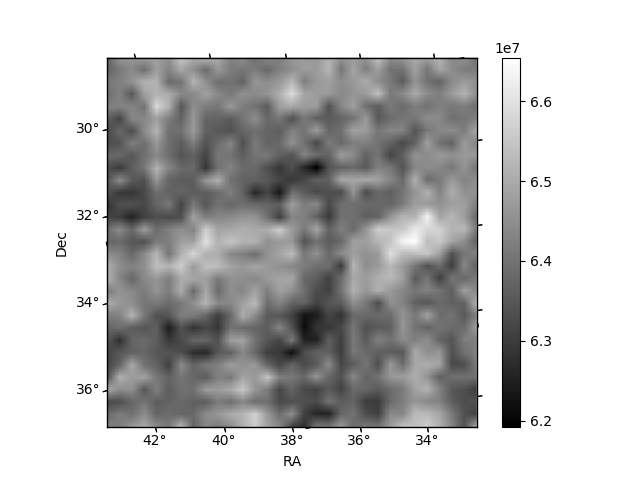 |
| Module-wise count rates for Quadrant D Data is divided into 100 sec bins |
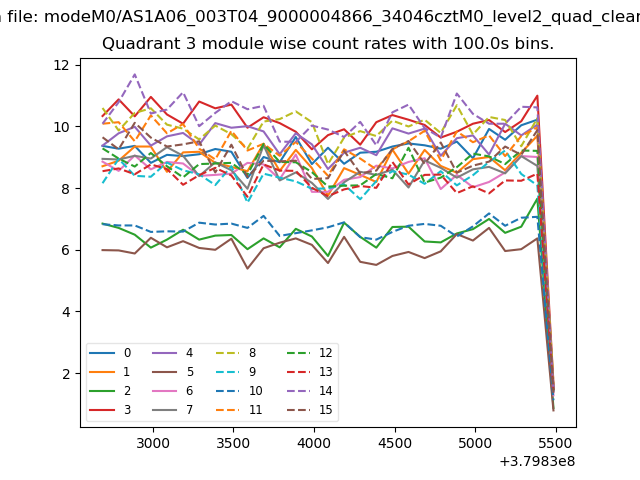 |
 |
| Parameter | Plot |
|---|---|
| CZT HV Monitor | 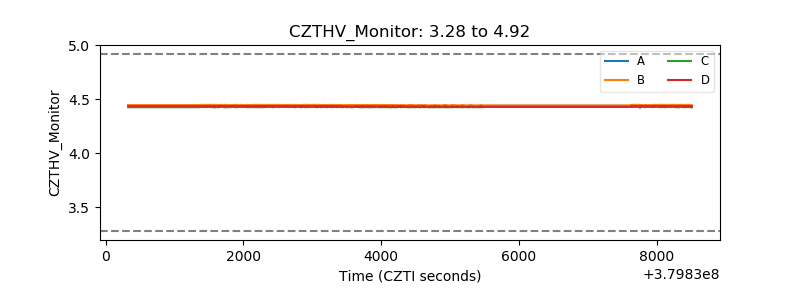 |
| D_VDD | 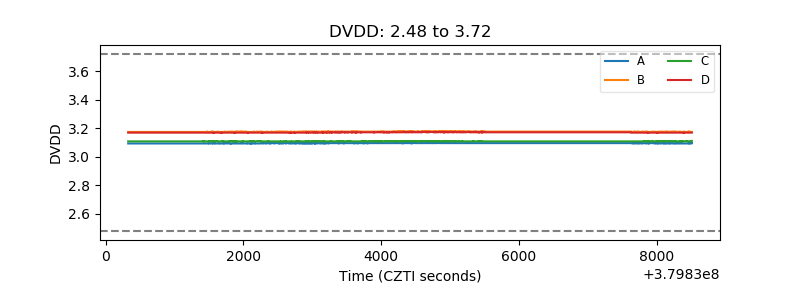 |
| Temperature 1 | 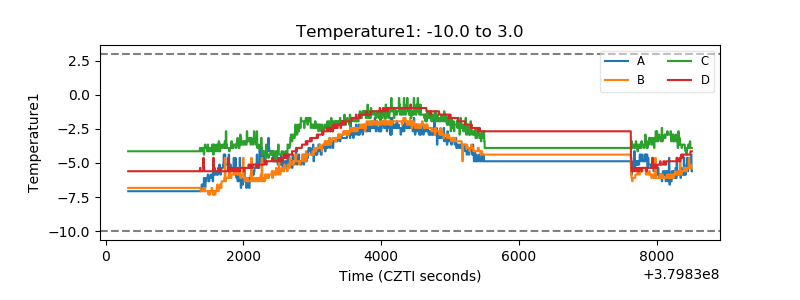 |
| Veto HV Monitor |  |
| Veto LLD |  |
| Alpha Counter | 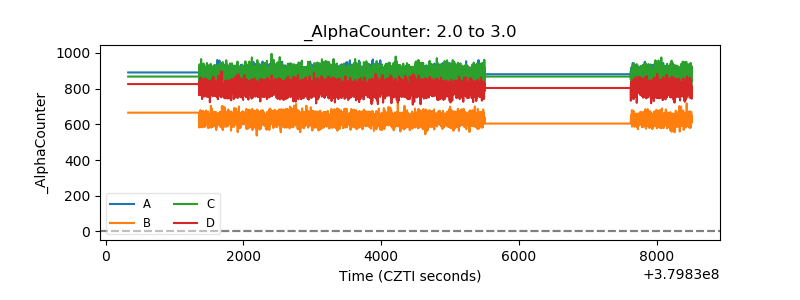 |
| _CPM_Rate | 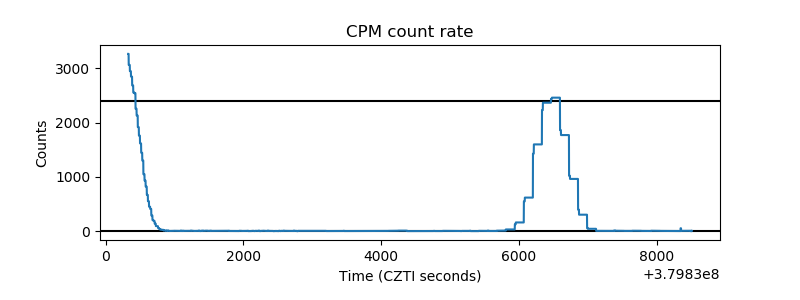 |
| CZT Counter |  |
| +2.5 Volts monitor |  |
| +5 Volts monitor | 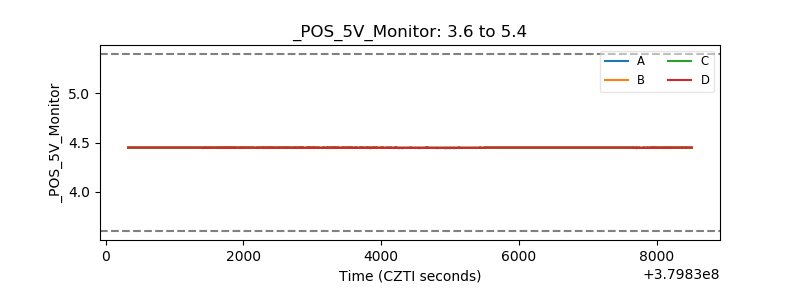 |
| _ROLL_ROT | 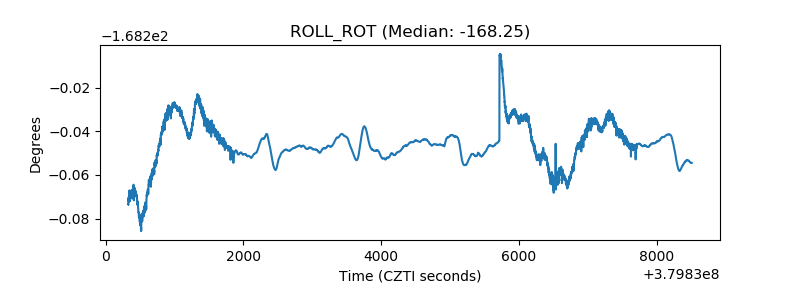 |
| _Roll_DEC | 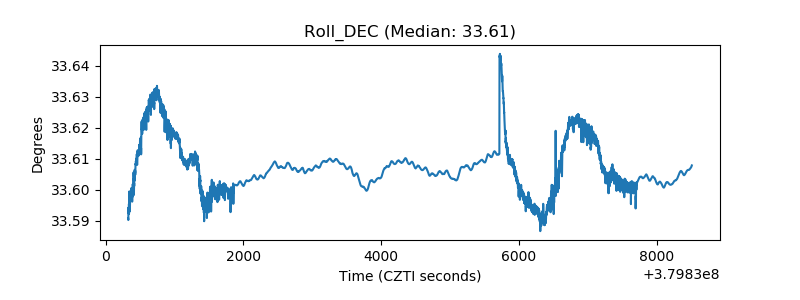 |
| _Roll_RA | 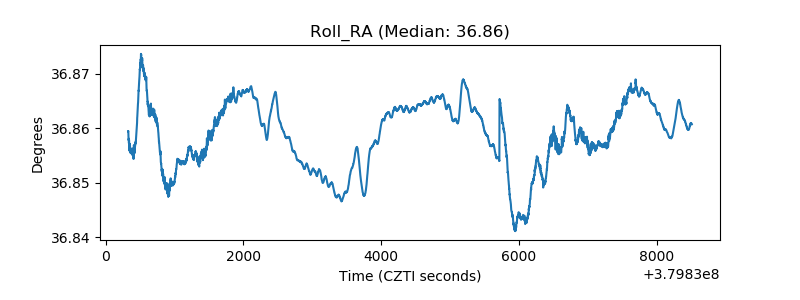 |
| Veto Counter | 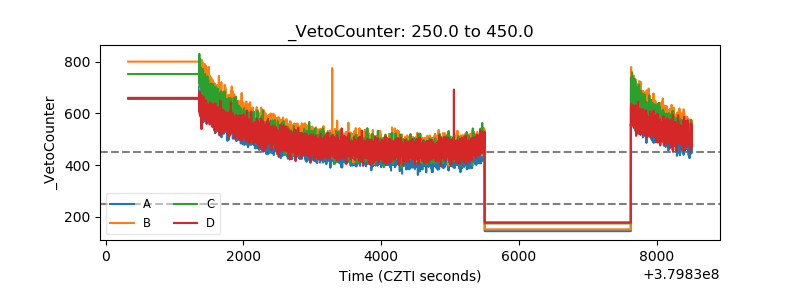 |