| Param | Original file | Final file |
|---|---|---|
| Filename | modeM0/AS1A06_003T04_9000004866_34047cztM0_level2.evt | modeM0/AS1A06_003T04_9000004866_34047cztM0_level2_quad_clean.evt |
| Size (bytes) | 781,646,400 | 72,354,240 |
| Size | 745.4 MB | 69.0 MB |
| Events in quadrant A | 5,598,616 | 470,089 |
| Events in quadrant B | 10,450,119 | 363,959 |
| Events in quadrant C | 3,187,030 | 520,753 |
| Events in quadrant D | 4,098,880 | 483,369 |
| Mode M9 | |||
|---|---|---|---|
| Quadrant | BADHDUFLAG | Total packets | Discarded packets |
| A | 0 | 33 | 0 |
| B | 0 | 33 | 0 |
| C | 0 | 33 | 0 |
| D | 0 | 34 | 0 |
| Mode M0 | |||
|---|---|---|---|
| Quadrant | BADHDUFLAG | Total packets | Discarded packets |
| A | 0 | 19971 | 3 |
| B | 0 | 34434 | 2 |
| C | 0 | 12620 | 2 |
| D | 0 | 15627 | 2 |
| Mode SS | |||
|---|---|---|---|
| Quadrant | BADHDUFLAG | Total packets | Discarded packets |
| A | 0 | 104 | 0 |
| B | 0 | 104 | 0 |
| C | 0 | 104 | 0 |
| D | 0 | 104 | 0 |
| Quadrant | Total seconds | Saturated seconds | Saturation percentage |
|---|---|---|---|
| A | 4998 | 995 | 19.907963% |
| B | 4998 | 3828 | 76.590636% |
| C | 4998 | 103 | 2.060824% |
| D | 4998 | 241 | 4.821929% |
Noise dominated data is calculated using 1-second bins in cleaned event files. If a bin has >2000 counts, and if more than 50% of those come from <1% of pixels, then it is considered to be noise-dominated and hence unusable.
| Quadrant | # 1 sec bins | Bins with >0 counts | Bins with >2000 counts | High rate bins dominated by noise | Noise dominated (total time) | Noise dominated (detector-on time) | Marked lightcurve |
|---|---|---|---|---|---|---|---|
| A | 7121 | 4998 | 992 | 992 | 13.93% | 19.85% | 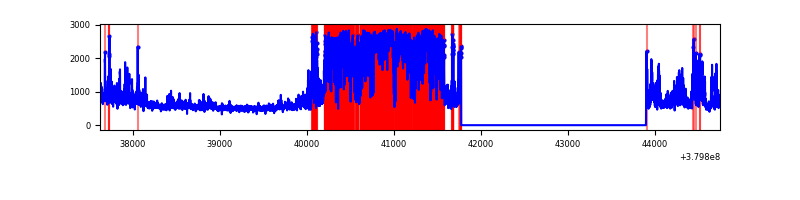 |
| B | 7120 | 4997 | 3558 | 3558 | 49.97% | 71.20% | 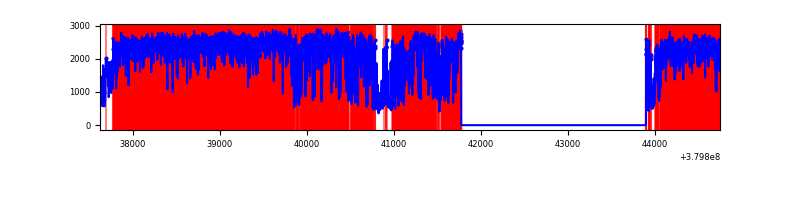 |
| C | 7121 | 4999 | 75 | 75 | 1.05% | 1.50% | 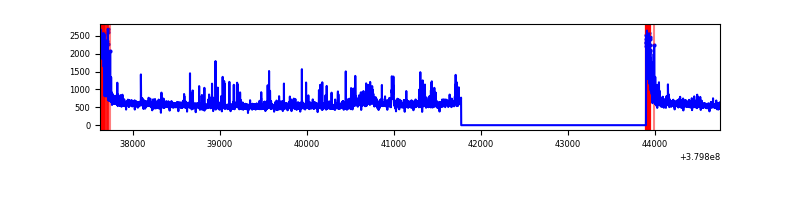 |
| D | 7121 | 4999 | 236 | 236 | 3.31% | 4.72% | 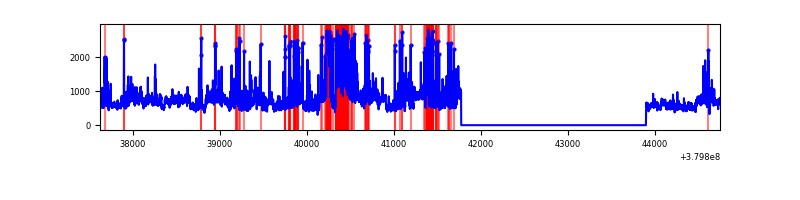 |
Top three noisy pixels from each quadrant. If the there are fewer than three noisy pixels in the level2.evt file, extra rows are filled as -1
| Pixel properties | Quadrant properties | ||||||
|---|---|---|---|---|---|---|---|
| Quadrant | DetID | PixID | Counts | Sigma | Mean | Median | Sigma |
| A | 15 | 169 | 3221323 | 26688.88 | 611 | 600 | 120.7 |
| A | 10 | 83 | 18597 | 149.13 | 611 | 600 | 120.7 |
| A | 13 | 254 | 8277 | 63.62 | 611 | 600 | 120.7 |
| B | 5 | 31 | 4376813 | 50279.27 | 464 | 456 | 87.0 |
| B | 5 | 15 | 2557017 | 29371.92 | 464 | 456 | 87.0 |
| B | 5 | 172 | 708975 | 8140.06 | 464 | 456 | 87.0 |
| C | 0 | 10 | 277029 | 1969.78 | 615 | 622 | 140.3 |
| C | 15 | 214 | 237449 | 1687.71 | 615 | 622 | 140.3 |
| C | 0 | 207 | 114920 | 814.53 | 615 | 622 | 140.3 |
| D | 8 | 195 | 677799 | 4489.19 | 619 | 604 | 150.9 |
| D | 12 | 233 | 412021 | 2727.32 | 619 | 604 | 150.9 |
| D | 2 | 249 | 358103 | 2369.89 | 619 | 604 | 150.9 |
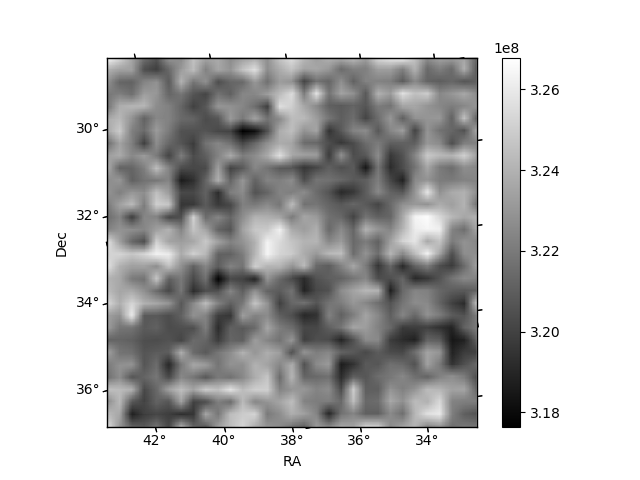
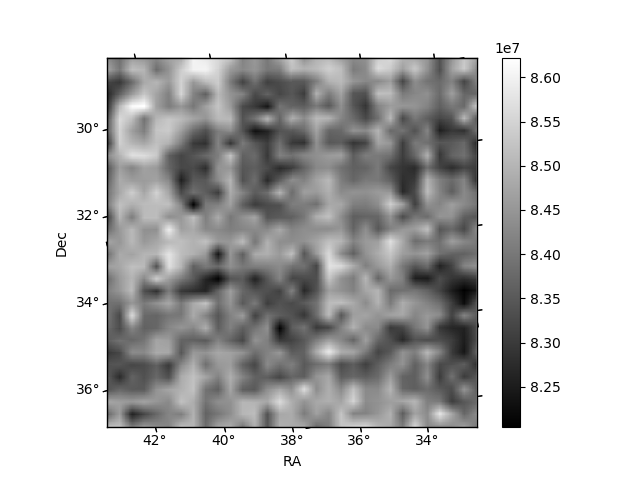
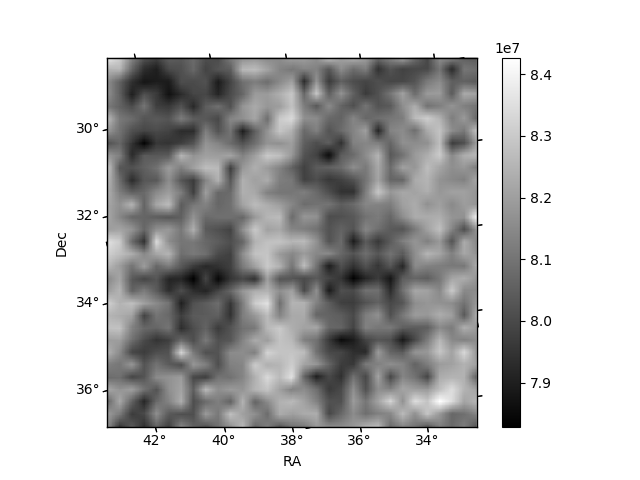
Histogram calculated using DETX and DETY for each event in the final _common_clean file
| Quadrant A | 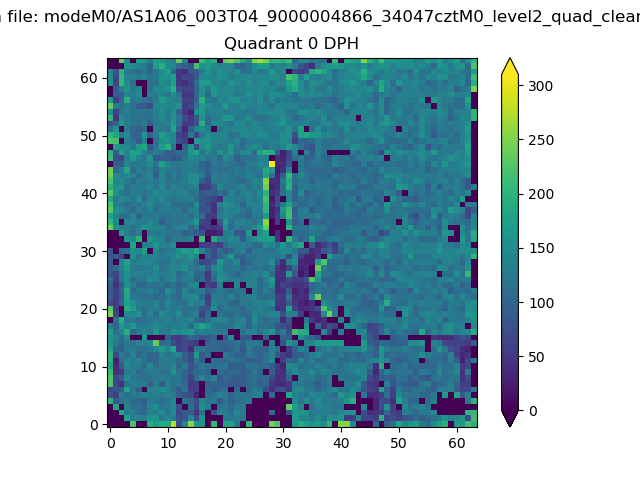 |
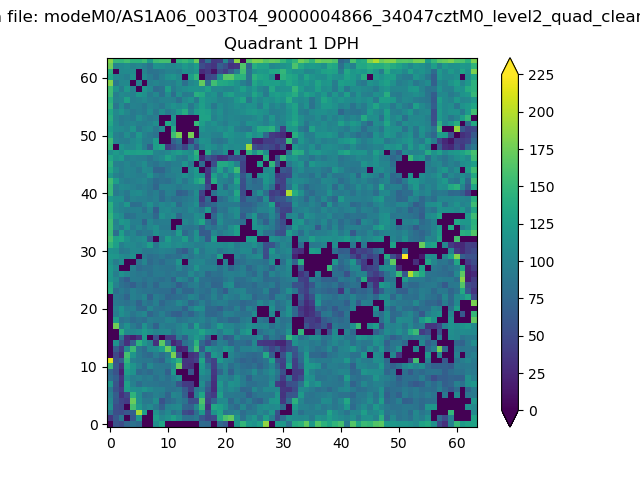 |
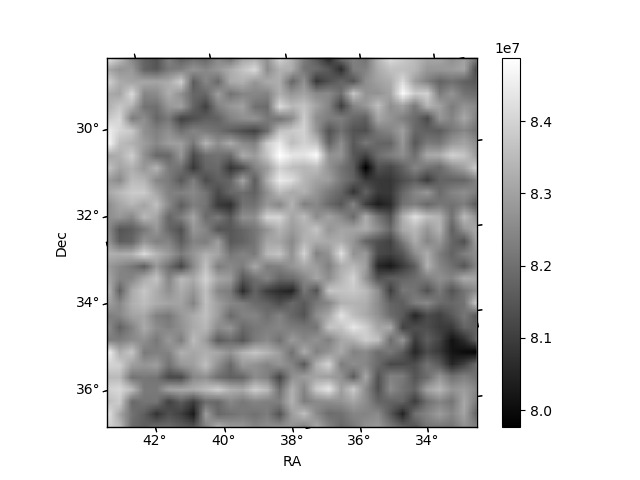
Quadrant B |
|---|---|---|---|
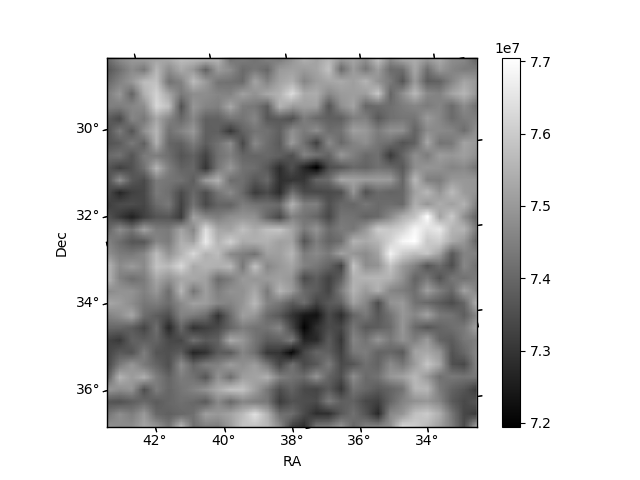
| Quadrant D | 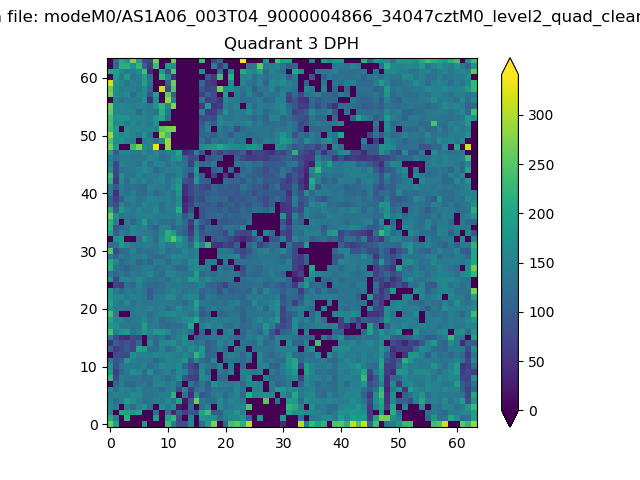 |
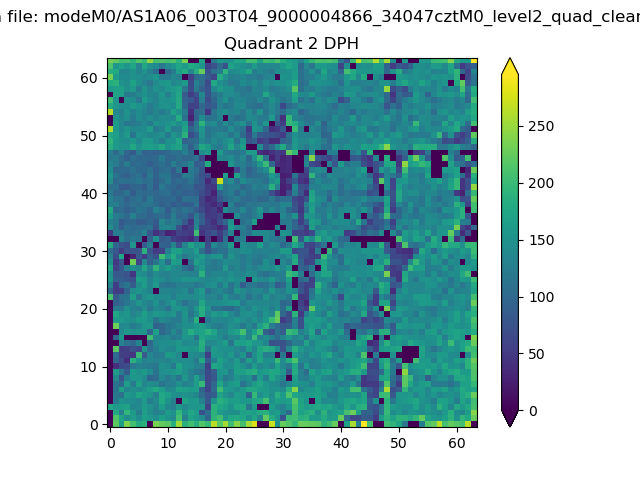 |
Quadrant C |
| Plot type | Count rate plots | Images |
|---|---|---|
| Comparison with Poisson distribution Blue bars denote a histogram of data divided into 1 sec bins. Red curve is a Poisson curve with rate = median count rate of data. |
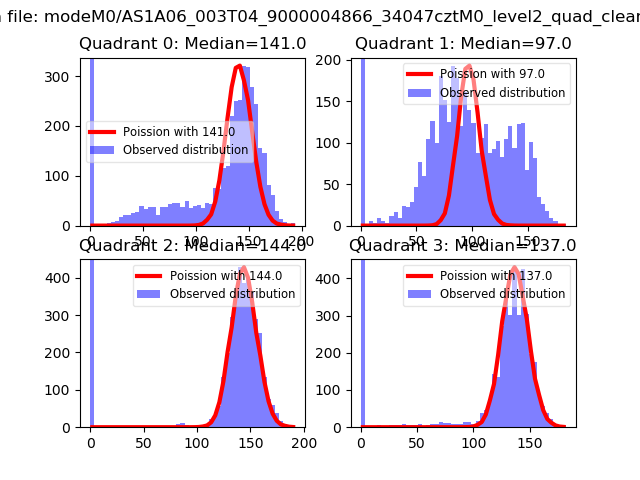 |
 |
| Quadrant-wise count rates Data is divided into 100 sec bins |
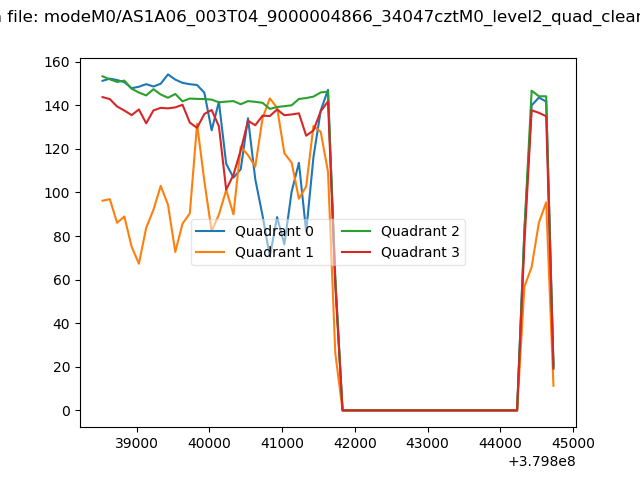 |
|
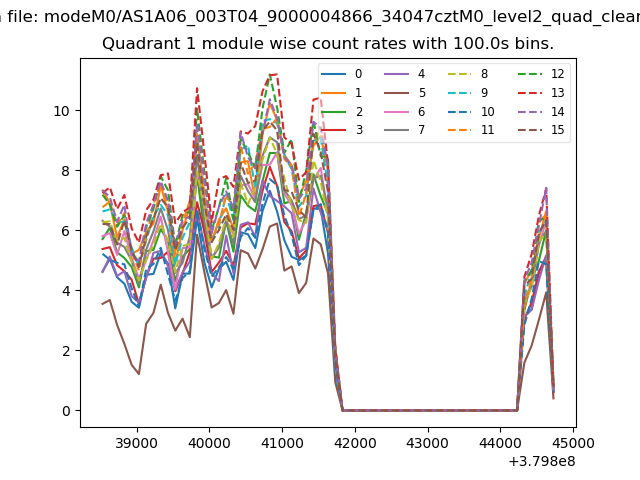
| Module-wise count rates for Quadrant A Data is divided into 100 sec bins |
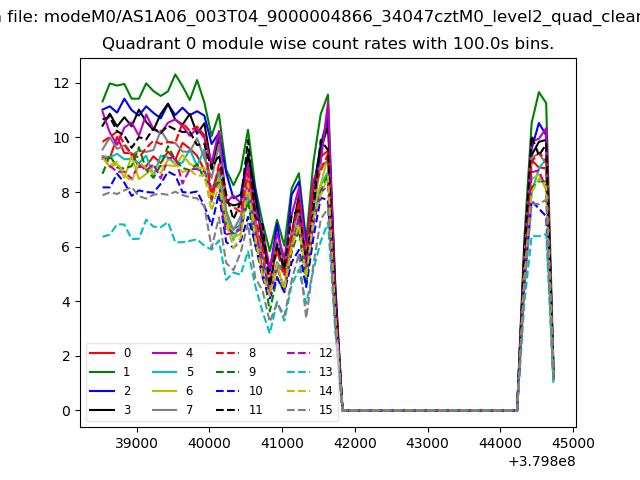 |
 |
| Module-wise count rates for Quadrant B Data is divided into 100 sec bins |
 |
 |
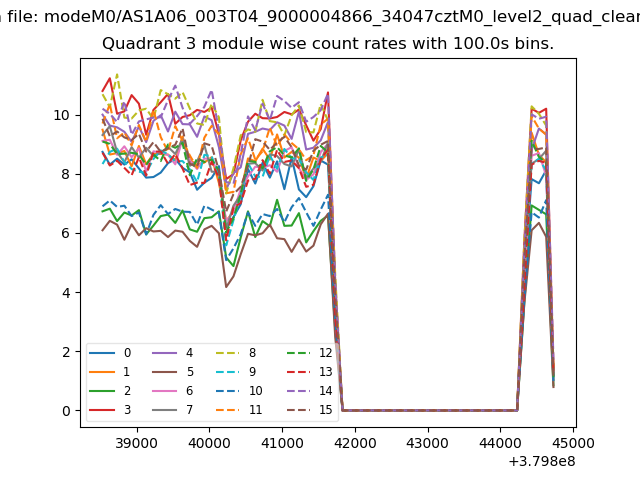
| Module-wise count rates for Quadrant C Data is divided into 100 sec bins |
 |
 |
| Module-wise count rates for Quadrant D Data is divided into 100 sec bins |
 |
 |
| Parameter | Plot |
|---|---|
| CZT HV Monitor |  |
| D_VDD | 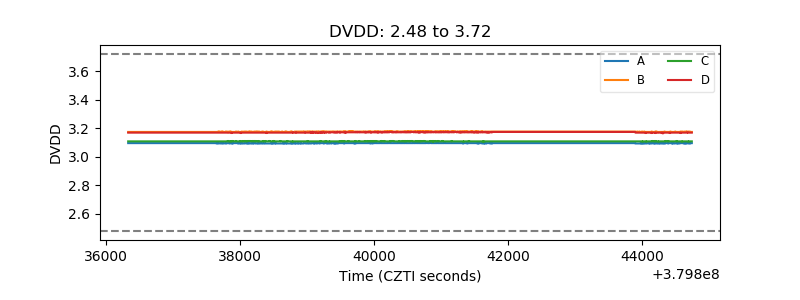 |
| Temperature 1 | 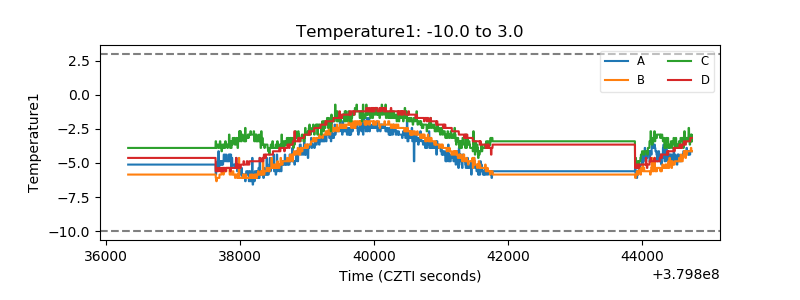 |
| Veto HV Monitor | 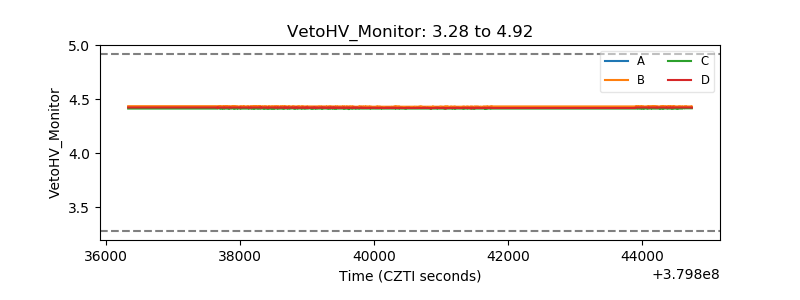 |
| Veto LLD | 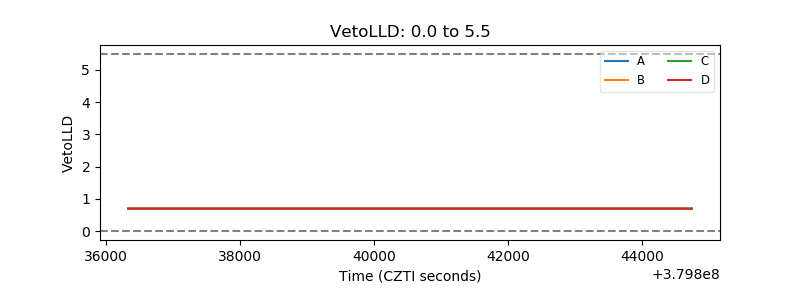 |
| Alpha Counter | 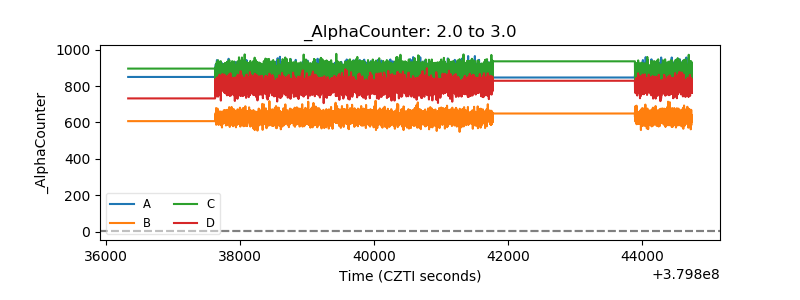 |
| _CPM_Rate | 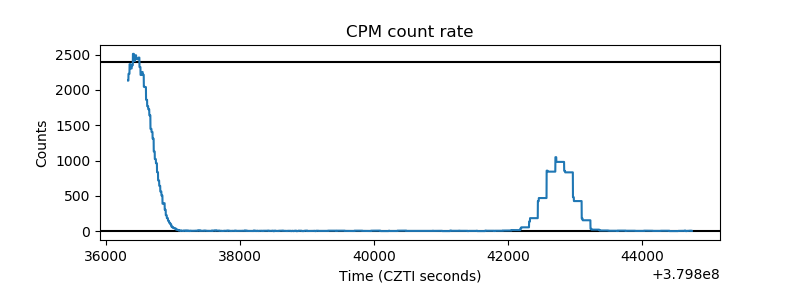 |
| CZT Counter | 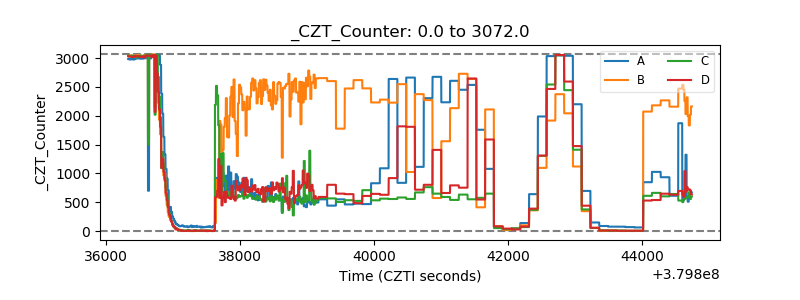 |
| +2.5 Volts monitor | 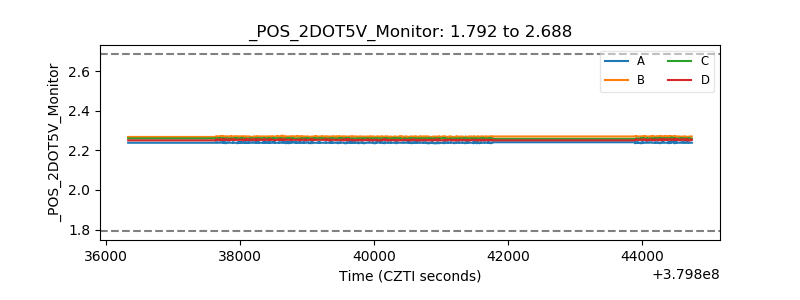 |
| +5 Volts monitor |  |
| _ROLL_ROT | 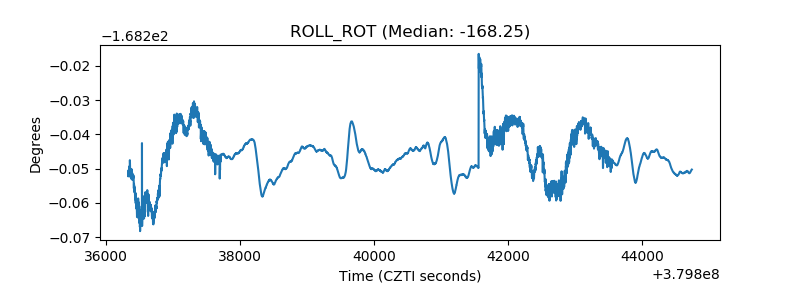 |
| _Roll_DEC | 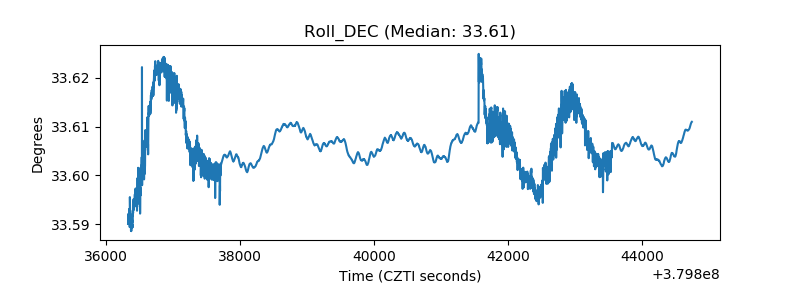 |
| _Roll_RA | 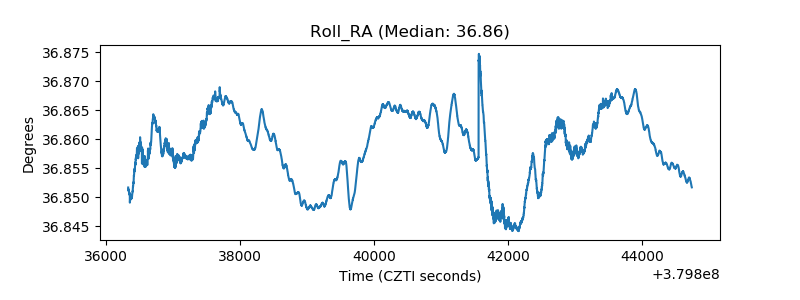 |
| Veto Counter | 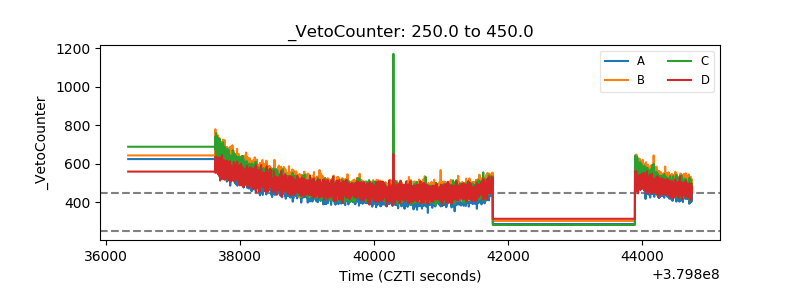 |