| Param | Original file | Final file |
|---|---|---|
| Filename | modeM0/AS1A06_003T04_9000004866_34048cztM0_level2.evt | modeM0/AS1A06_003T04_9000004866_34048cztM0_level2_quad_clean.evt |
| Size (bytes) | 786,263,040 | 83,232,000 |
| Size | 749.8 MB | 79.4 MB |
| Events in quadrant A | 7,375,166 | 492,433 |
| Events in quadrant B | 7,571,136 | 521,262 |
| Events in quadrant C | 3,416,934 | 607,466 |
| Events in quadrant D | 5,109,386 | 544,230 |
| Mode M9 | |||
|---|---|---|---|
| Quadrant | BADHDUFLAG | Total packets | Discarded packets |
| A | 0 | 24 | 0 |
| B | 0 | 24 | 0 |
| C | 0 | 24 | 0 |
| D | 0 | 25 | 0 |
| Mode M0 | |||
|---|---|---|---|
| Quadrant | BADHDUFLAG | Total packets | Discarded packets |
| A | 0 | 25438 | 3 |
| B | 0 | 25915 | 2 |
| C | 0 | 13497 | 2 |
| D | 0 | 18696 | 2 |
| Mode SS | |||
|---|---|---|---|
| Quadrant | BADHDUFLAG | Total packets | Discarded packets |
| A | 0 | 104 | 0 |
| B | 0 | 104 | 0 |
| C | 0 | 104 | 0 |
| D | 0 | 104 | 0 |
| Quadrant | Total seconds | Saturated seconds | Saturation percentage |
|---|---|---|---|
| A | 5037 | 1747 | 34.683343% |
| B | 5037 | 2051 | 40.718682% |
| C | 5037 | 105 | 2.084574% |
| D | 5037 | 580 | 11.514791% |
Noise dominated data is calculated using 1-second bins in cleaned event files. If a bin has >2000 counts, and if more than 50% of those come from <1% of pixels, then it is considered to be noise-dominated and hence unusable.
| Quadrant | # 1 sec bins | Bins with >0 counts | Bins with >2000 counts | High rate bins dominated by noise | Noise dominated (total time) | Noise dominated (detector-on time) | Marked lightcurve |
|---|---|---|---|---|---|---|---|
| A | 7069 | 5036 | 1671 | 1671 | 23.64% | 33.18% | 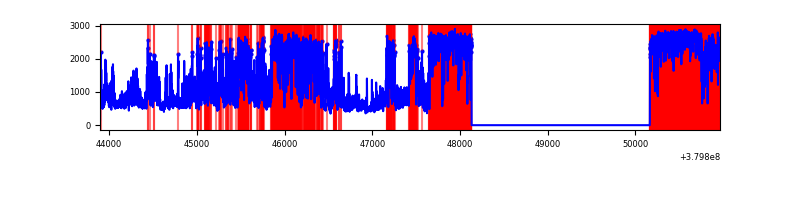 |
| B | 7070 | 5038 | 1914 | 1914 | 27.07% | 37.99% | 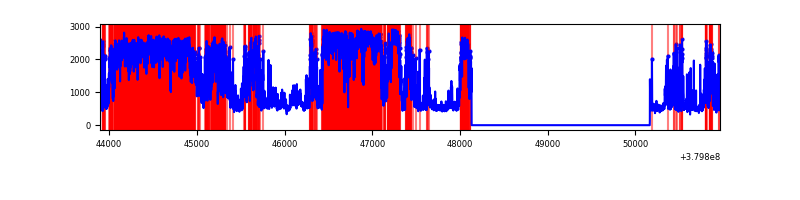 |
| C | 7070 | 5038 | 78 | 78 | 1.10% | 1.55% | 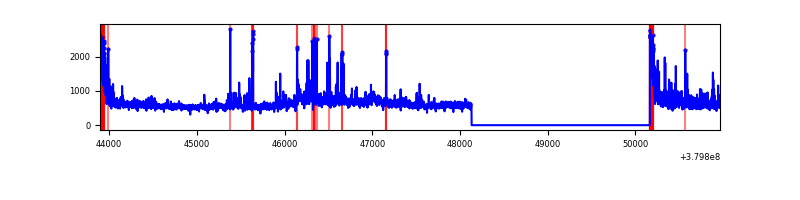 |
| D | 7070 | 5038 | 574 | 574 | 8.12% | 11.39% | 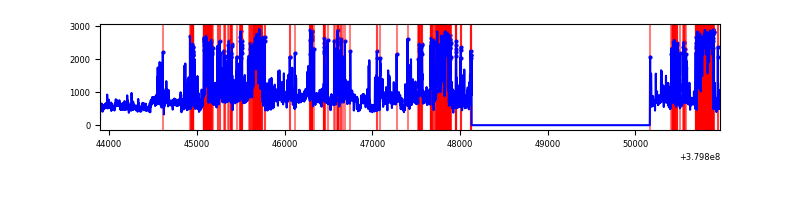 |
Top three noisy pixels from each quadrant. If the there are fewer than three noisy pixels in the level2.evt file, extra rows are filled as -1
| Pixel properties | Quadrant properties | ||||||
|---|---|---|---|---|---|---|---|
| Quadrant | DetID | PixID | Counts | Sigma | Mean | Median | Sigma |
| A | 15 | 169 | 5347247 | 51144.48 | 519 | 510 | 104.5 |
| A | 10 | 83 | 15108 | 139.64 | 519 | 510 | 104.5 |
| A | 13 | 254 | 7792 | 69.66 | 519 | 510 | 104.5 |
| B | 5 | 31 | 2719045 | 27406.28 | 525 | 513 | 99.2 |
| B | 5 | 15 | 1372656 | 13832.96 | 525 | 513 | 99.2 |
| B | 5 | 172 | 691776 | 6968.82 | 525 | 513 | 99.2 |
| C | 0 | 10 | 343123 | 2513.62 | 591 | 596 | 136.3 |
| C | 3 | 233 | 318952 | 2336.24 | 591 | 596 | 136.3 |
| C | 15 | 214 | 240844 | 1763.05 | 591 | 596 | 136.3 |
| D | 8 | 195 | 921823 | 6574.56 | 575 | 560 | 140.1 |
| D | 2 | 250 | 569820 | 4062.5 | 575 | 560 | 140.1 |
| D | 2 | 249 | 363102 | 2587.27 | 575 | 560 | 140.1 |
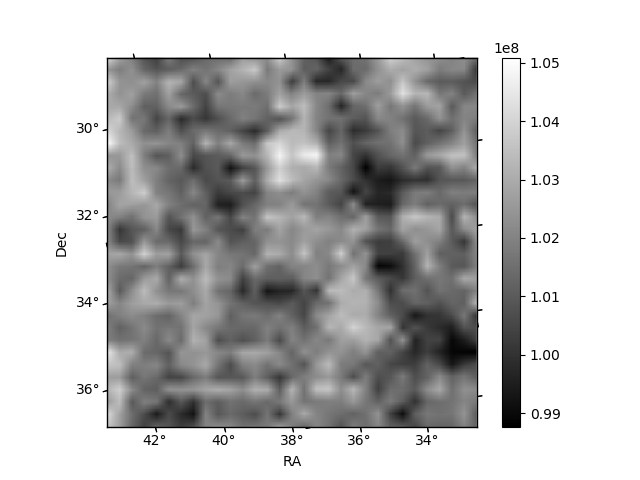
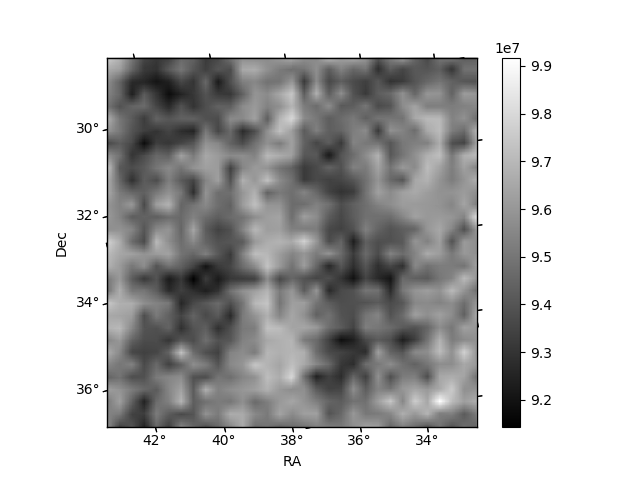
Histogram calculated using DETX and DETY for each event in the final _common_clean file
| Quadrant A | 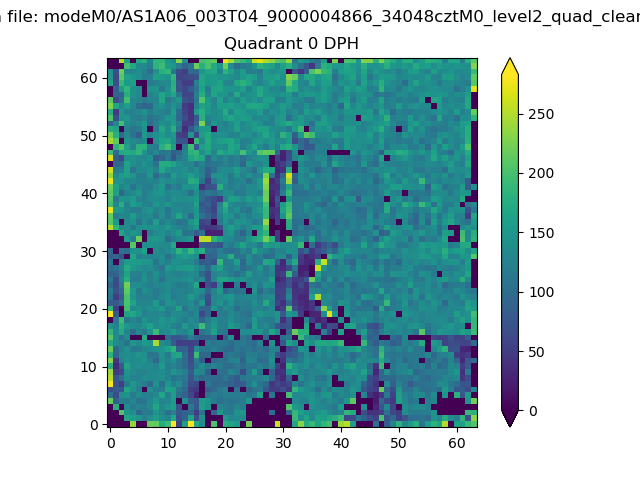 |
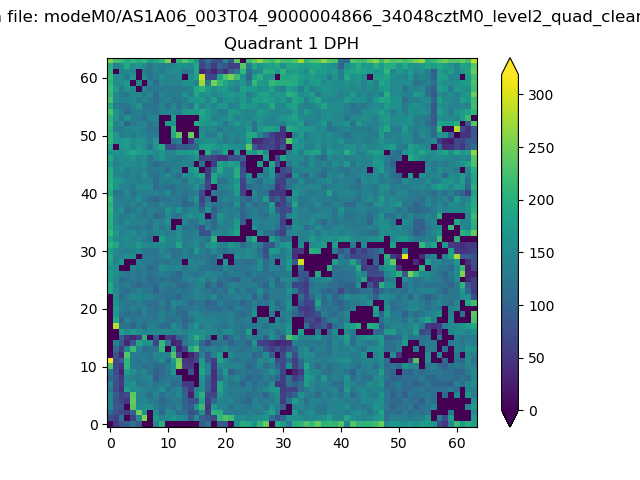 |
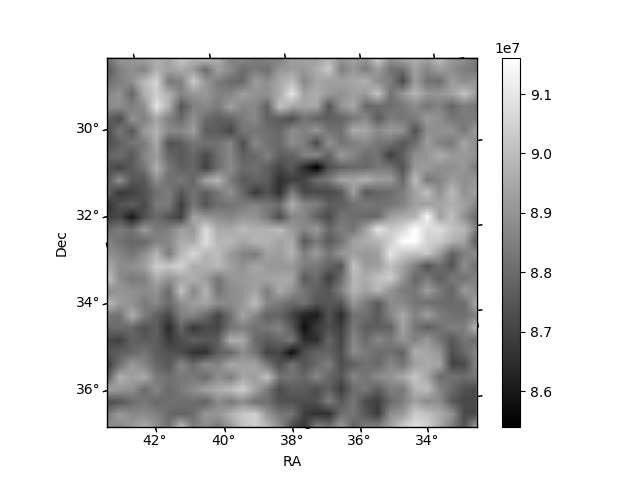
Quadrant B |
|---|---|---|---|
| Quadrant D | 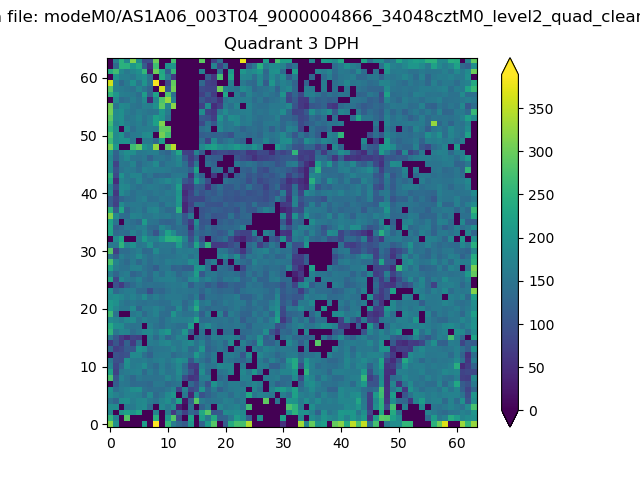 |
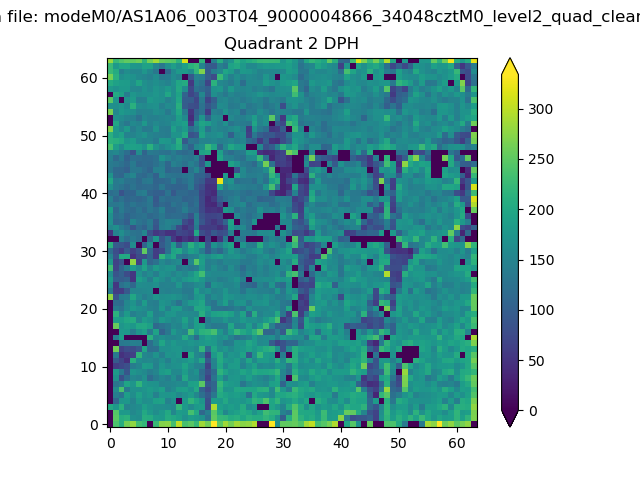 |
Quadrant C |
| Plot type | Count rate plots | Images |
|---|---|---|
| Comparison with Poisson distribution Blue bars denote a histogram of data divided into 1 sec bins. Red curve is a Poisson curve with rate = median count rate of data. |
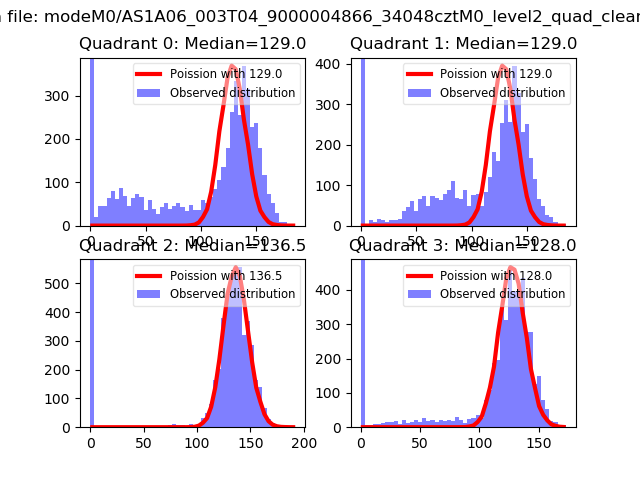 |
 |
| Quadrant-wise count rates Data is divided into 100 sec bins |
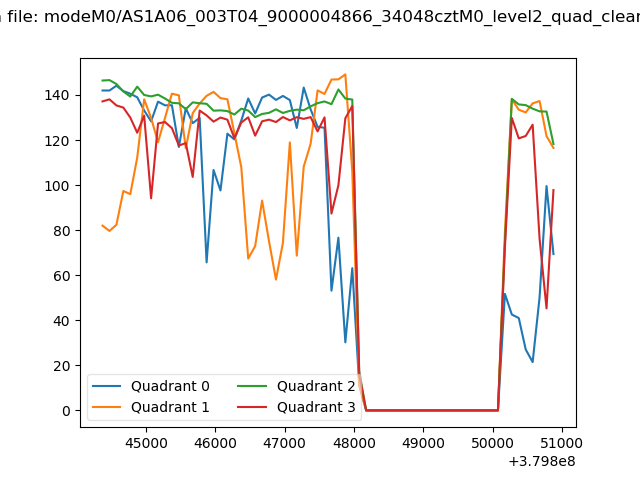 |
|
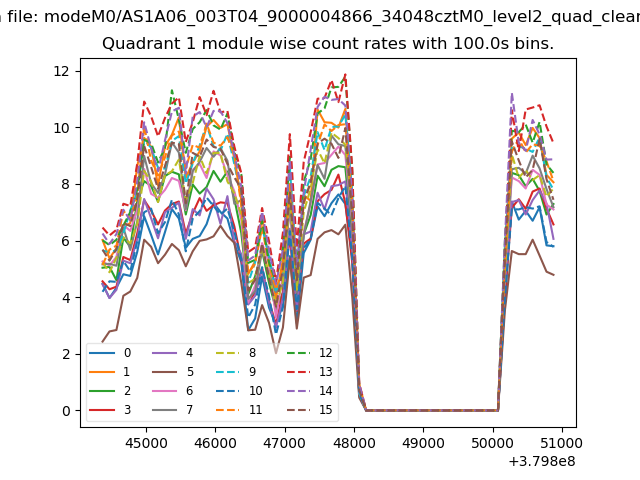
| Module-wise count rates for Quadrant A Data is divided into 100 sec bins |
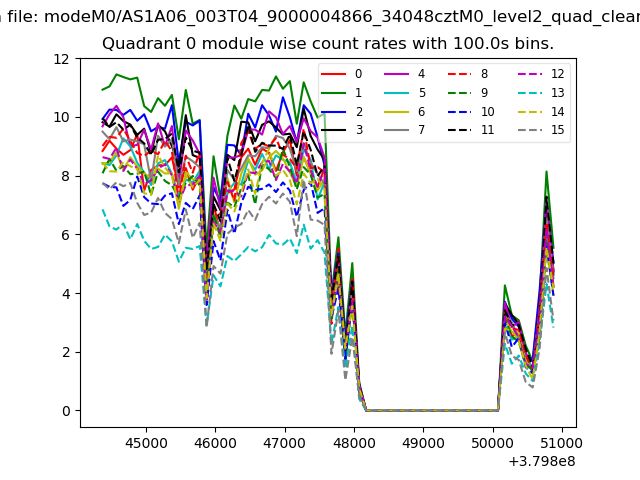 |
 |
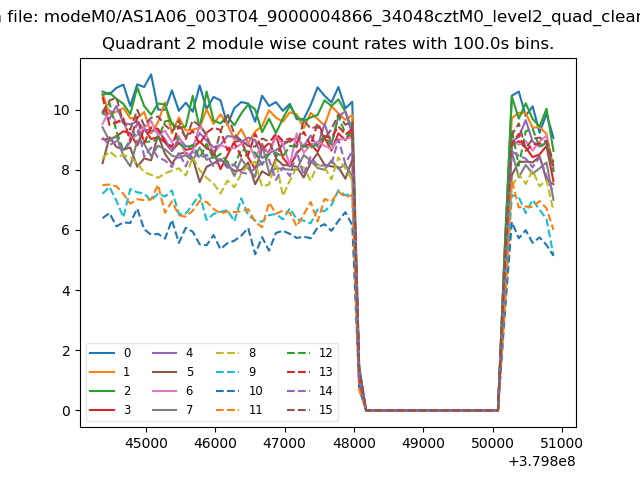
| Module-wise count rates for Quadrant B Data is divided into 100 sec bins |
 |
 |
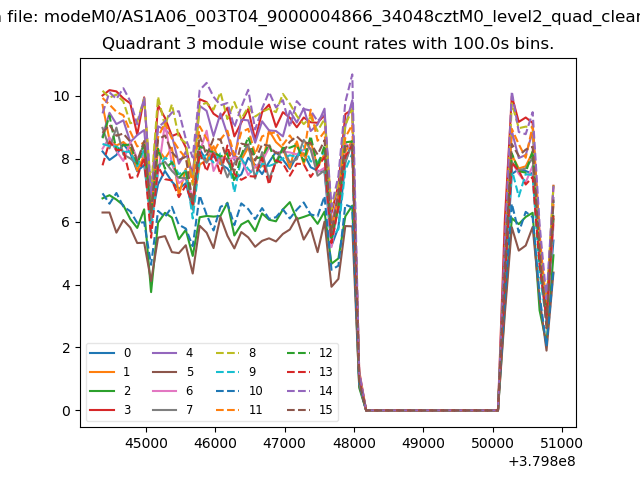
| Module-wise count rates for Quadrant C Data is divided into 100 sec bins |
 |
 |
| Module-wise count rates for Quadrant D Data is divided into 100 sec bins |
 |
 |
| Parameter | Plot |
|---|---|
| CZT HV Monitor | 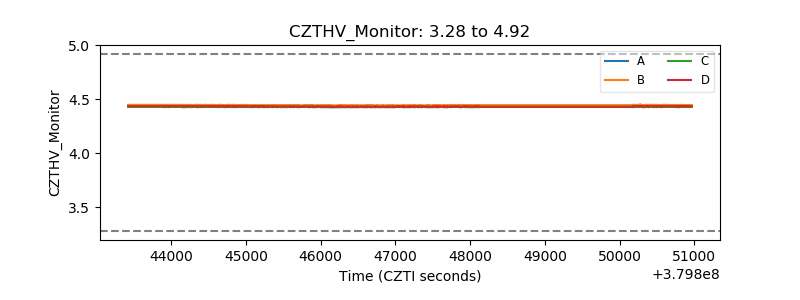 |
| D_VDD | 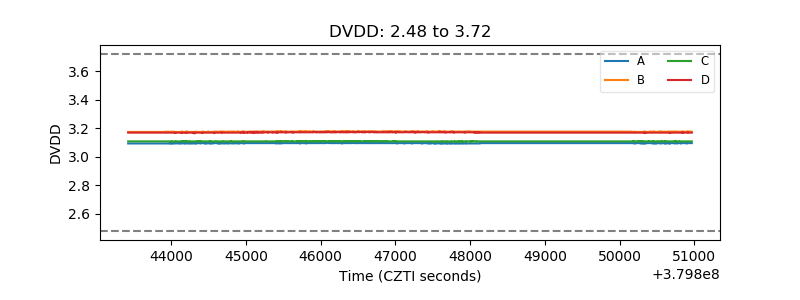 |
| Temperature 1 | 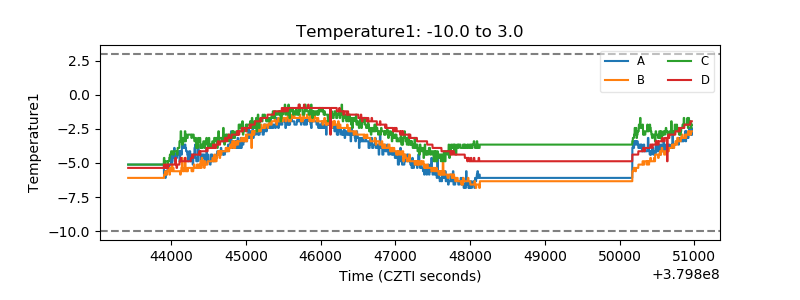 |
| Veto HV Monitor |  |
| Veto LLD | 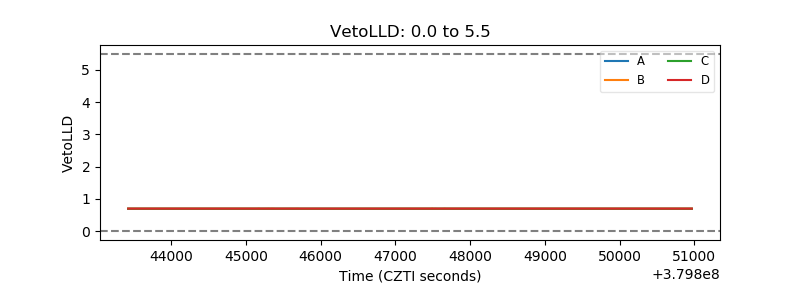 |
| Alpha Counter | 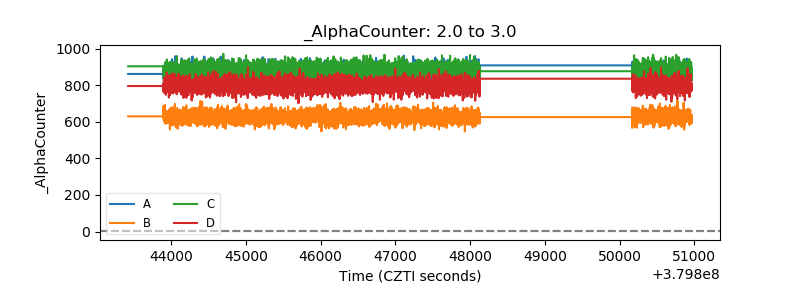 |
| _CPM_Rate | 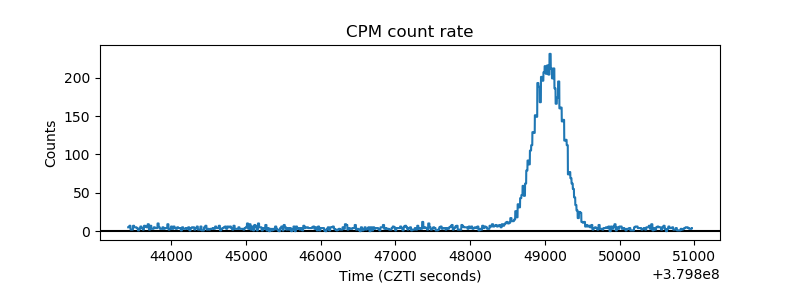 |
| CZT Counter | 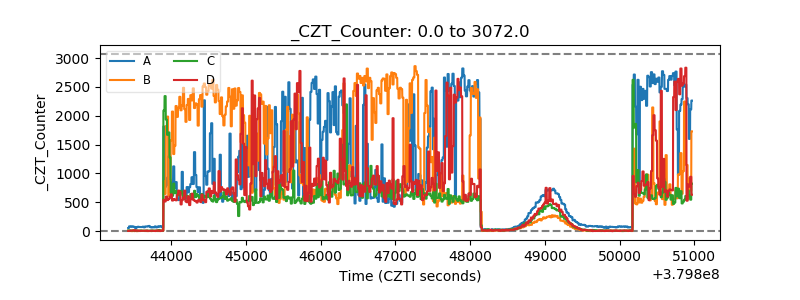 |
| +2.5 Volts monitor |  |
| +5 Volts monitor |  |
| _ROLL_ROT | 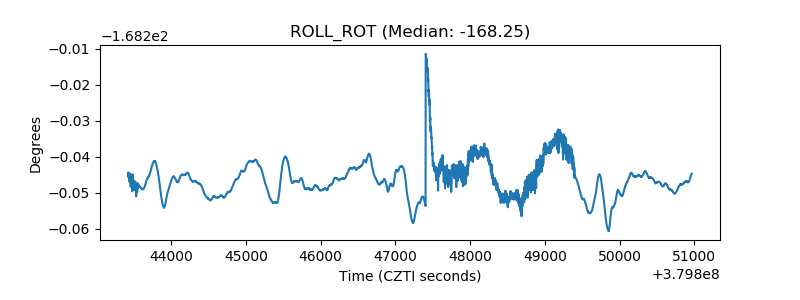 |
| _Roll_DEC | 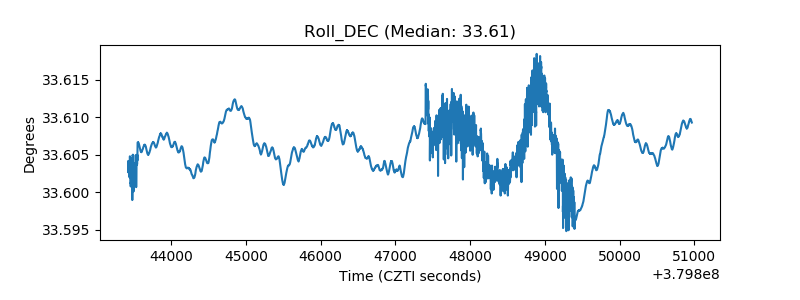 |
| _Roll_RA |  |
| Veto Counter | 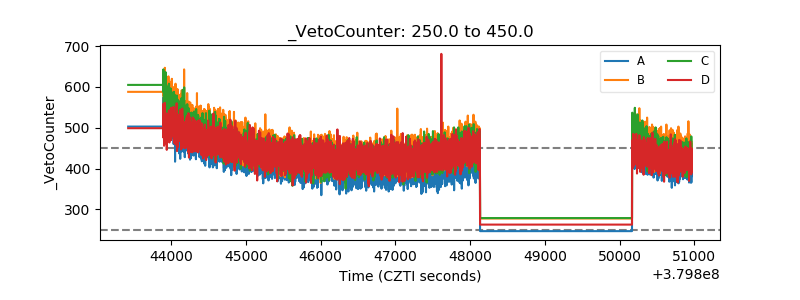 |