| Param | Original file | Final file |
|---|---|---|
| Filename | modeM0/AS1A06_003T04_9000004866_34049cztM0_level2.evt | modeM0/AS1A06_003T04_9000004866_34049cztM0_level2_quad_clean.evt |
| Size (bytes) | 1,094,760,000 | 72,400,320 |
| Size | 1.0 GB | 69.0 MB |
| Events in quadrant A | 12,211,964 | 241,642 |
| Events in quadrant B | 9,323,598 | 503,201 |
| Events in quadrant C | 4,648,919 | 574,981 |
| Events in quadrant D | 6,611,863 | 493,675 |
| Mode M9 | |||
|---|---|---|---|
| Quadrant | BADHDUFLAG | Total packets | Discarded packets |
| A | 0 | 18 | 0 |
| B | 0 | 18 | 0 |
| C | 0 | 18 | 0 |
| D | 0 | 18 | 0 |
| Mode M0 | |||
|---|---|---|---|
| Quadrant | BADHDUFLAG | Total packets | Discarded packets |
| A | 0 | 39922 | 3 |
| B | 0 | 31297 | 2 |
| C | 0 | 17722 | 2 |
| D | 0 | 23436 | 2 |
| Mode SS | |||
|---|---|---|---|
| Quadrant | BADHDUFLAG | Total packets | Discarded packets |
| A | 0 | 108 | 0 |
| B | 0 | 108 | 0 |
| C | 0 | 108 | 0 |
| D | 0 | 108 | 0 |
| Quadrant | Total seconds | Saturated seconds | Saturation percentage |
|---|---|---|---|
| A | 5369 | 4634 | 86.310300% |
| B | 5369 | 2734 | 50.921959% |
| C | 5369 | 234 | 4.358354% |
| D | 5369 | 1100 | 20.487987% |
Noise dominated data is calculated using 1-second bins in cleaned event files. If a bin has >2000 counts, and if more than 50% of those come from <1% of pixels, then it is considered to be noise-dominated and hence unusable.
| Quadrant | # 1 sec bins | Bins with >0 counts | Bins with >2000 counts | High rate bins dominated by noise | Noise dominated (total time) | Noise dominated (detector-on time) | Marked lightcurve |
|---|---|---|---|---|---|---|---|
| A | 7102 | 5369 | 4469 | 4469 | 62.93% | 83.24% | 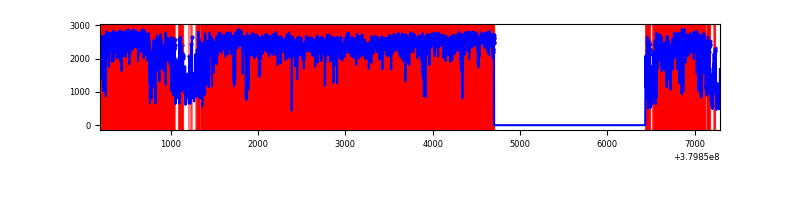 |
| B | 7101 | 5368 | 2604 | 2604 | 36.67% | 48.51% | 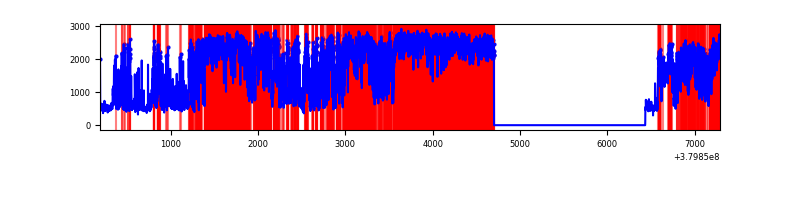 |
| C | 7102 | 5370 | 216 | 216 | 3.04% | 4.02% | 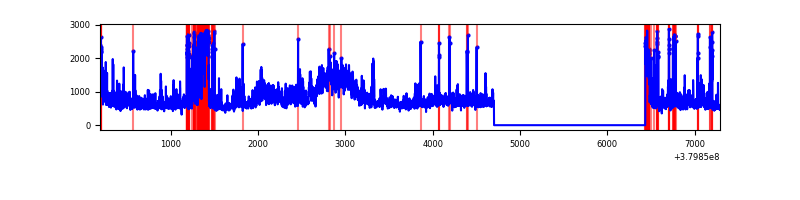 |
| D | 7102 | 5370 | 1112 | 1112 | 15.66% | 20.71% | 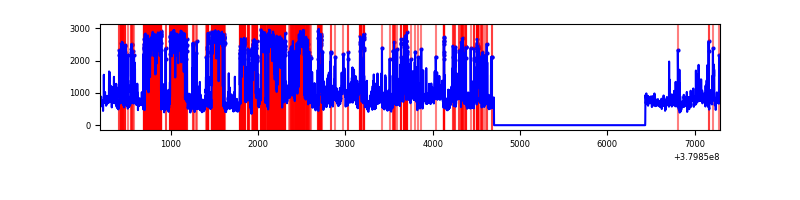 |
Top three noisy pixels from each quadrant. If the there are fewer than three noisy pixels in the level2.evt file, extra rows are filled as -1
| Pixel properties | Quadrant properties | ||||||
|---|---|---|---|---|---|---|---|
| Quadrant | DetID | PixID | Counts | Sigma | Mean | Median | Sigma |
| A | 15 | 169 | 11140713 | 200235.91 | 273 | 268 | 55.6 |
| A | 10 | 83 | 10789 | 189.1 | 273 | 268 | 55.6 |
| A | 13 | 254 | 4087 | 68.64 | 273 | 268 | 55.6 |
| B | 5 | 31 | 3989409 | 40293.38 | 520 | 509 | 99.0 |
| B | 5 | 15 | 2030162 | 20502.29 | 520 | 509 | 99.0 |
| B | 5 | 172 | 574972 | 5802.87 | 520 | 509 | 99.0 |
| C | 0 | 10 | 892552 | 6375.67 | 603 | 608 | 139.9 |
| C | 3 | 233 | 542134 | 3870.86 | 603 | 608 | 139.9 |
| C | 0 | 207 | 538366 | 3843.93 | 603 | 608 | 139.9 |
| D | 8 | 230 | 1424457 | 10341.39 | 560 | 544 | 137.7 |
| D | 2 | 249 | 1237180 | 8981.26 | 560 | 544 | 137.7 |
| D | 8 | 195 | 734113 | 5327.66 | 560 | 544 | 137.7 |
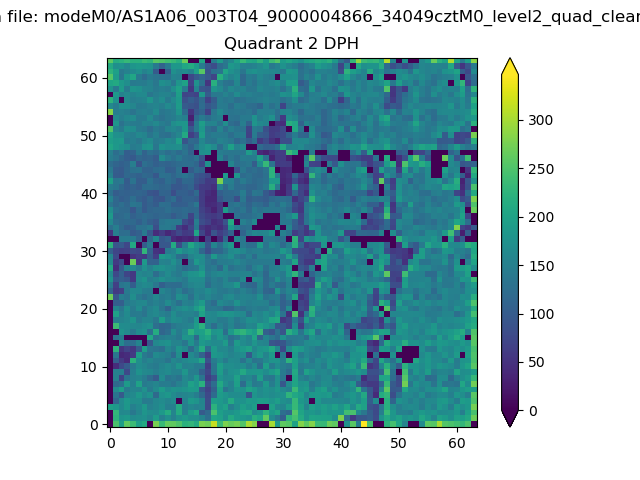
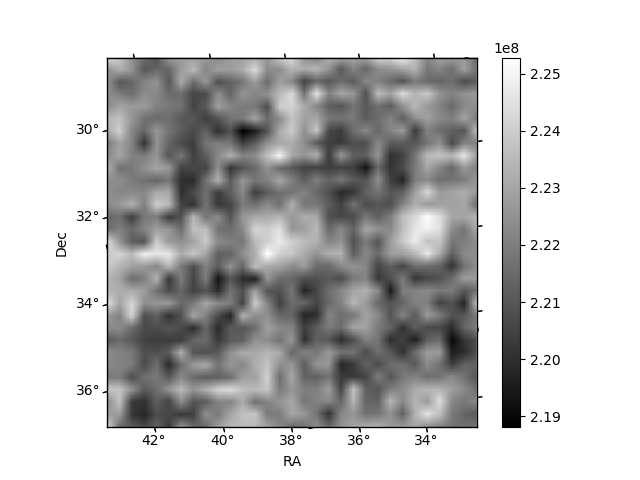
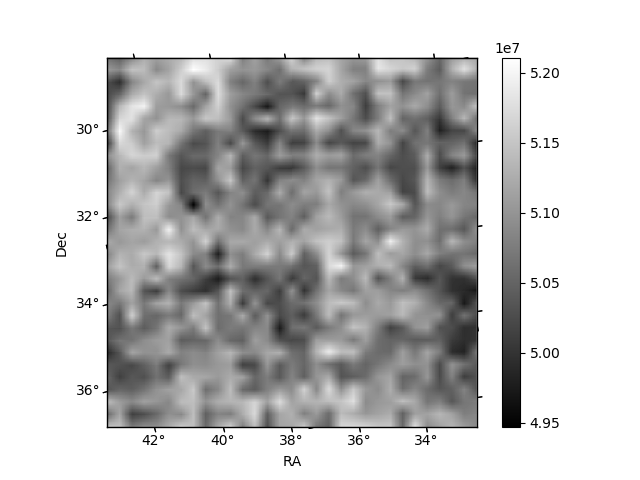
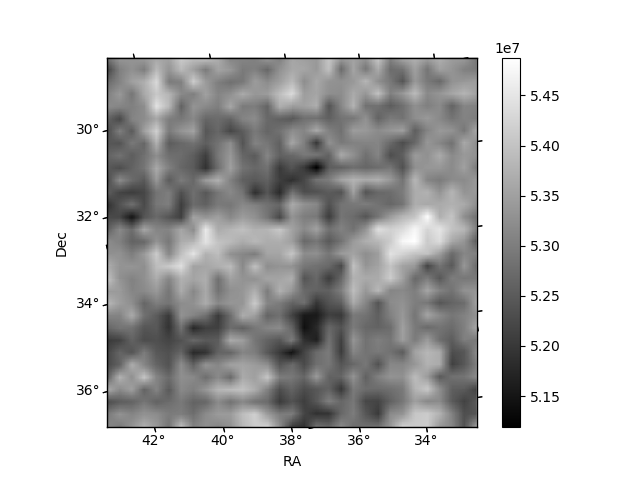
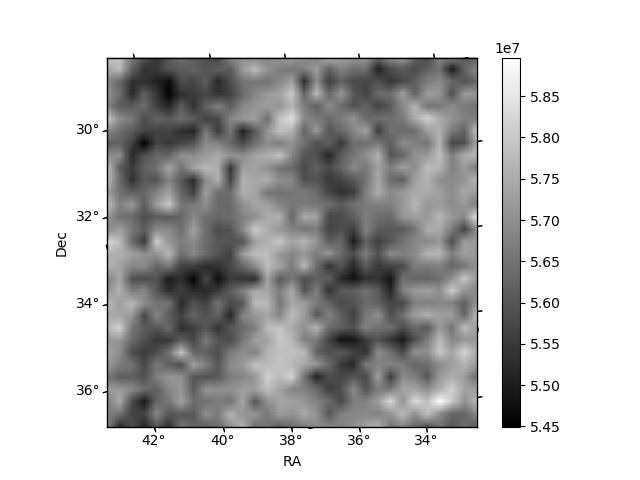
Histogram calculated using DETX and DETY for each event in the final _common_clean file
| Quadrant A | 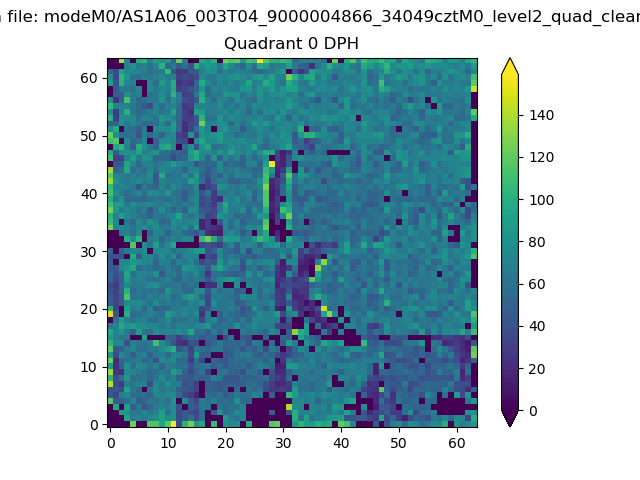 |
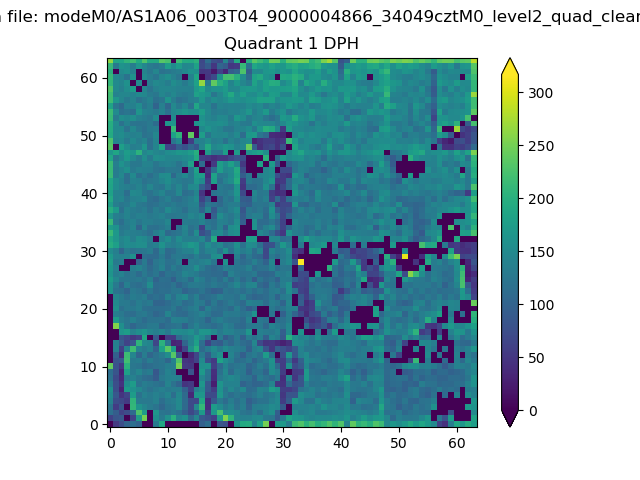 |
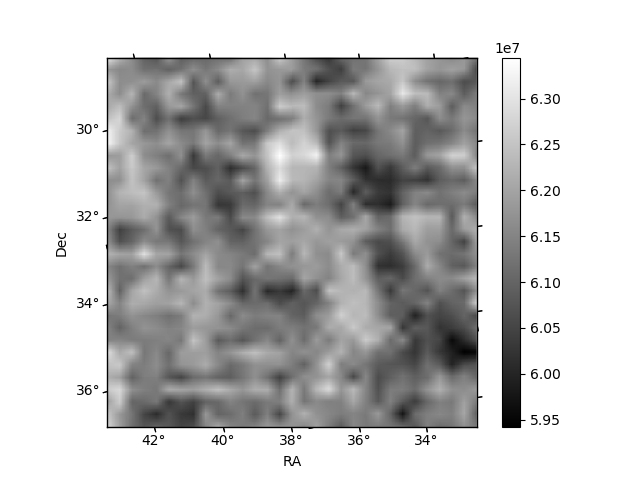
Quadrant B |
|---|---|---|---|
| Quadrant D | 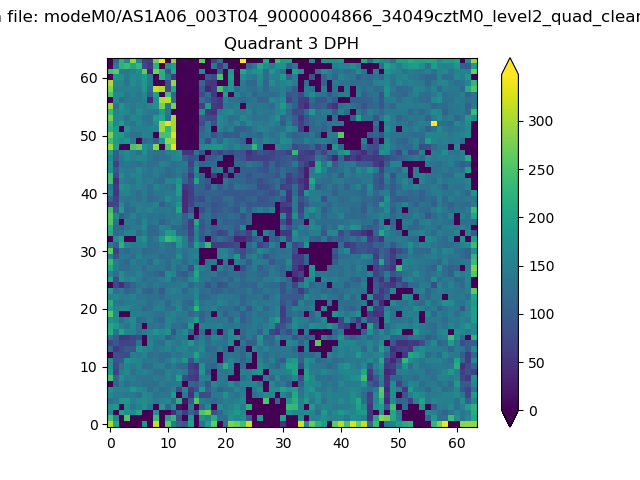 |
 |
Quadrant C |
| Plot type | Count rate plots | Images |
|---|---|---|
| Comparison with Poisson distribution Blue bars denote a histogram of data divided into 1 sec bins. Red curve is a Poisson curve with rate = median count rate of data. |
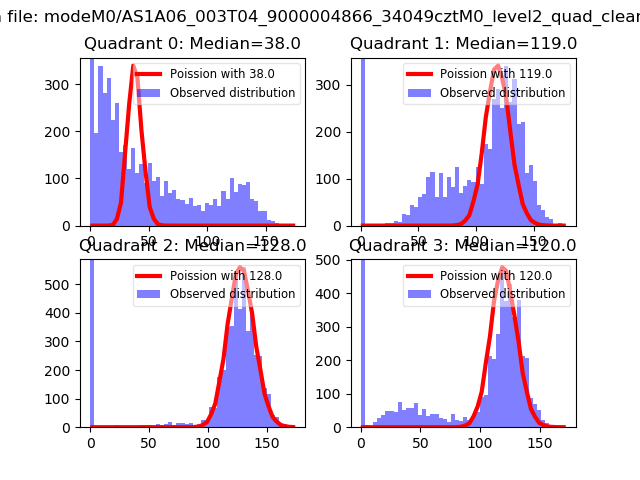 |
 |
| Quadrant-wise count rates Data is divided into 100 sec bins |
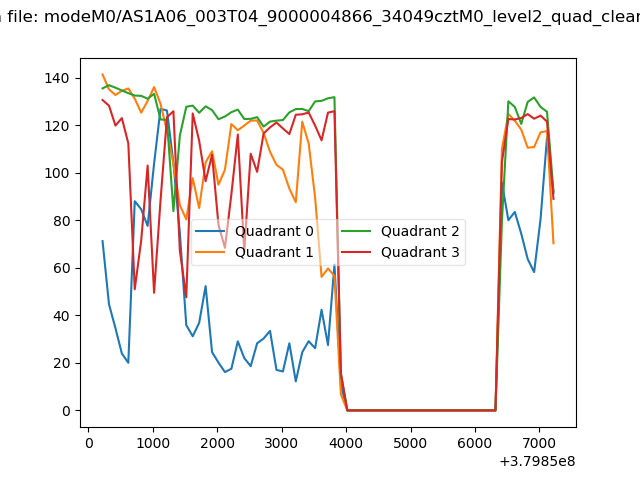 |
|
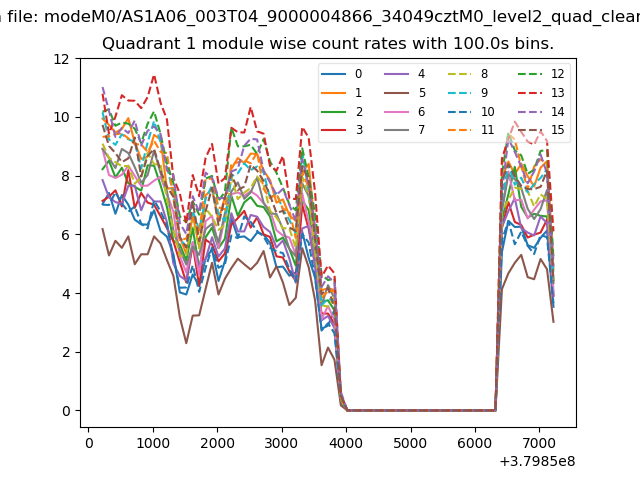
| Module-wise count rates for Quadrant A Data is divided into 100 sec bins |
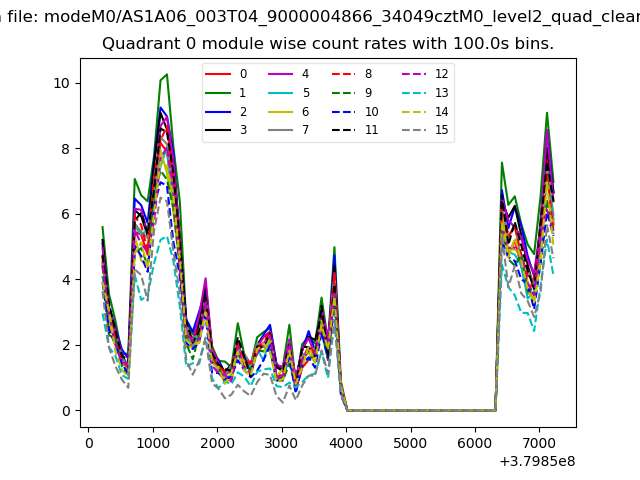 |
 |
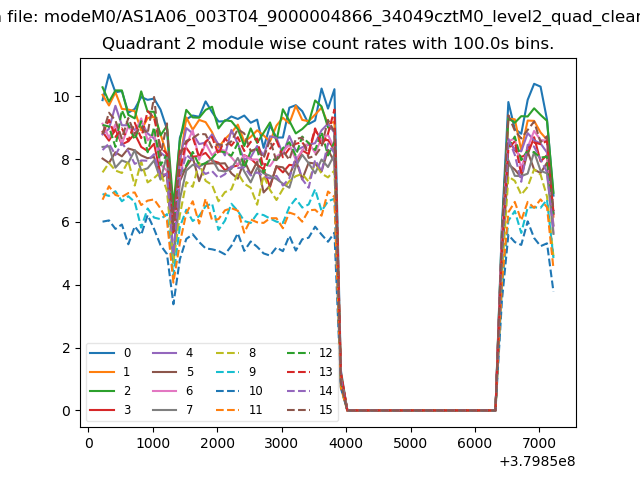
| Module-wise count rates for Quadrant B Data is divided into 100 sec bins |
 |
 |
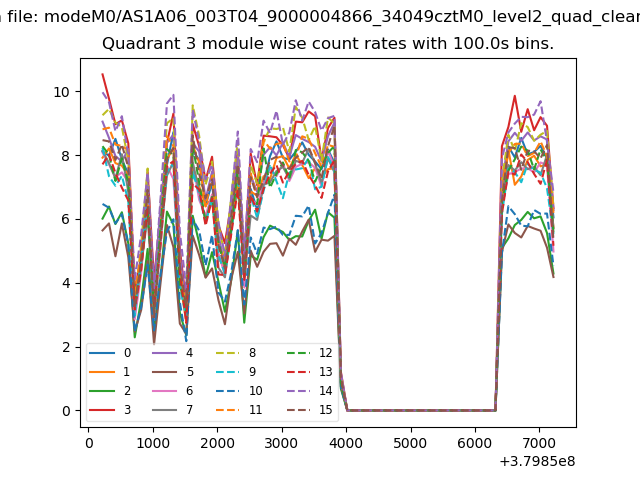
| Module-wise count rates for Quadrant C Data is divided into 100 sec bins |
 |
 |
| Module-wise count rates for Quadrant D Data is divided into 100 sec bins |
 |
 |
| Parameter | Plot |
|---|---|
| CZT HV Monitor | 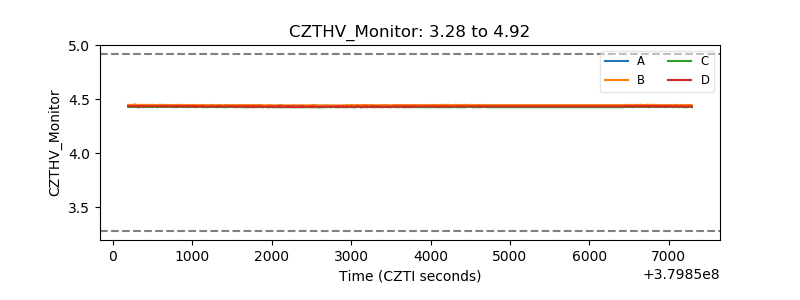 |
| D_VDD | 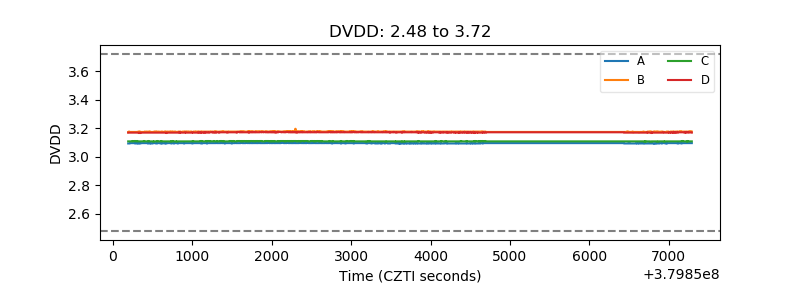 |
| Temperature 1 | 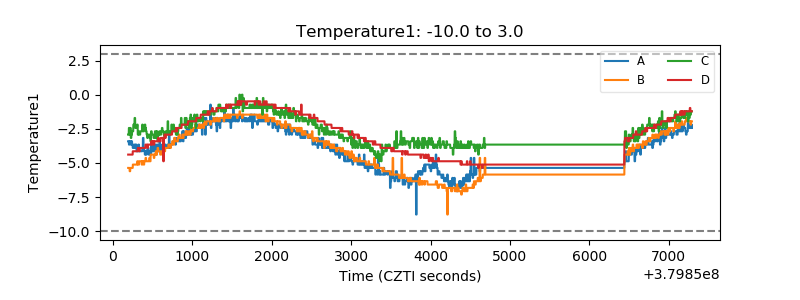 |
| Veto HV Monitor | 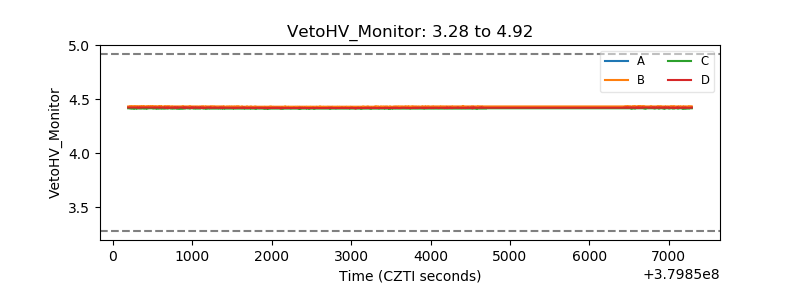 |
| Veto LLD | 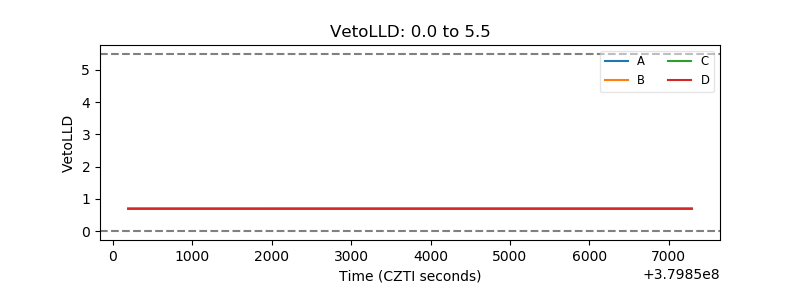 |
| Alpha Counter | 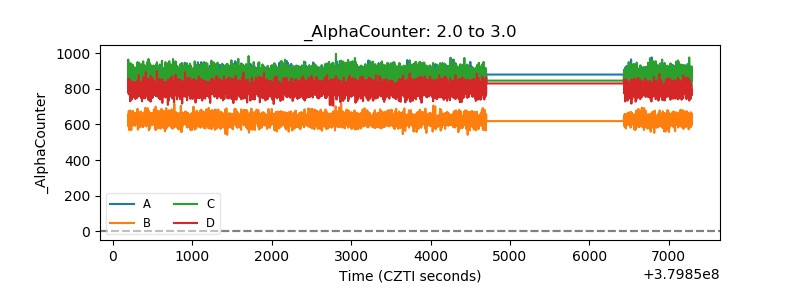 |
| _CPM_Rate | 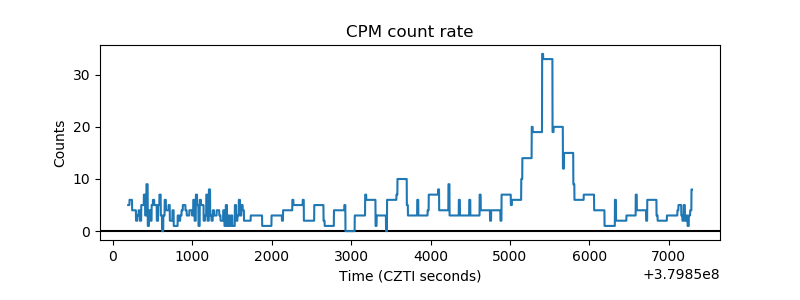 |
| CZT Counter |  |
| +2.5 Volts monitor |  |
| +5 Volts monitor |  |
| _ROLL_ROT | 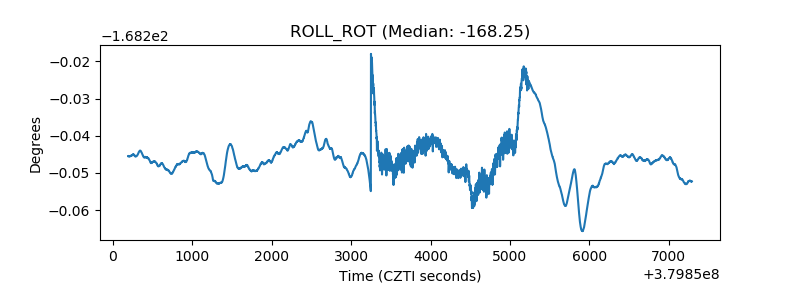 |
| _Roll_DEC | 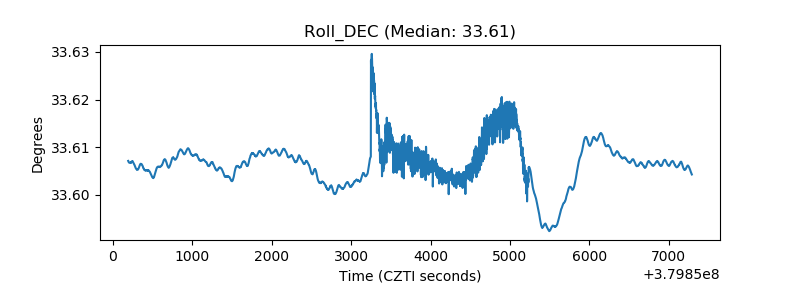 |
| _Roll_RA | 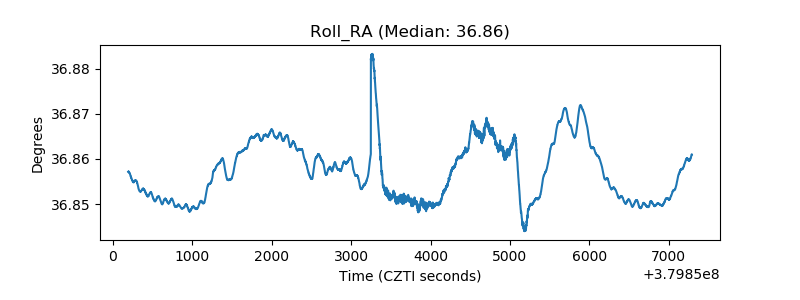 |
| Veto Counter | 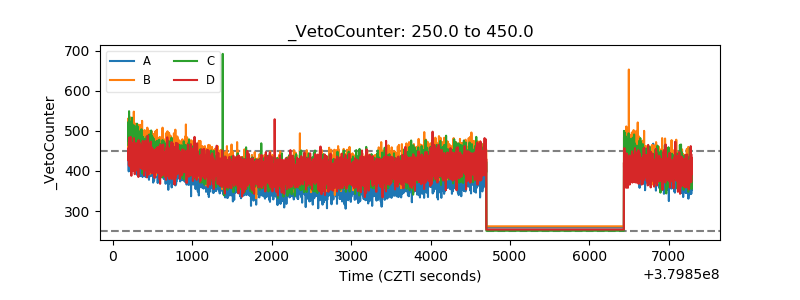 |