| Param | Original file | Final file |
|---|---|---|
| Filename | modeM0/AS1A06_003T04_9000004866_34050cztM0_level2.evt | modeM0/AS1A06_003T04_9000004866_34050cztM0_level2_quad_clean.evt |
| Size (bytes) | 1,093,893,120 | 71,040,960 |
| Size | 1.0 GB | 67.7 MB |
| Events in quadrant A | 11,166,842 | 338,398 |
| Events in quadrant B | 11,471,404 | 406,138 |
| Events in quadrant C | 5,028,970 | 504,070 |
| Events in quadrant D | 5,078,786 | 500,048 |
| Mode M9 | |||
|---|---|---|---|
| Quadrant | BADHDUFLAG | Total packets | Discarded packets |
| A | 0 | 14 | 0 |
| B | 0 | 14 | 0 |
| C | 0 | 14 | 0 |
| D | 0 | 14 | 0 |
| Mode M0 | |||
|---|---|---|---|
| Quadrant | BADHDUFLAG | Total packets | Discarded packets |
| A | 0 | 37071 | 3 |
| B | 0 | 37990 | 2 |
| C | 0 | 18953 | 2 |
| D | 0 | 19028 | 2 |
| Mode SS | |||
|---|---|---|---|
| Quadrant | BADHDUFLAG | Total packets | Discarded packets |
| A | 0 | 116 | 0 |
| B | 0 | 116 | 0 |
| C | 0 | 116 | 0 |
| D | 0 | 116 | 0 |
| Quadrant | Total seconds | Saturated seconds | Saturation percentage |
|---|---|---|---|
| A | 5717 | 3564 | 62.340388% |
| B | 5717 | 3876 | 67.797796% |
| C | 5717 | 365 | 6.384467% |
| D | 5718 | 371 | 6.488283% |
Noise dominated data is calculated using 1-second bins in cleaned event files. If a bin has >2000 counts, and if more than 50% of those come from <1% of pixels, then it is considered to be noise-dominated and hence unusable.
| Quadrant | # 1 sec bins | Bins with >0 counts | Bins with >2000 counts | High rate bins dominated by noise | Noise dominated (total time) | Noise dominated (detector-on time) | Marked lightcurve |
|---|---|---|---|---|---|---|---|
| A | 7149 | 5718 | 3414 | 3414 | 47.75% | 59.71% | 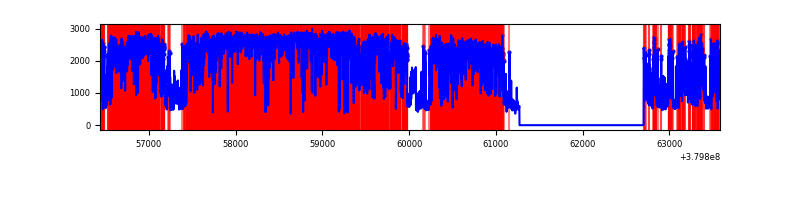 |
| B | 7148 | 5716 | 3525 | 3525 | 49.31% | 61.67% | 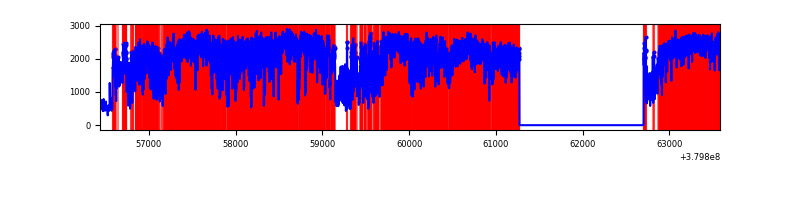 |
| C | 7149 | 5718 | 380 | 380 | 5.32% | 6.65% | 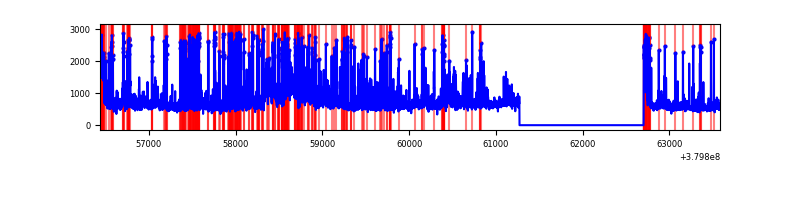 |
| D | 7150 | 5719 | 351 | 351 | 4.91% | 6.14% | 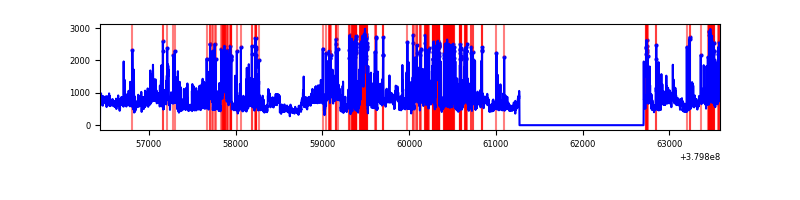 |
Top three noisy pixels from each quadrant. If the there are fewer than three noisy pixels in the level2.evt file, extra rows are filled as -1
| Pixel properties | Quadrant properties | ||||||
|---|---|---|---|---|---|---|---|
| Quadrant | DetID | PixID | Counts | Sigma | Mean | Median | Sigma |
| A | 15 | 169 | 9283651 | 95501.33 | 480 | 470 | 97.2 |
| A | 10 | 83 | 16676 | 166.72 | 480 | 470 | 97.2 |
| A | 7 | 16 | 8762 | 85.3 | 480 | 470 | 97.2 |
| B | 5 | 31 | 5312848 | 53547.56 | 519 | 506 | 99.2 |
| B | 5 | 15 | 2503269 | 25227.45 | 519 | 506 | 99.2 |
| B | 5 | 172 | 1040174 | 10479.69 | 519 | 506 | 99.2 |
| C | 0 | 10 | 1873428 | 12870.63 | 629 | 634 | 145.5 |
| C | 3 | 233 | 283360 | 1943.01 | 629 | 634 | 145.5 |
| C | 15 | 214 | 263357 | 1805.54 | 629 | 634 | 145.5 |
| D | 8 | 195 | 934975 | 6013.74 | 637 | 619 | 155.4 |
| D | 13 | 249 | 588475 | 3783.59 | 637 | 619 | 155.4 |
| D | 2 | 250 | 304539 | 1956.1 | 637 | 619 | 155.4 |
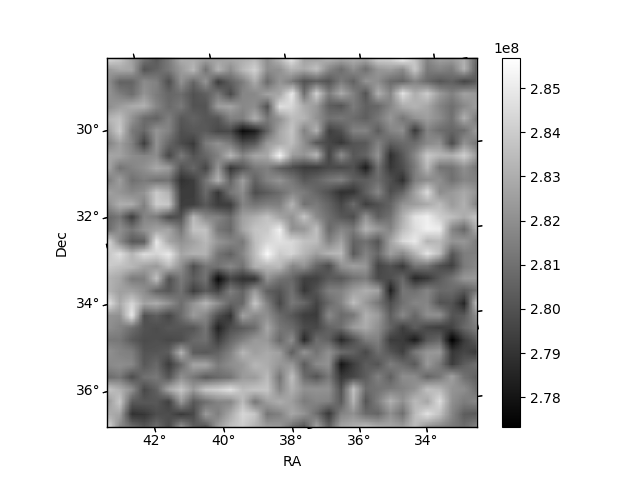
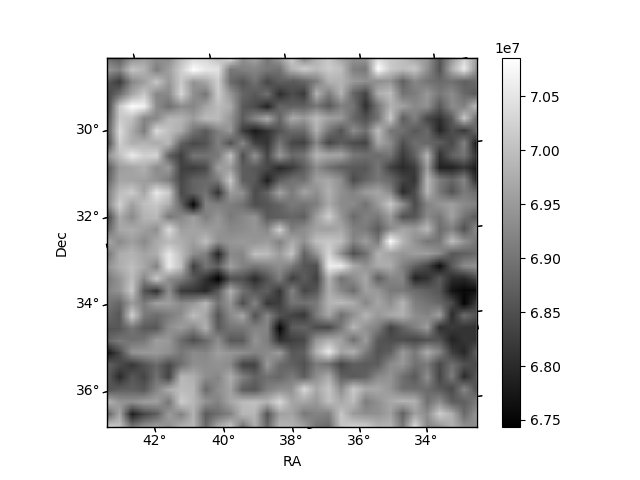
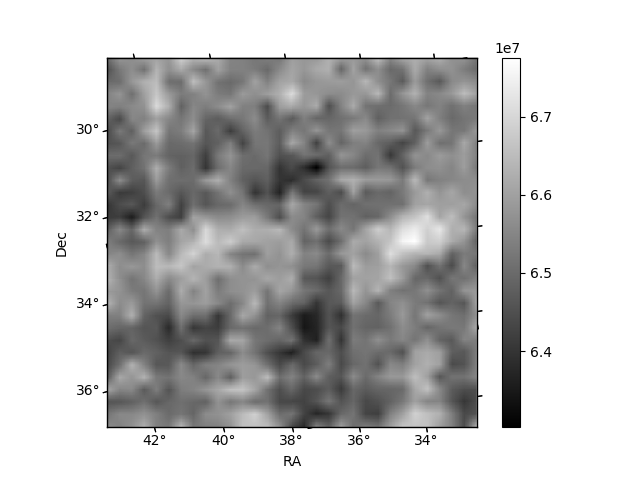
Histogram calculated using DETX and DETY for each event in the final _common_clean file
| Quadrant A | 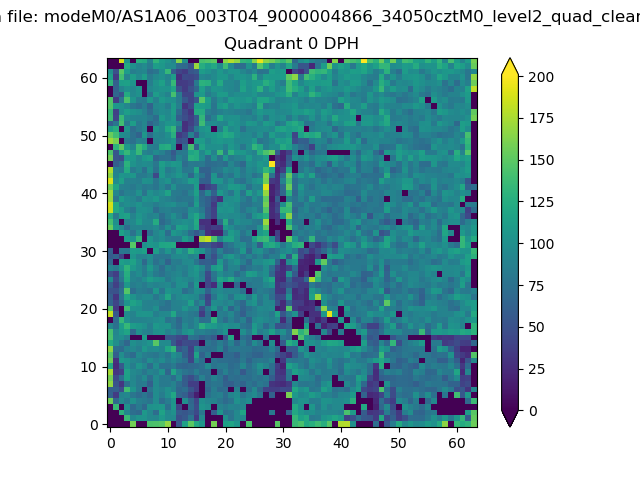 |
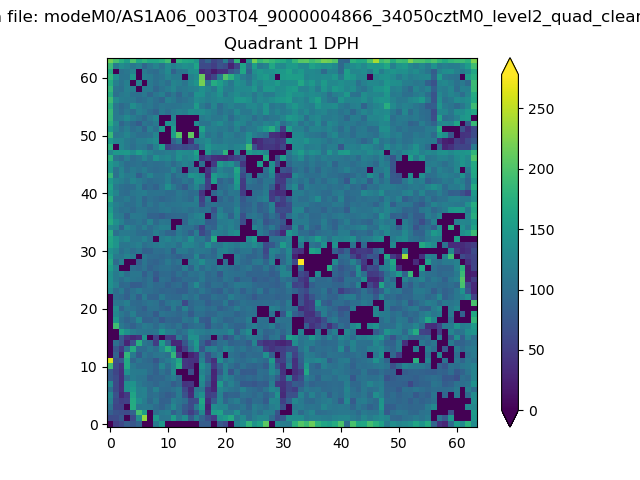 |
Quadrant B |
|---|---|---|---|
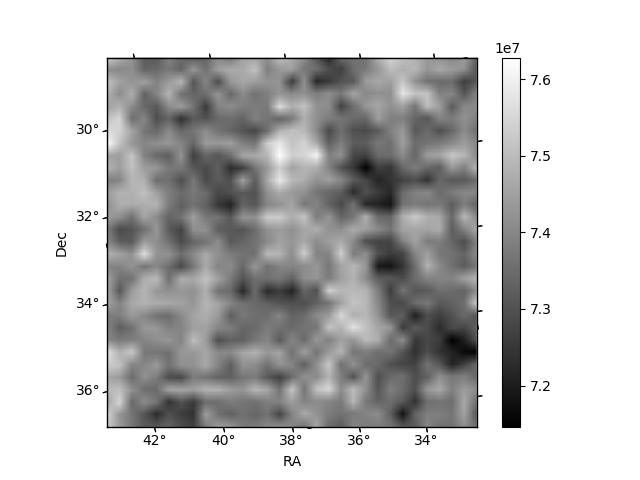
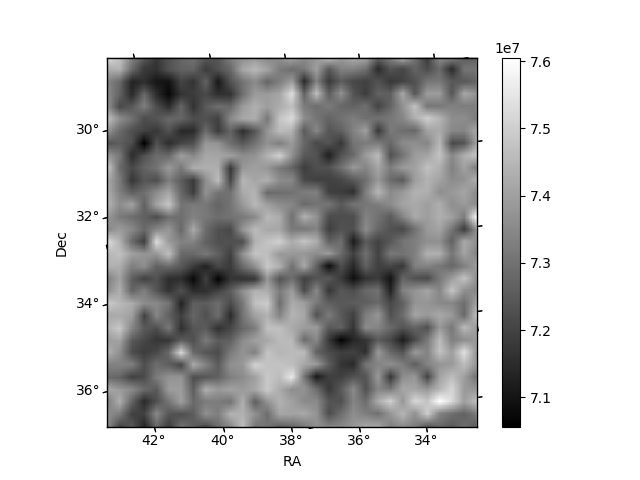
| Quadrant D | 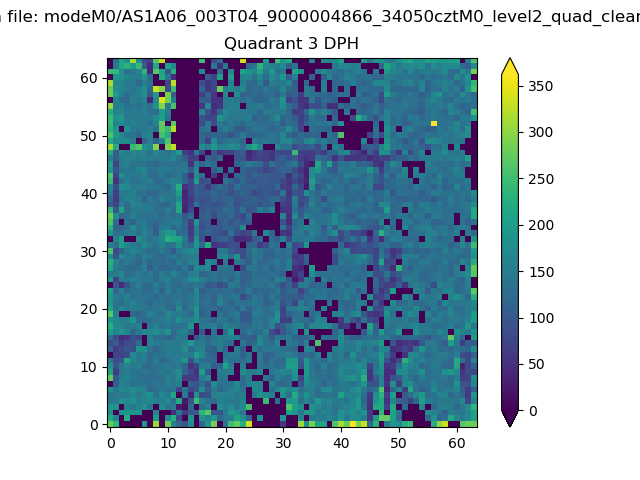 |
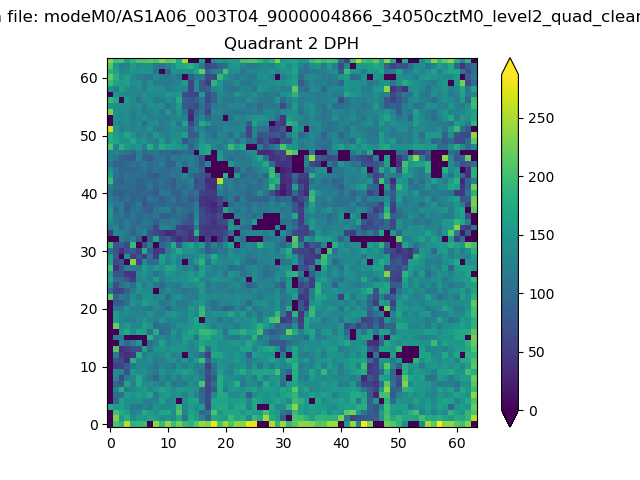 |
Quadrant C |
| Plot type | Count rate plots | Images |
|---|---|---|
| Comparison with Poisson distribution Blue bars denote a histogram of data divided into 1 sec bins. Red curve is a Poisson curve with rate = median count rate of data. |
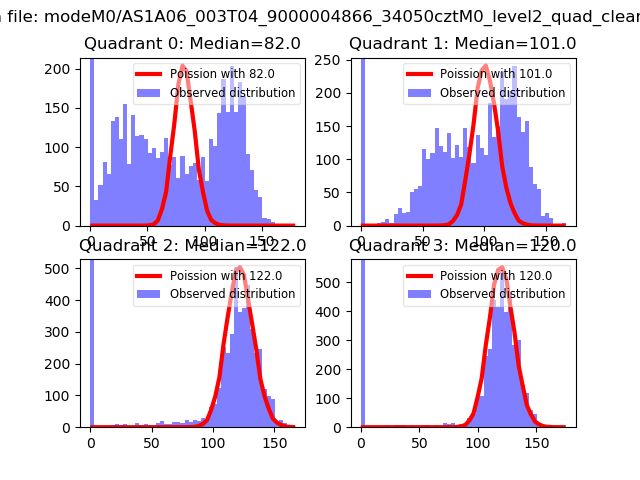 |
 |
| Quadrant-wise count rates Data is divided into 100 sec bins |
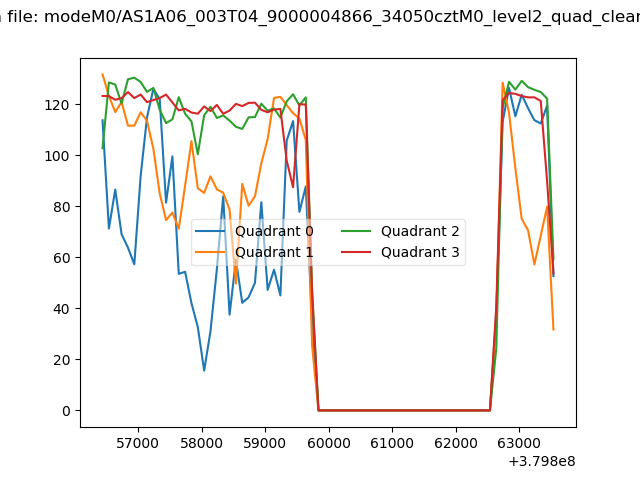 |
|
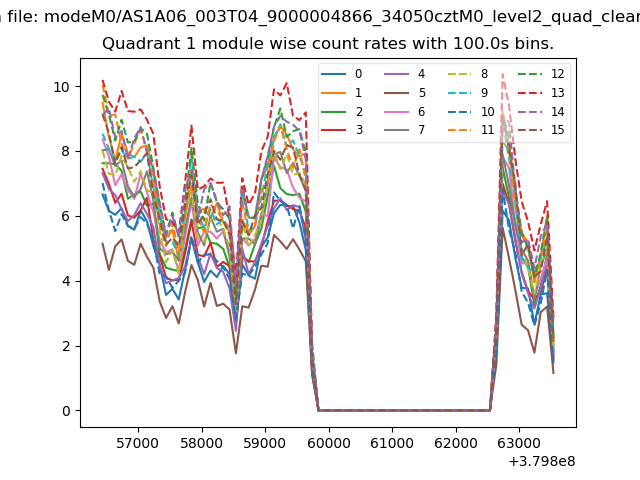
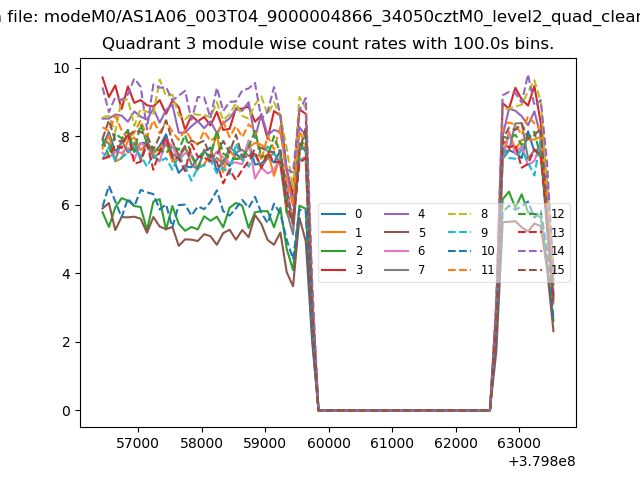
| Module-wise count rates for Quadrant A Data is divided into 100 sec bins |
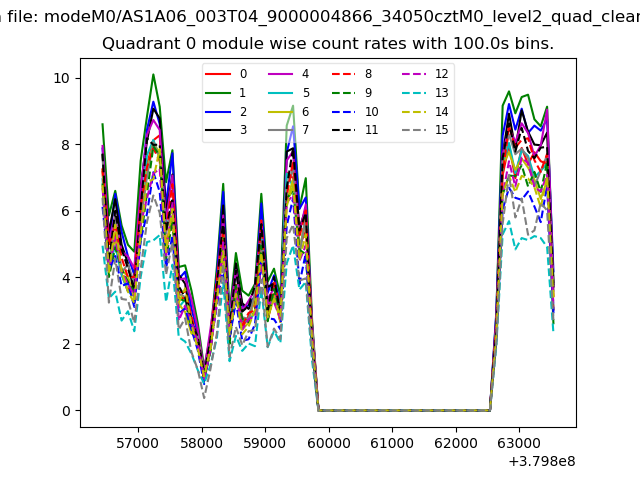 |
 |
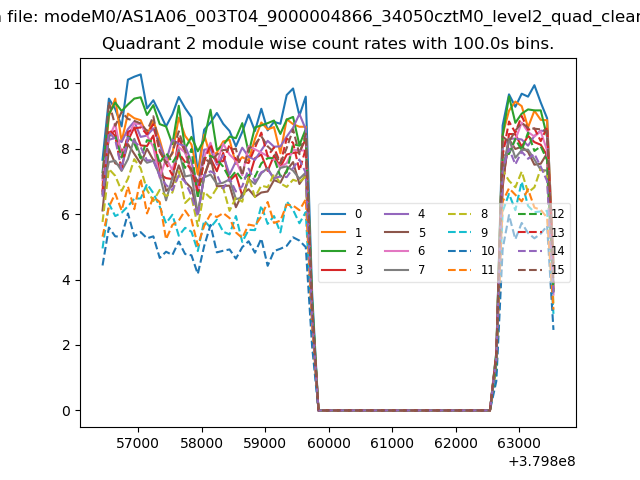
| Module-wise count rates for Quadrant B Data is divided into 100 sec bins |
 |
 |
| Module-wise count rates for Quadrant C Data is divided into 100 sec bins |
 |
 |
| Module-wise count rates for Quadrant D Data is divided into 100 sec bins |
 |
 |
| Parameter | Plot |
|---|---|
| CZT HV Monitor |  |
| D_VDD | 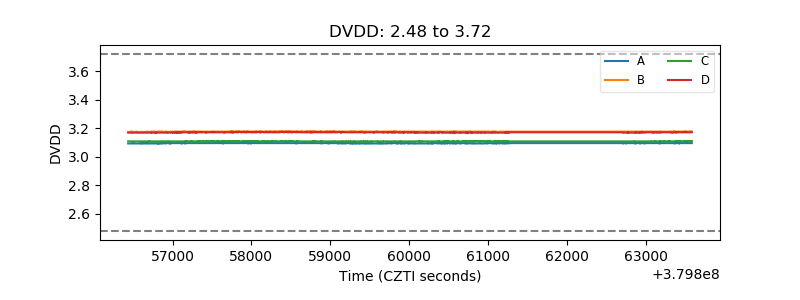 |
| Temperature 1 | 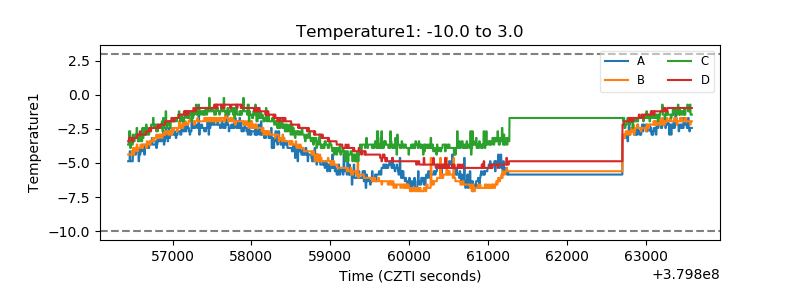 |
| Veto HV Monitor | 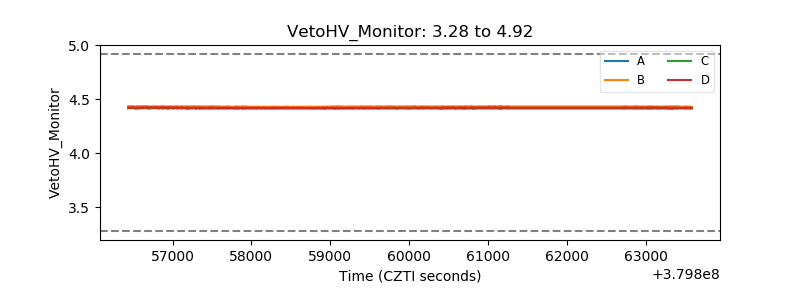 |
| Veto LLD | 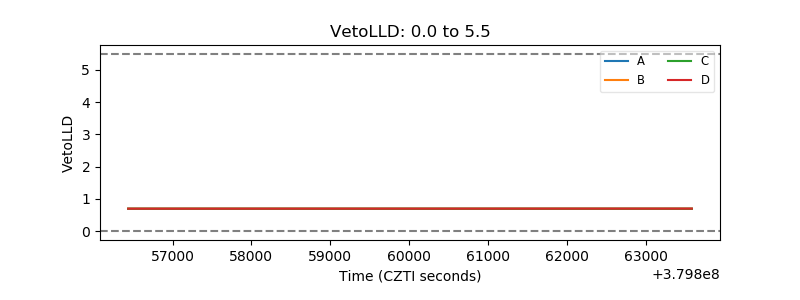 |
| Alpha Counter | 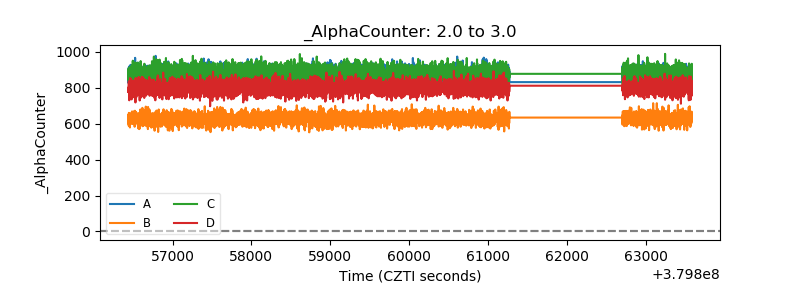 |
| _CPM_Rate | 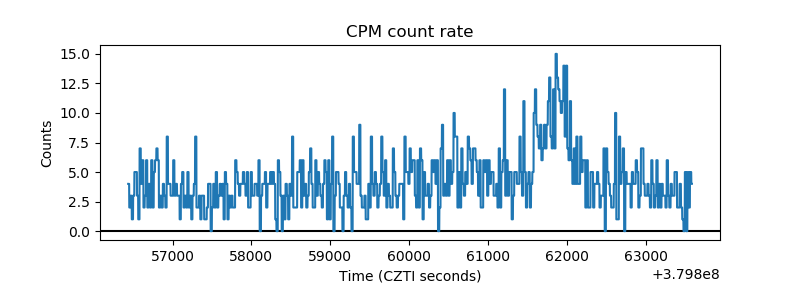 |
| CZT Counter | 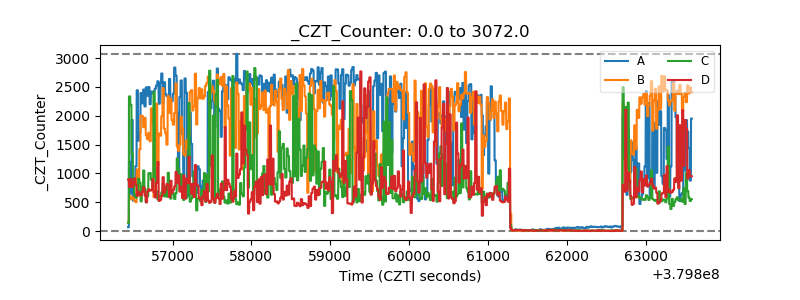 |
| +2.5 Volts monitor |  |
| +5 Volts monitor |  |
| _ROLL_ROT | 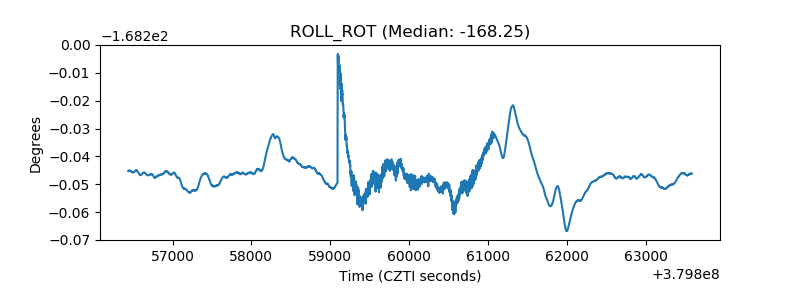 |
| _Roll_DEC | 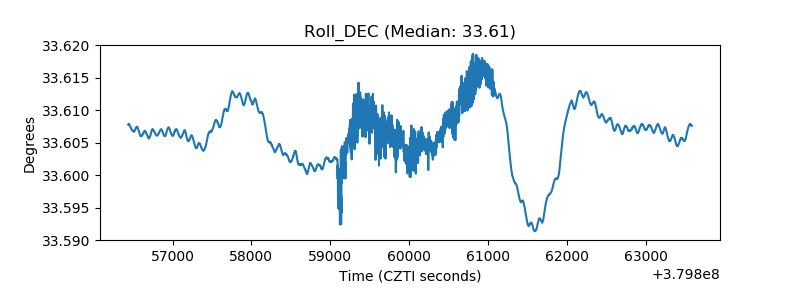 |
| _Roll_RA | 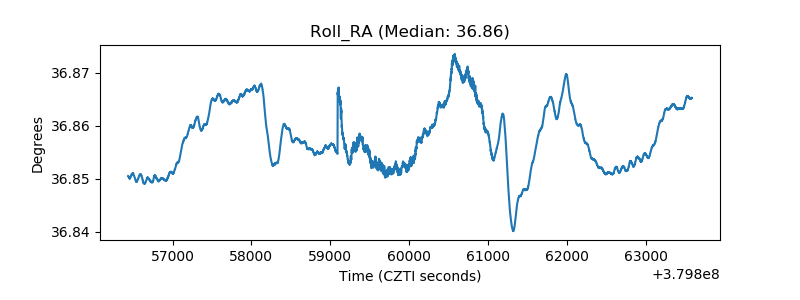 |
| Veto Counter | 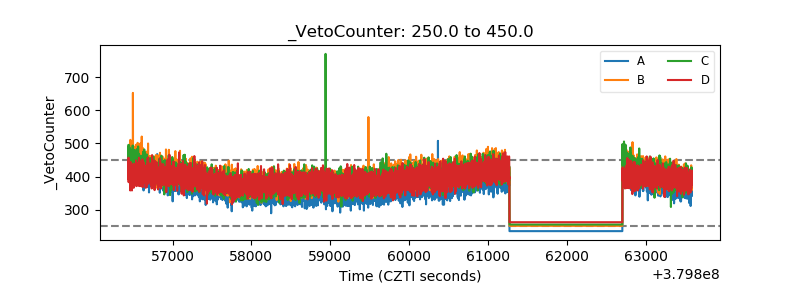 |