| Param | Original file | Final file |
|---|---|---|
| Filename | modeM0/AS1A06_003T04_9000004866_34051cztM0_level2.evt | modeM0/AS1A06_003T04_9000004866_34051cztM0_level2_quad_clean.evt |
| Size (bytes) | 980,164,800 | 67,366,080 |
| Size | 934.8 MB | 64.2 MB |
| Events in quadrant A | 9,130,150 | 383,278 |
| Events in quadrant B | 11,478,315 | 338,332 |
| Events in quadrant C | 3,868,277 | 460,189 |
| Events in quadrant D | 4,814,663 | 447,077 |
| Mode M9 | |||
|---|---|---|---|
| Quadrant | BADHDUFLAG | Total packets | Discarded packets |
| A | 0 | 13 | 0 |
| B | 0 | 13 | 0 |
| C | 0 | 13 | 0 |
| D | 0 | 14 | 0 |
| Mode M0 | |||
|---|---|---|---|
| Quadrant | BADHDUFLAG | Total packets | Discarded packets |
| A | 0 | 31181 | 3 |
| B | 0 | 38135 | 2 |
| C | 0 | 15202 | 2 |
| D | 0 | 18418 | 2 |
| Mode SS | |||
|---|---|---|---|
| Quadrant | BADHDUFLAG | Total packets | Discarded packets |
| A | 0 | 120 | 0 |
| B | 0 | 120 | 0 |
| C | 0 | 120 | 0 |
| D | 0 | 120 | 0 |
| Quadrant | Total seconds | Saturated seconds | Saturation percentage |
|---|---|---|---|
| A | 5847 | 2301 | 39.353515% |
| B | 5847 | 3856 | 65.948350% |
| C | 5847 | 152 | 2.599624% |
| D | 5847 | 232 | 3.967847% |
Noise dominated data is calculated using 1-second bins in cleaned event files. If a bin has >2000 counts, and if more than 50% of those come from <1% of pixels, then it is considered to be noise-dominated and hence unusable.
| Quadrant | # 1 sec bins | Bins with >0 counts | Bins with >2000 counts | High rate bins dominated by noise | Noise dominated (total time) | Noise dominated (detector-on time) | Marked lightcurve |
|---|---|---|---|---|---|---|---|
| A | 7159 | 5846 | 2239 | 2239 | 31.28% | 38.30% | 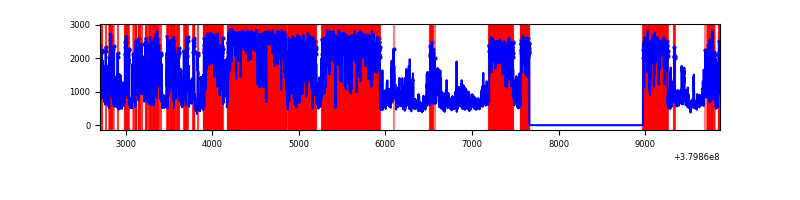 |
| B | 7159 | 5847 | 3409 | 3409 | 47.62% | 58.30% | 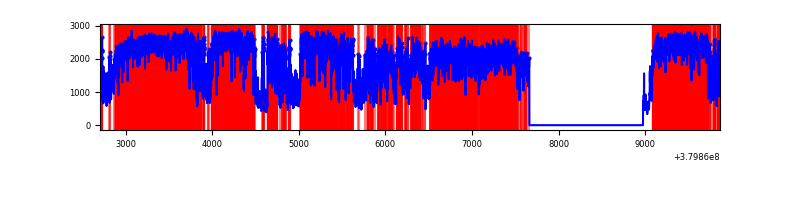 |
| C | 7160 | 5848 | 145 | 145 | 2.03% | 2.48% | 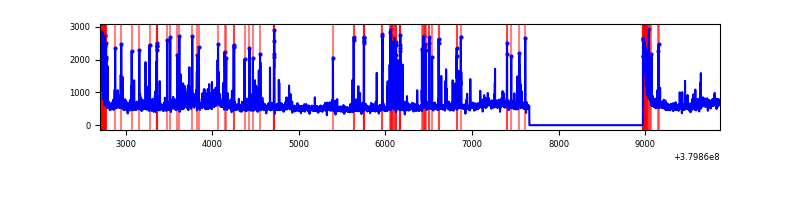 |
| D | 7160 | 5848 | 224 | 224 | 3.13% | 3.83% | 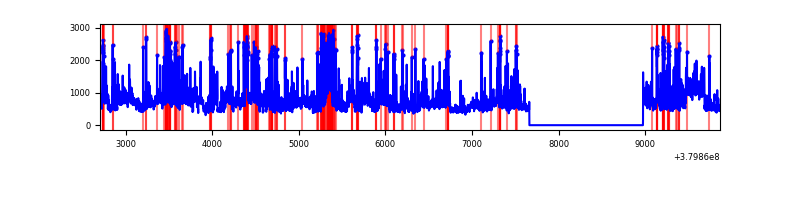 |
Top three noisy pixels from each quadrant. If the there are fewer than three noisy pixels in the level2.evt file, extra rows are filled as -1
| Pixel properties | Quadrant properties | ||||||
|---|---|---|---|---|---|---|---|
| Quadrant | DetID | PixID | Counts | Sigma | Mean | Median | Sigma |
| A | 15 | 169 | 6851137 | 58767.1 | 581 | 570 | 116.6 |
| A | 10 | 83 | 16487 | 136.54 | 581 | 570 | 116.6 |
| A | 13 | 254 | 9477 | 76.41 | 581 | 570 | 116.6 |
| B | 5 | 31 | 5268223 | 51637.81 | 528 | 515 | 102.0 |
| B | 5 | 15 | 2732980 | 26785.56 | 528 | 515 | 102.0 |
| B | 5 | 172 | 616454 | 6037.87 | 528 | 515 | 102.0 |
| C | 0 | 10 | 553172 | 3679.99 | 650 | 657 | 150.1 |
| C | 3 | 233 | 360259 | 2395.1 | 650 | 657 | 150.1 |
| C | 15 | 214 | 273073 | 1814.41 | 650 | 657 | 150.1 |
| D | 8 | 195 | 874467 | 5429.32 | 654 | 635 | 160.9 |
| D | 13 | 249 | 349065 | 2164.87 | 654 | 635 | 160.9 |
| D | 2 | 250 | 302607 | 1876.22 | 654 | 635 | 160.9 |
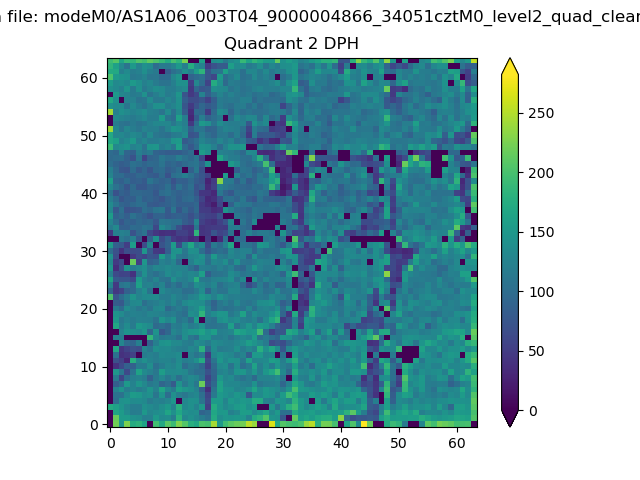
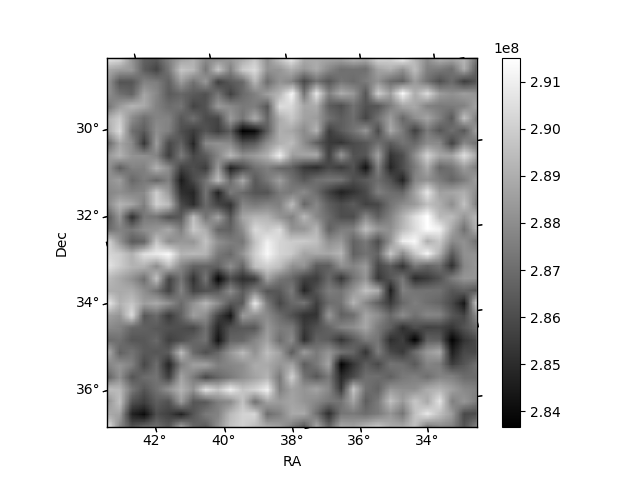
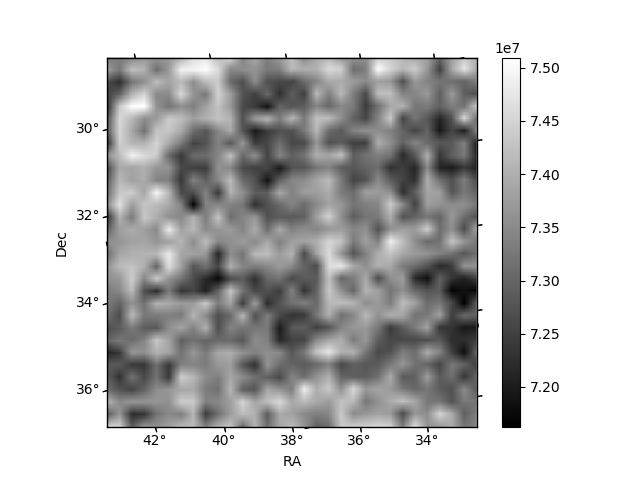
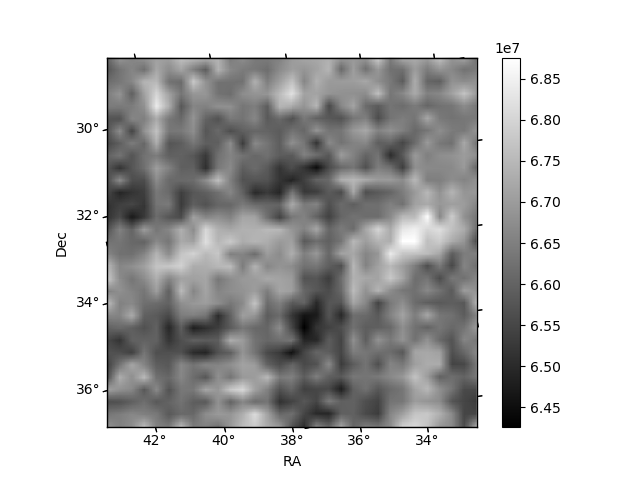
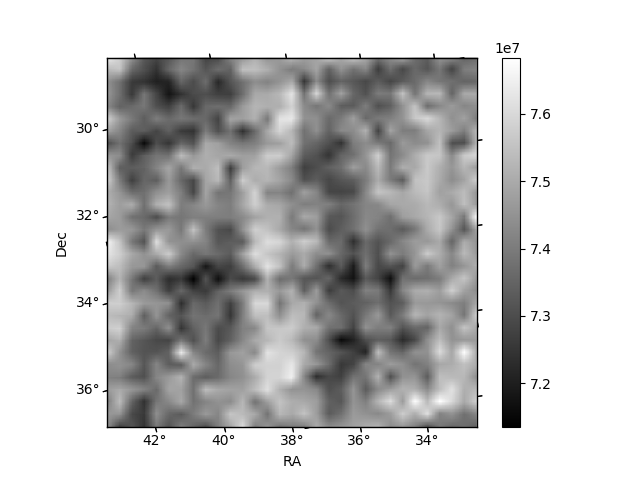
Histogram calculated using DETX and DETY for each event in the final _common_clean file
| Quadrant A | 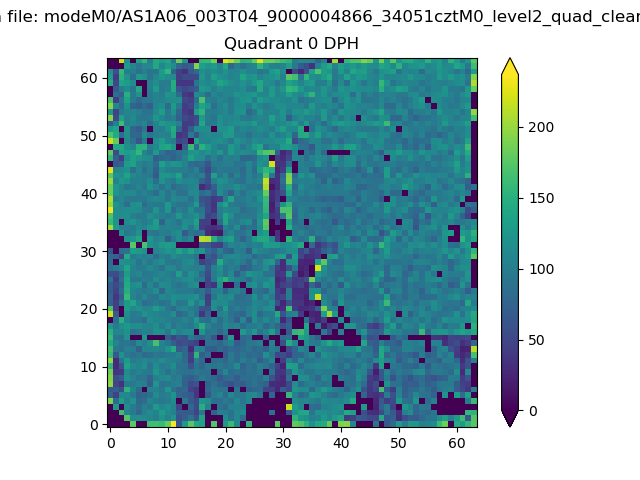 |
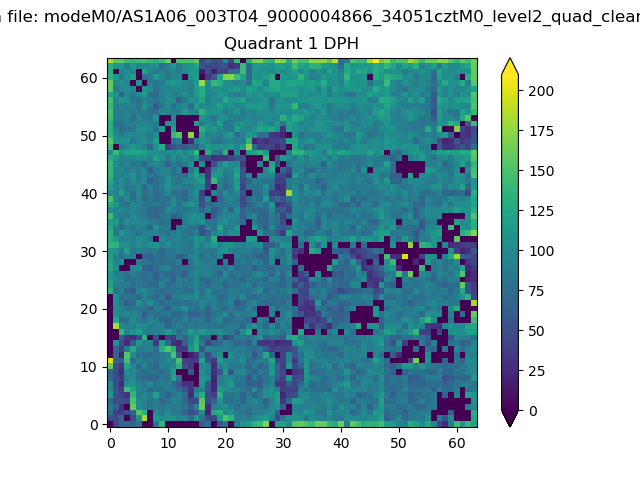 |
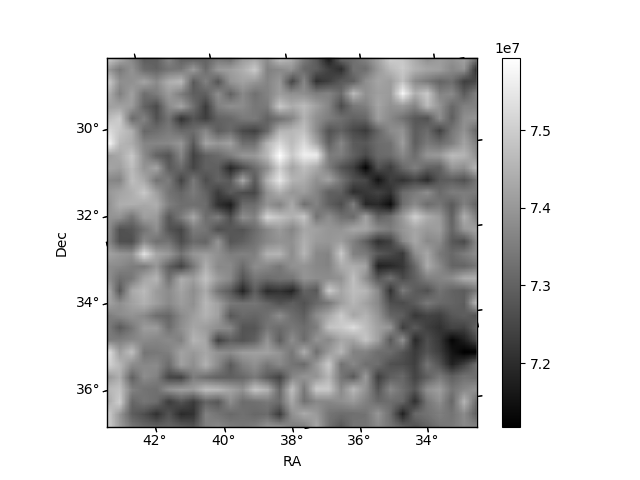
Quadrant B |
|---|---|---|---|
| Quadrant D | 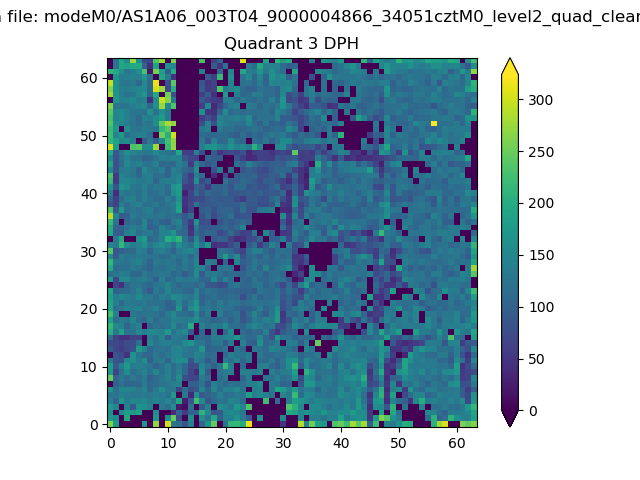 |
 |
Quadrant C |
| Plot type | Count rate plots | Images |
|---|---|---|
| Comparison with Poisson distribution Blue bars denote a histogram of data divided into 1 sec bins. Red curve is a Poisson curve with rate = median count rate of data. |
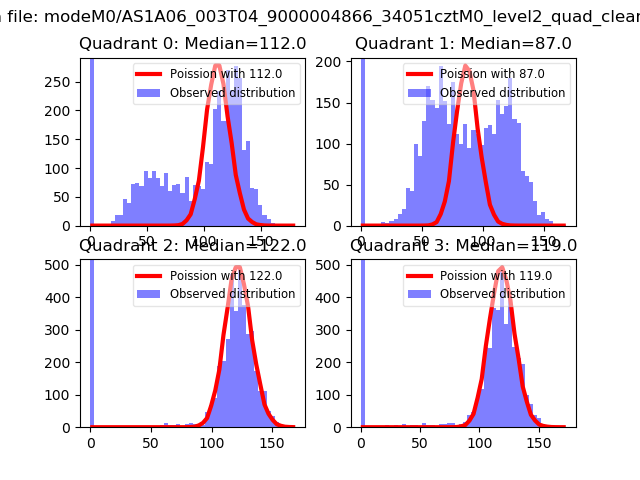 |
 |
| Quadrant-wise count rates Data is divided into 100 sec bins |
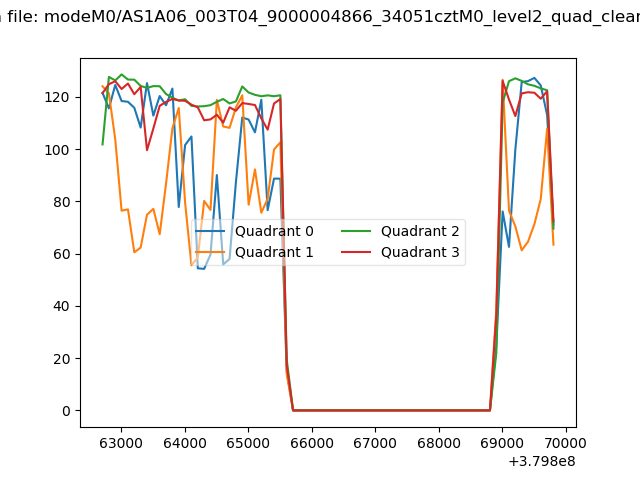 |
|
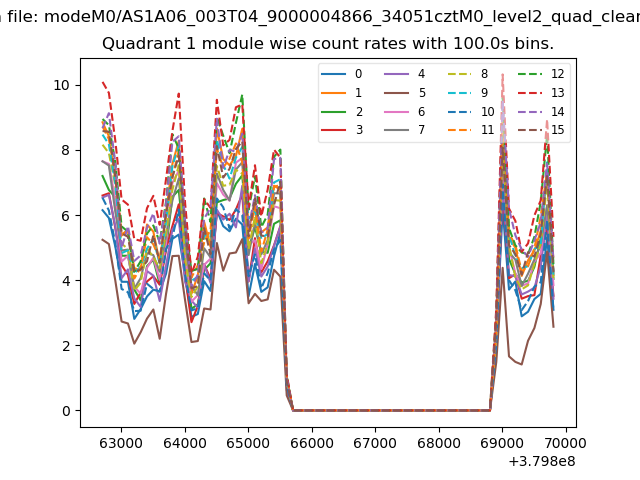
| Module-wise count rates for Quadrant A Data is divided into 100 sec bins |
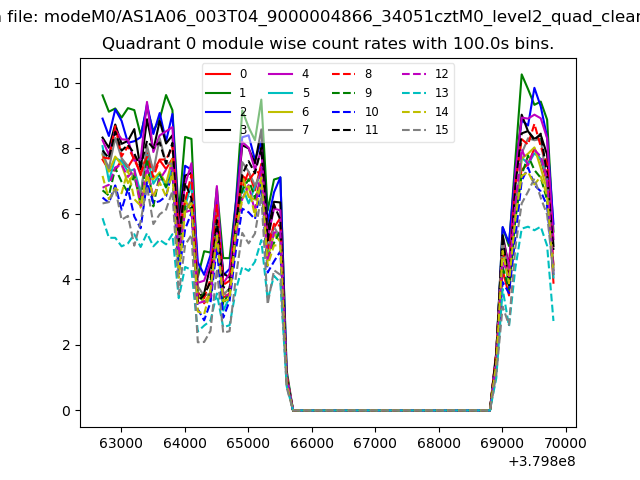 |
 |
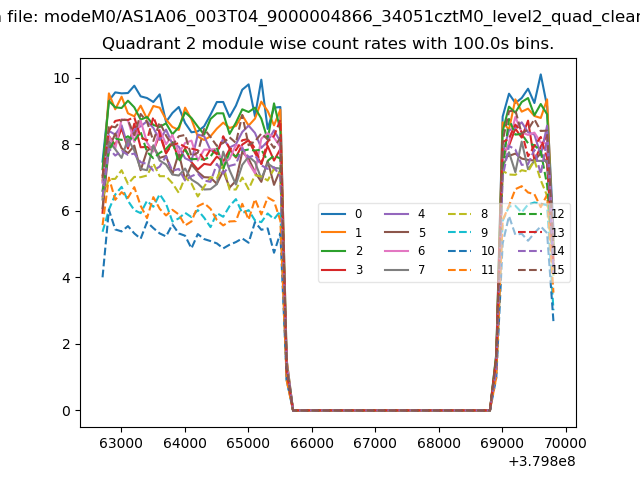
| Module-wise count rates for Quadrant B Data is divided into 100 sec bins |
 |
 |
| Module-wise count rates for Quadrant C Data is divided into 100 sec bins |
 |
 |
| Module-wise count rates for Quadrant D Data is divided into 100 sec bins |
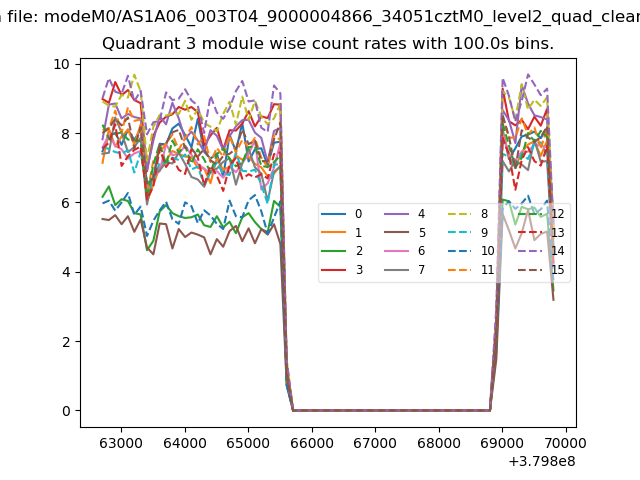 |
 |
| Parameter | Plot |
|---|---|
| CZT HV Monitor | 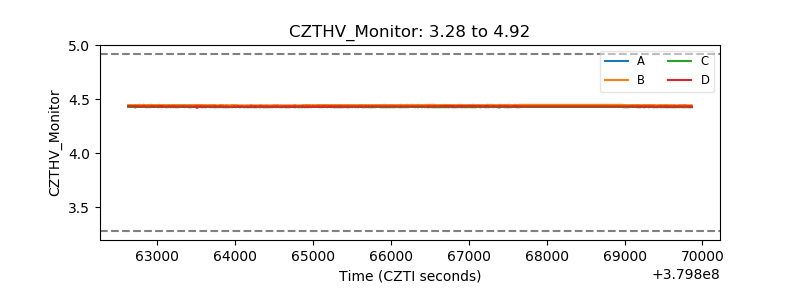 |
| D_VDD | 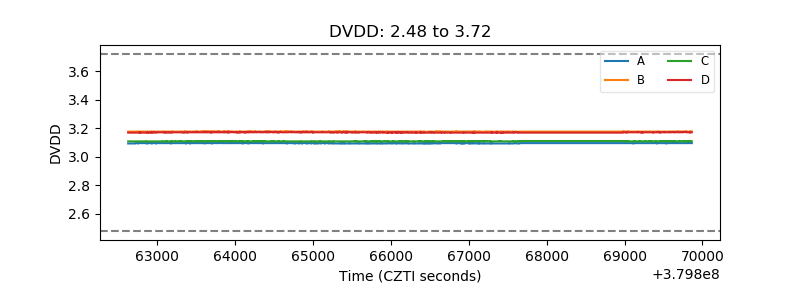 |
| Temperature 1 | 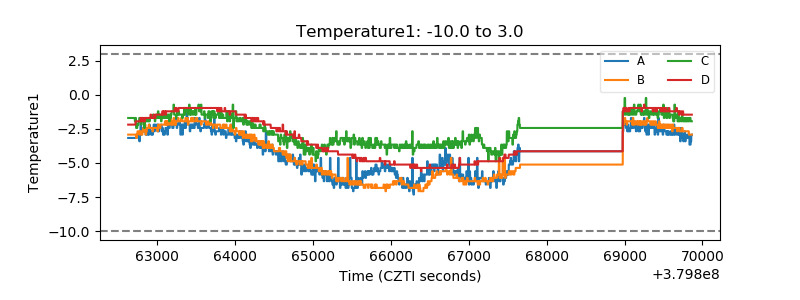 |
| Veto HV Monitor | 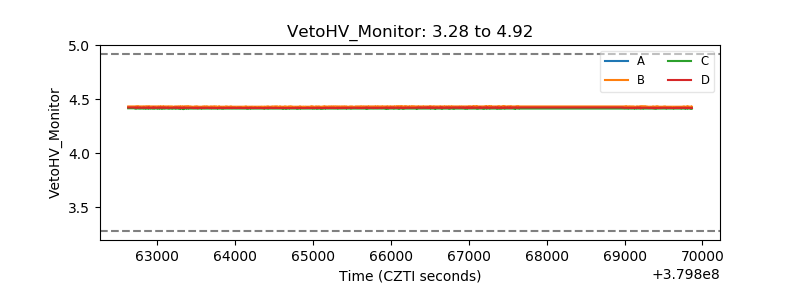 |
| Veto LLD | 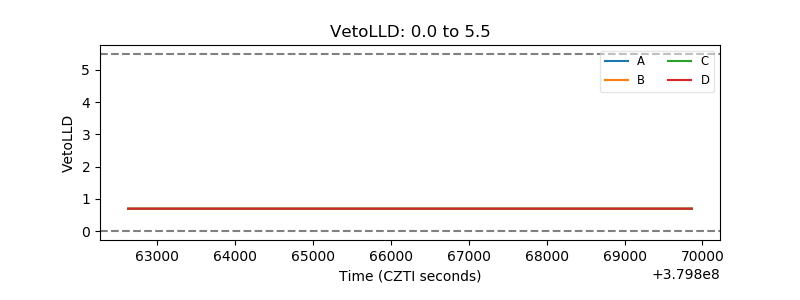 |
| Alpha Counter | 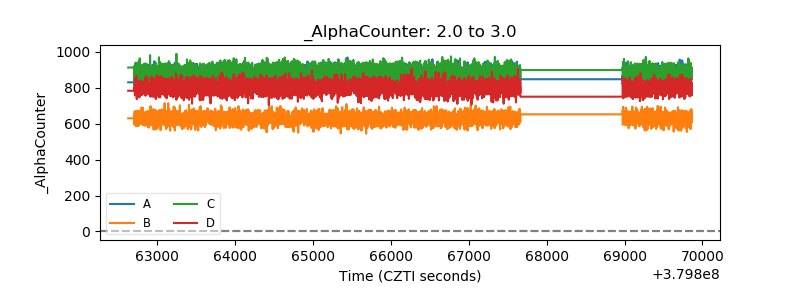 |
| _CPM_Rate |  |
| CZT Counter | 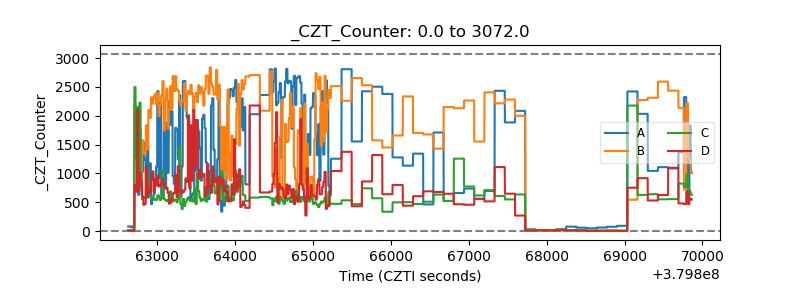 |
| +2.5 Volts monitor | 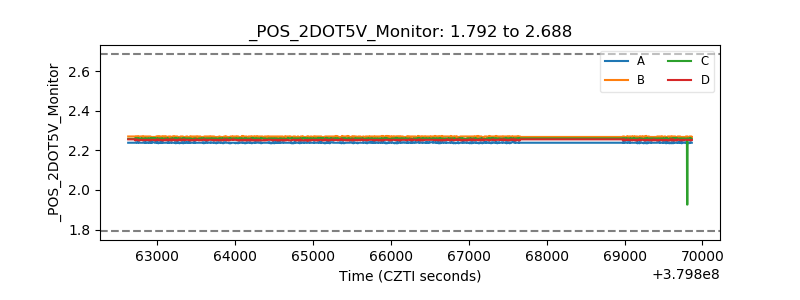 |
| +5 Volts monitor |  |
| _ROLL_ROT | 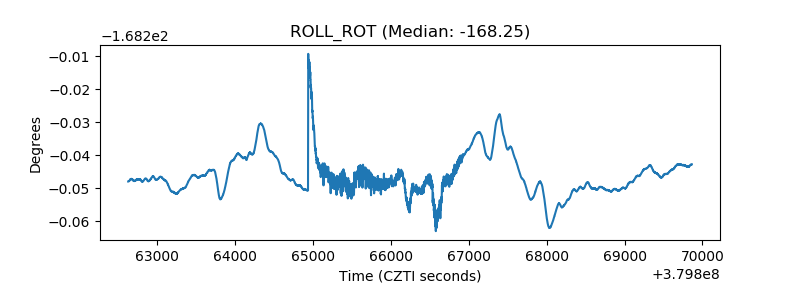 |
| _Roll_DEC | 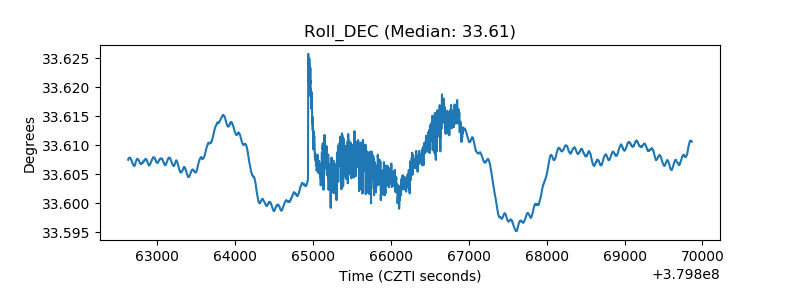 |
| _Roll_RA | 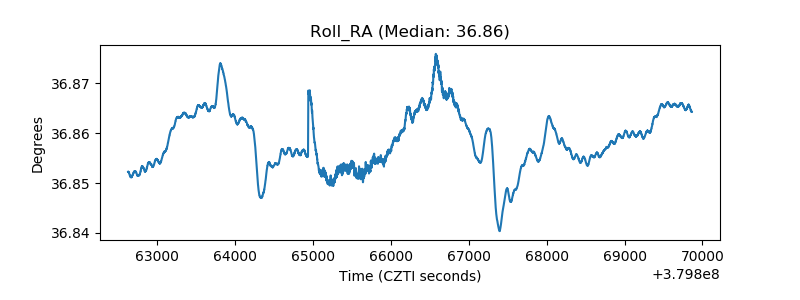 |
| Veto Counter | 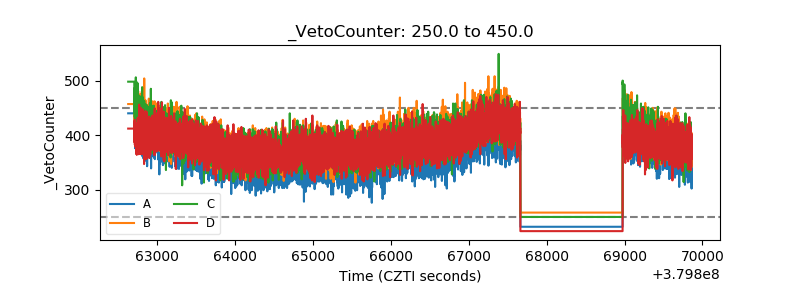 |