| Param | Original file | Final file |
|---|---|---|
| Filename | modeM0/AS1A06_003T04_9000004866_34055cztM0_level2.evt | modeM0/AS1A06_003T04_9000004866_34055cztM0_level2_quad_clean.evt |
| Size (bytes) | 692,550,720 | 65,963,520 |
| Size | 660.5 MB | 62.9 MB |
| Events in quadrant A | 4,523,432 | 415,239 |
| Events in quadrant B | 8,402,759 | 365,178 |
| Events in quadrant C | 3,508,151 | 421,439 |
| Events in quadrant D | 4,162,604 | 403,944 |
| Mode M9 | |||
|---|---|---|---|
| Quadrant | BADHDUFLAG | Total packets | Discarded packets |
| A | 0 | 27 | 0 |
| B | 0 | 27 | 0 |
| C | 0 | 27 | 0 |
| D | 0 | 28 | 0 |
| Mode M0 | |||
|---|---|---|---|
| Quadrant | BADHDUFLAG | Total packets | Discarded packets |
| A | 0 | 17311 | 3 |
| B | 0 | 28786 | 2 |
| C | 0 | 13855 | 2 |
| D | 0 | 16177 | 2 |
| Mode SS | |||
|---|---|---|---|
| Quadrant | BADHDUFLAG | Total packets | Discarded packets |
| A | 0 | 114 | 0 |
| B | 0 | 114 | 0 |
| C | 0 | 114 | 0 |
| D | 0 | 114 | 0 |
| Quadrant | Total seconds | Saturated seconds | Saturation percentage |
|---|---|---|---|
| A | 5583 | 507 | 9.081139% |
| B | 5583 | 2114 | 37.864947% |
| C | 5583 | 142 | 2.543435% |
| D | 5583 | 235 | 4.209207% |
Noise dominated data is calculated using 1-second bins in cleaned event files. If a bin has >2000 counts, and if more than 50% of those come from <1% of pixels, then it is considered to be noise-dominated and hence unusable.
| Quadrant | # 1 sec bins | Bins with >0 counts | Bins with >2000 counts | High rate bins dominated by noise | Noise dominated (total time) | Noise dominated (detector-on time) | Marked lightcurve |
|---|---|---|---|---|---|---|---|
| A | 7197 | 5583 | 341 | 341 | 4.74% | 6.11% | 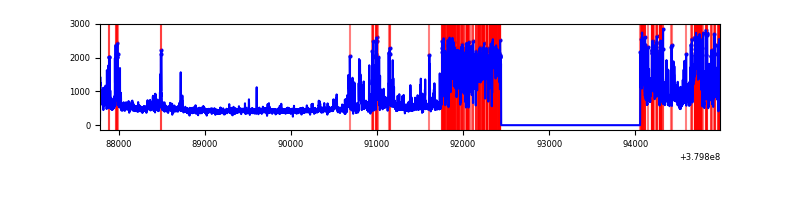 |
| B | 7196 | 5582 | 1830 | 1830 | 25.43% | 32.78% | 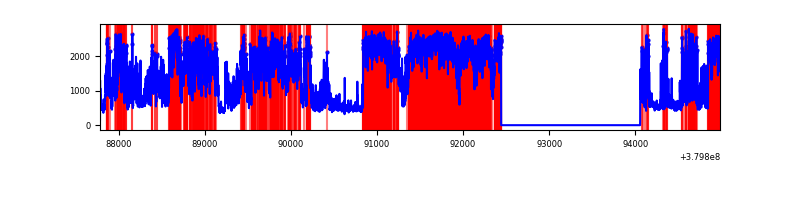 |
| C | 7197 | 5584 | 132 | 132 | 1.83% | 2.36% | 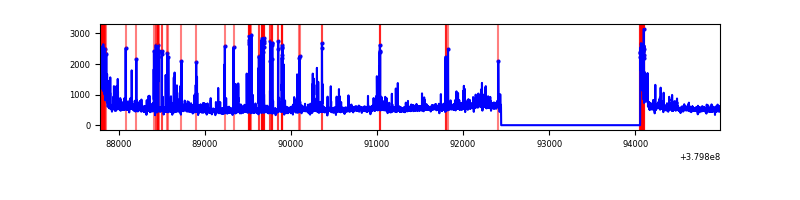 |
| D | 7197 | 5584 | 218 | 218 | 3.03% | 3.90% | 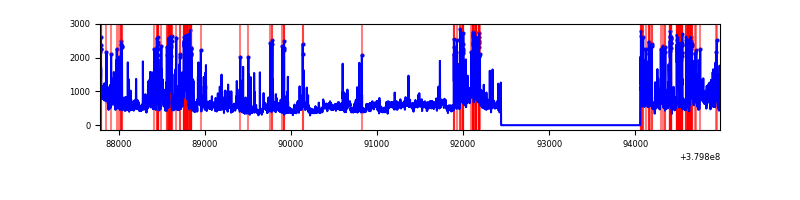 |
Top three noisy pixels from each quadrant. If the there are fewer than three noisy pixels in the level2.evt file, extra rows are filled as -1
| Pixel properties | Quadrant properties | ||||||
|---|---|---|---|---|---|---|---|
| Quadrant | DetID | PixID | Counts | Sigma | Mean | Median | Sigma |
| A | 15 | 169 | 2017245 | 15581.7 | 640 | 627 | 129.4 |
| A | 10 | 83 | 19236 | 143.79 | 640 | 627 | 129.4 |
| A | 13 | 6 | 12673 | 93.08 | 640 | 627 | 129.4 |
| B | 5 | 31 | 2554666 | 22949.19 | 575 | 561 | 111.3 |
| B | 5 | 15 | 1758226 | 15793.01 | 575 | 561 | 111.3 |
| B | 5 | 172 | 781728 | 7018.96 | 575 | 561 | 111.3 |
| C | 0 | 10 | 520693 | 3513.33 | 634 | 640 | 148.0 |
| C | 15 | 214 | 242949 | 1636.97 | 634 | 640 | 148.0 |
| C | 0 | 207 | 115179 | 773.79 | 634 | 640 | 148.0 |
| D | 8 | 195 | 495443 | 2919.76 | 626 | 615 | 169.5 |
| D | 2 | 250 | 480647 | 2832.46 | 626 | 615 | 169.5 |
| D | 12 | 6 | 257807 | 1517.58 | 626 | 615 | 169.5 |
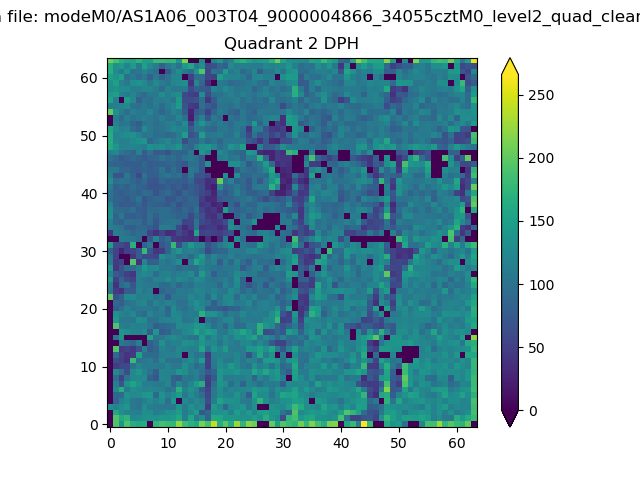
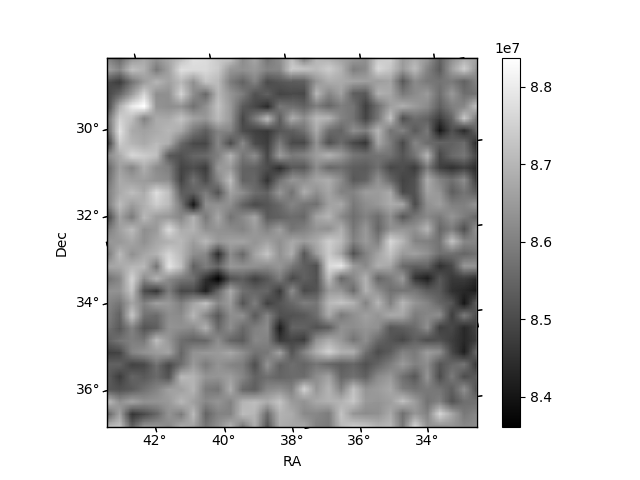
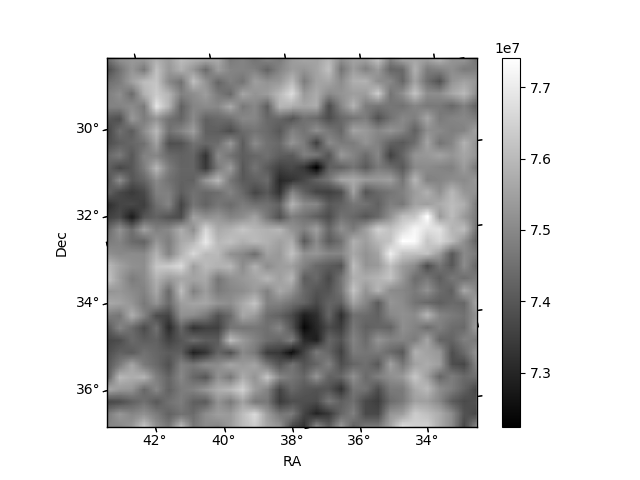
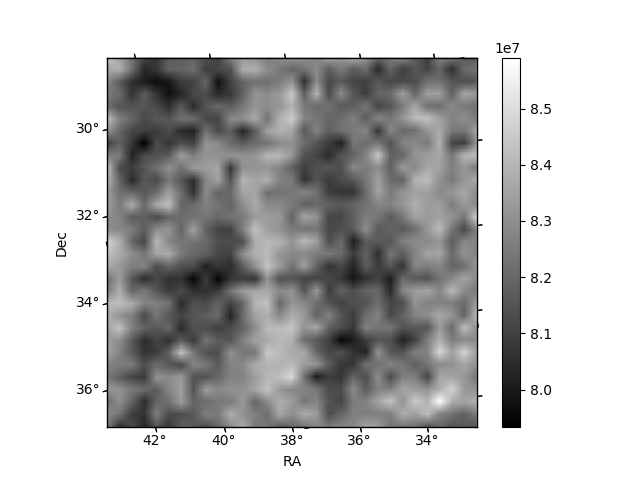
Histogram calculated using DETX and DETY for each event in the final _common_clean file
| Quadrant A | 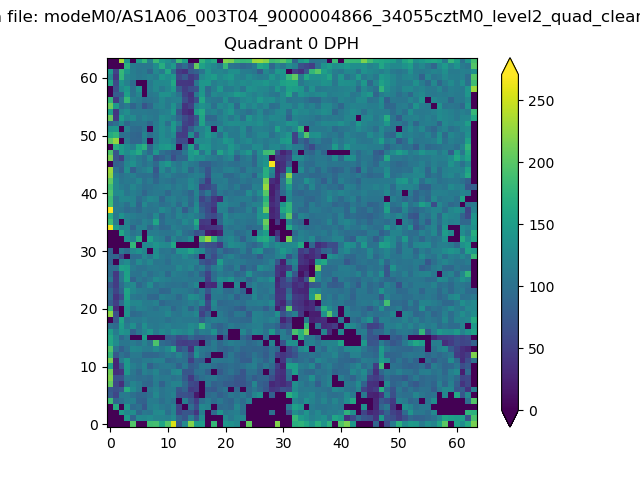 |
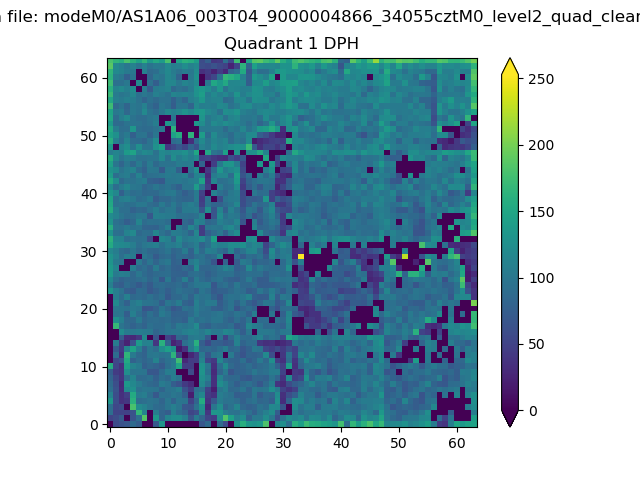 |
Quadrant B |
|---|---|---|---|
| Quadrant D | 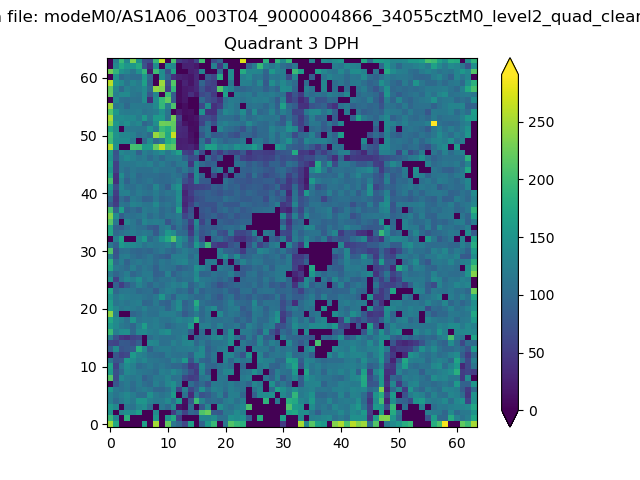 |
 |
Quadrant C |
| Plot type | Count rate plots | Images |
|---|---|---|
| Comparison with Poisson distribution Blue bars denote a histogram of data divided into 1 sec bins. Red curve is a Poisson curve with rate = median count rate of data. |
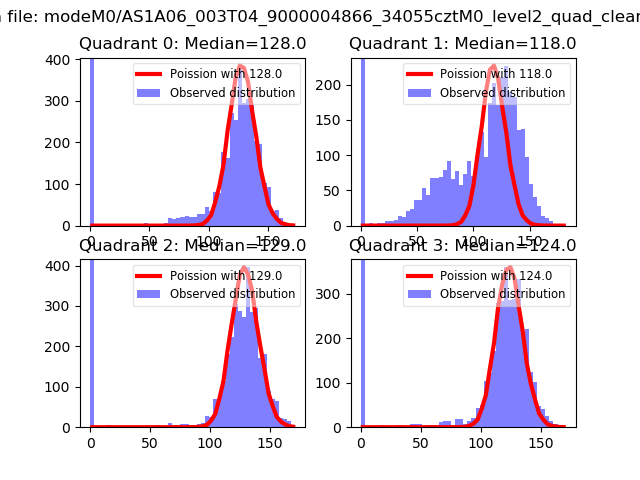 |
 |
| Quadrant-wise count rates Data is divided into 100 sec bins |
 |
|
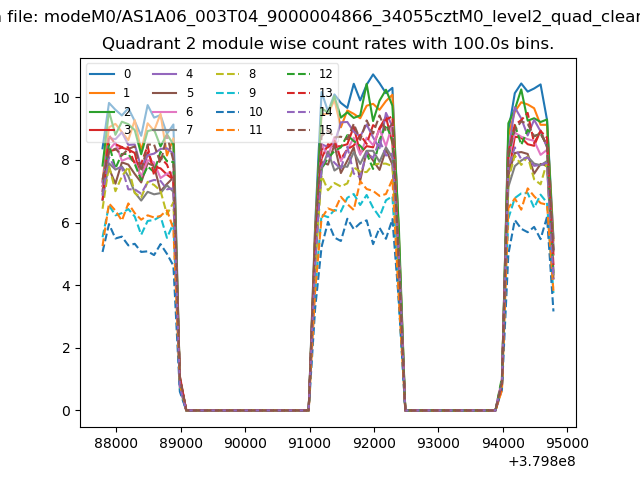
| Module-wise count rates for Quadrant A Data is divided into 100 sec bins |
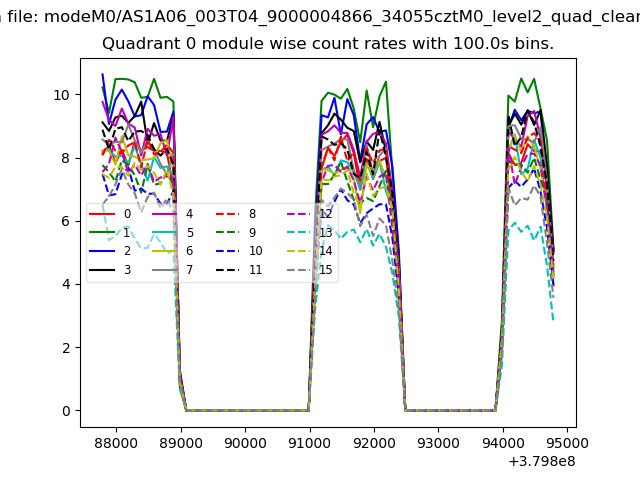 |
 |
| Module-wise count rates for Quadrant B Data is divided into 100 sec bins |
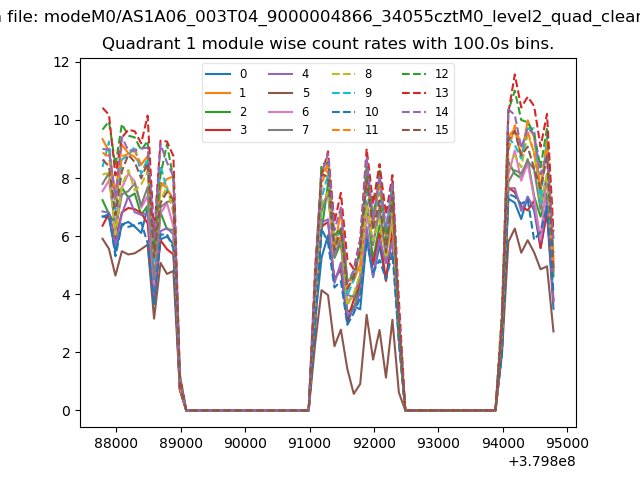 |
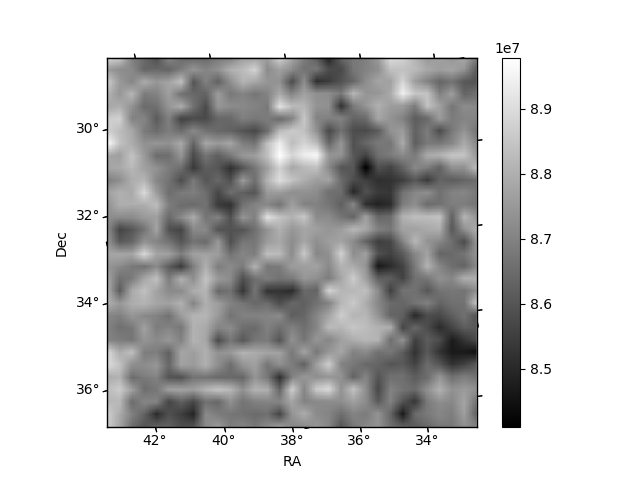 |
| Module-wise count rates for Quadrant C Data is divided into 100 sec bins |
 |
 |
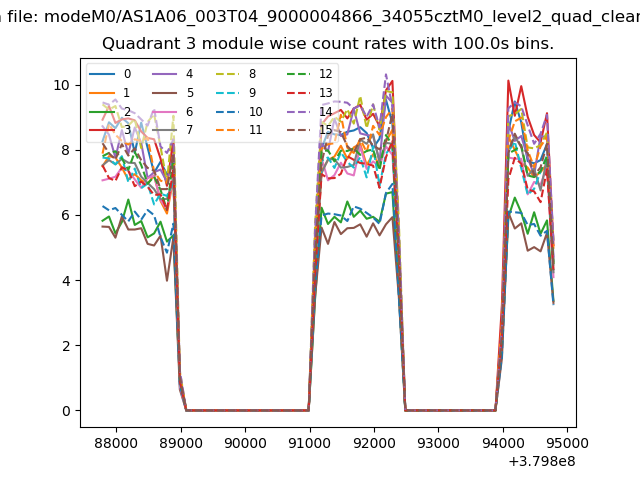
| Module-wise count rates for Quadrant D Data is divided into 100 sec bins |
 |
 |
| Parameter | Plot |
|---|---|
| CZT HV Monitor | 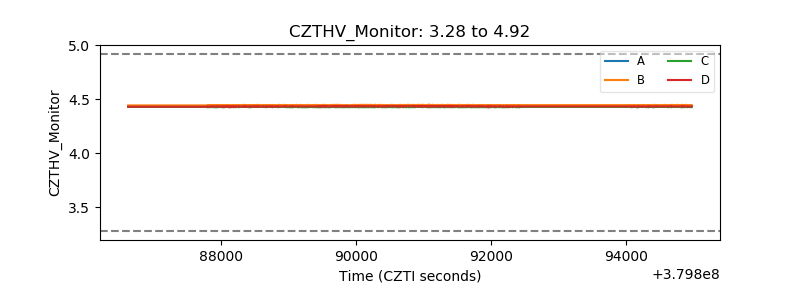 |
| D_VDD | 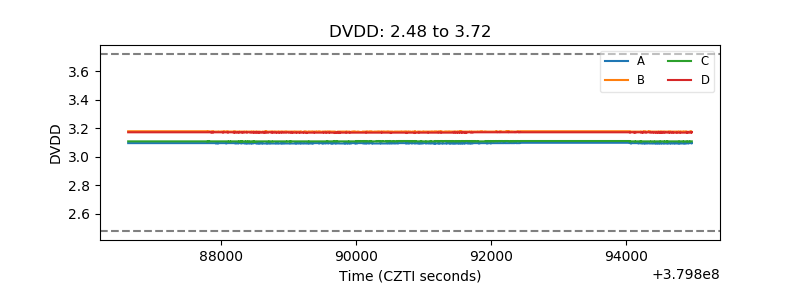 |
| Temperature 1 | 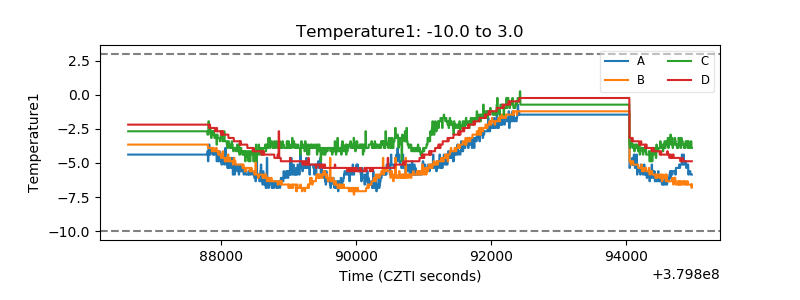 |
| Veto HV Monitor |  |
| Veto LLD | 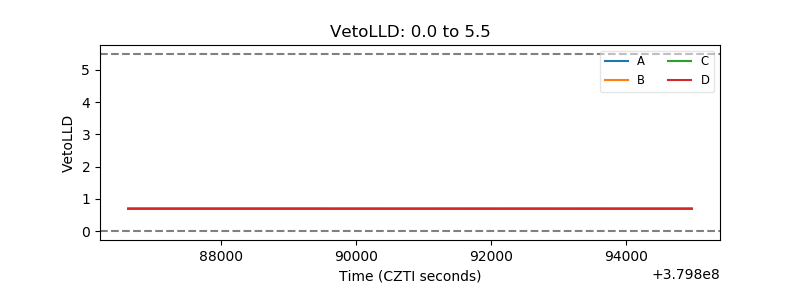 |
| Alpha Counter | 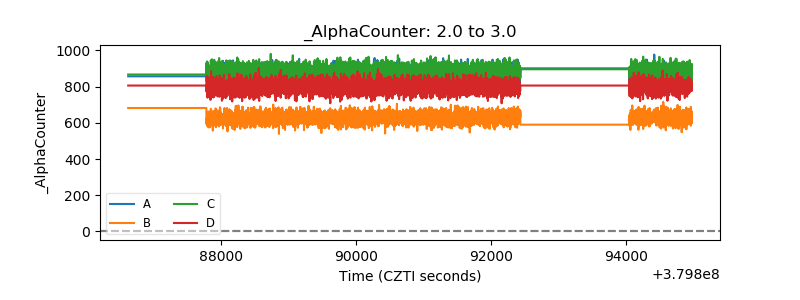 |
| _CPM_Rate | 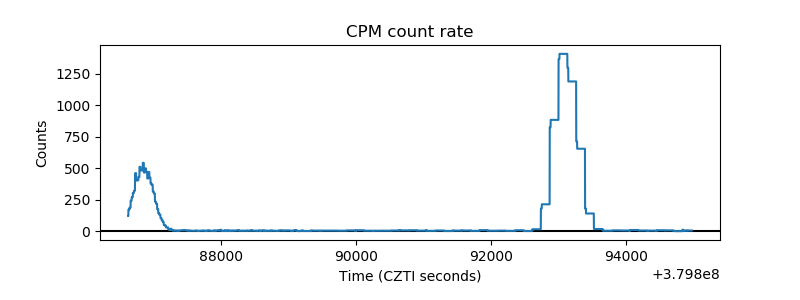 |
| CZT Counter | 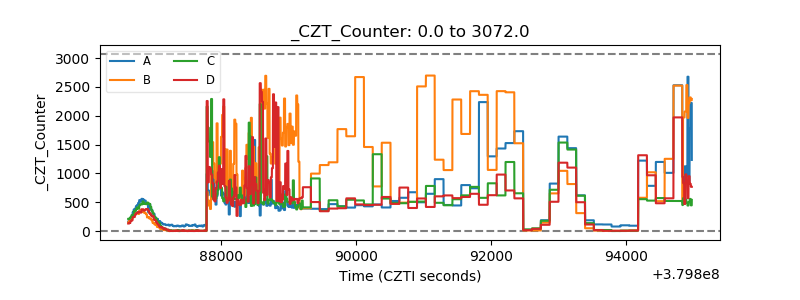 |
| +2.5 Volts monitor | 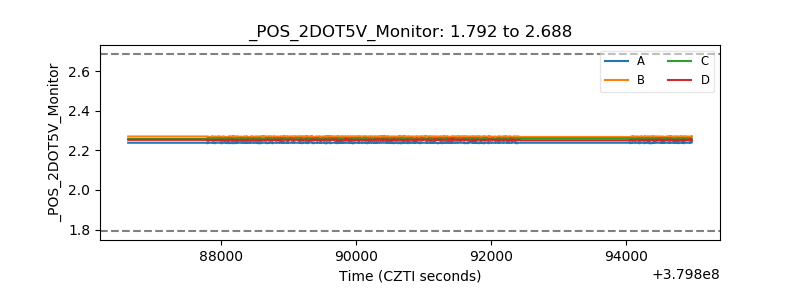 |
| +5 Volts monitor |  |
| _ROLL_ROT | 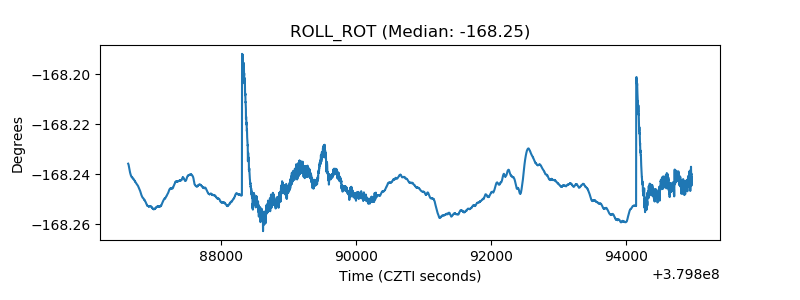 |
| _Roll_DEC | 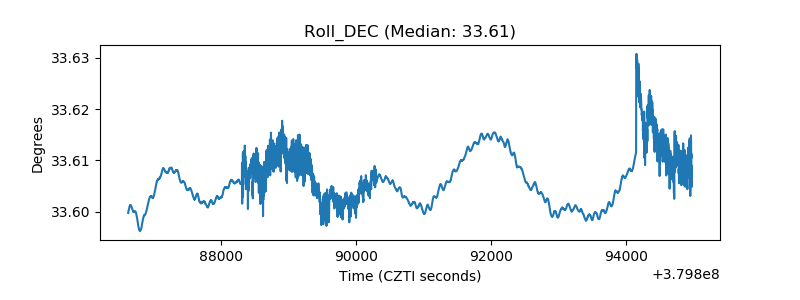 |
| _Roll_RA | 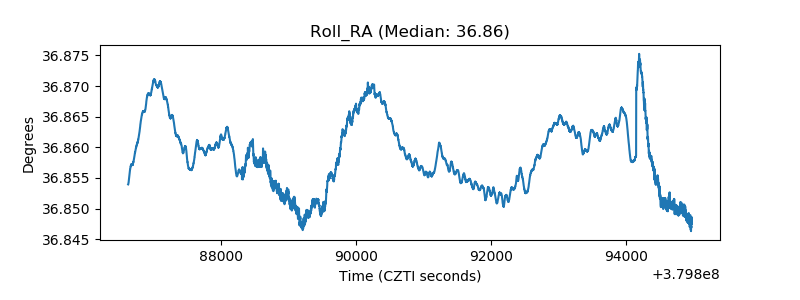 |
| Veto Counter | 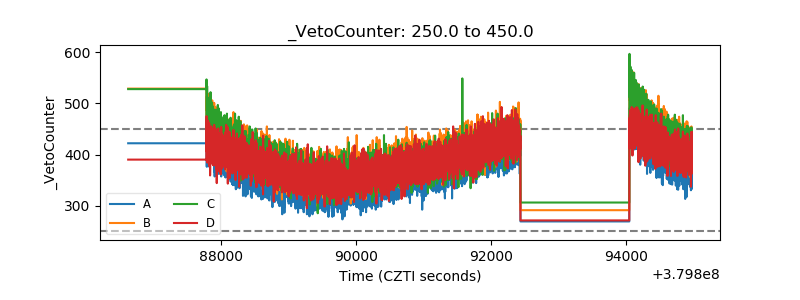 |