| Param | Original file | Final file |
|---|---|---|
| Filename | modeM0/AS1A06_003T04_9000004866_34058cztM0_level2.evt | modeM0/AS1A06_003T04_9000004866_34058cztM0_level2_quad_clean.evt |
| Size (bytes) | 620,182,080 | 52,274,880 |
| Size | 591.5 MB | 49.9 MB |
| Events in quadrant A | 3,889,947 | 305,239 |
| Events in quadrant B | 6,683,485 | 304,517 |
| Events in quadrant C | 4,077,873 | 293,970 |
| Events in quadrant D | 3,759,469 | 293,864 |
| Mode M9 | |||
|---|---|---|---|
| Quadrant | BADHDUFLAG | Total packets | Discarded packets |
| A | 0 | 19 | 0 |
| B | 0 | 19 | 0 |
| C | 0 | 19 | 0 |
| D | 0 | 20 | 0 |
| Mode M0 | |||
|---|---|---|---|
| Quadrant | BADHDUFLAG | Total packets | Discarded packets |
| A | 0 | 14933 | 2 |
| B | 0 | 23634 | 1 |
| C | 0 | 15505 | 1 |
| D | 0 | 14839 | 1 |
| Mode SS | |||
|---|---|---|---|
| Quadrant | BADHDUFLAG | Total packets | Discarded packets |
| A | 0 | 110 | 0 |
| B | 0 | 110 | 0 |
| C | 0 | 110 | 0 |
| D | 0 | 110 | 0 |
| Quadrant | Total seconds | Saturated seconds | Saturation percentage |
|---|---|---|---|
| A | 5502 | 213 | 3.871320% |
| B | 5502 | 1239 | 22.519084% |
| C | 5502 | 346 | 6.288622% |
| D | 5502 | 145 | 2.635405% |
Noise dominated data is calculated using 1-second bins in cleaned event files. If a bin has >2000 counts, and if more than 50% of those come from <1% of pixels, then it is considered to be noise-dominated and hence unusable.
| Quadrant | # 1 sec bins | Bins with >0 counts | Bins with >2000 counts | High rate bins dominated by noise | Noise dominated (total time) | Noise dominated (detector-on time) | Marked lightcurve |
|---|---|---|---|---|---|---|---|
| A | 7383 | 5503 | 178 | 178 | 2.41% | 3.23% | 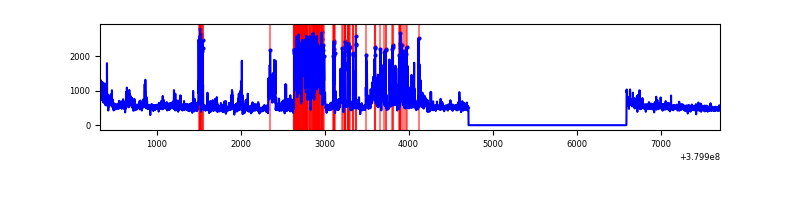 |
| B | 7383 | 5503 | 946 | 946 | 12.81% | 17.19% | 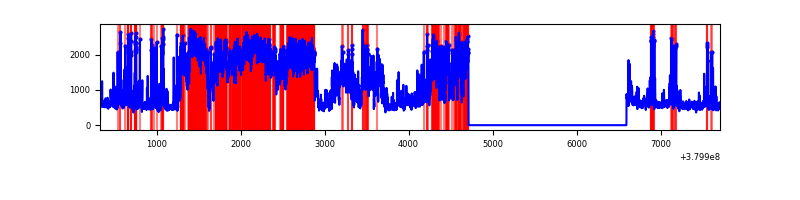 |
| C | 7383 | 5503 | 335 | 335 | 4.54% | 6.09% | 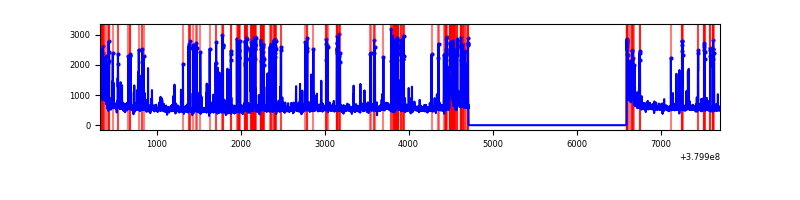 |
| D | 7383 | 5503 | 130 | 130 | 1.76% | 2.36% | 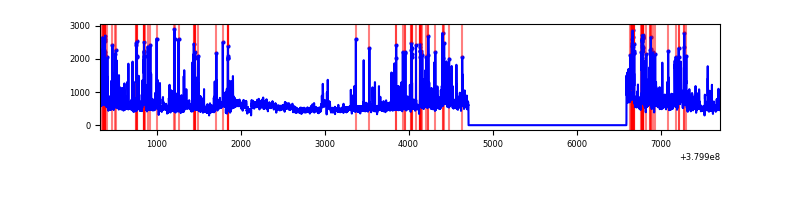 |
Top three noisy pixels from each quadrant. If the there are fewer than three noisy pixels in the level2.evt file, extra rows are filled as -1
| Pixel properties | Quadrant properties | ||||||
|---|---|---|---|---|---|---|---|
| Quadrant | DetID | PixID | Counts | Sigma | Mean | Median | Sigma |
| A | 15 | 169 | 1239114 | 9120.02 | 677 | 663 | 135.8 |
| A | 10 | 83 | 19281 | 137.1 | 677 | 663 | 135.8 |
| A | 7 | 16 | 12712 | 88.73 | 677 | 663 | 135.8 |
| B | 5 | 31 | 1665517 | 13460.23 | 657 | 641 | 123.7 |
| B | 5 | 15 | 1336127 | 10797.17 | 657 | 641 | 123.7 |
| B | 5 | 14 | 465820 | 3760.89 | 657 | 641 | 123.7 |
| C | 0 | 10 | 1045595 | 7040.18 | 645 | 650 | 148.4 |
| C | 15 | 214 | 235085 | 1579.47 | 645 | 650 | 148.4 |
| C | 7 | 221 | 101465 | 679.23 | 645 | 650 | 148.4 |
| D | 8 | 195 | 291695 | 1829.78 | 654 | 637 | 159.1 |
| D | 13 | 249 | 280969 | 1762.35 | 654 | 637 | 159.1 |
| D | 2 | 250 | 168204 | 1053.44 | 654 | 637 | 159.1 |
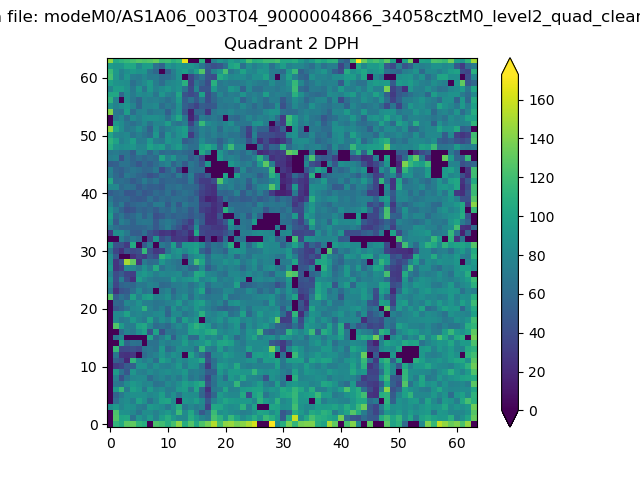
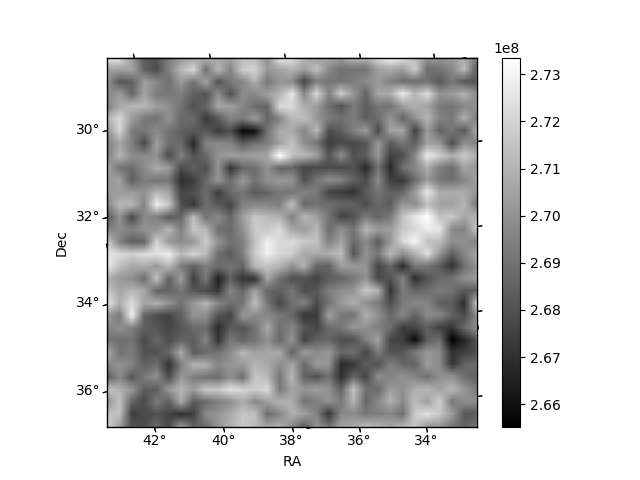
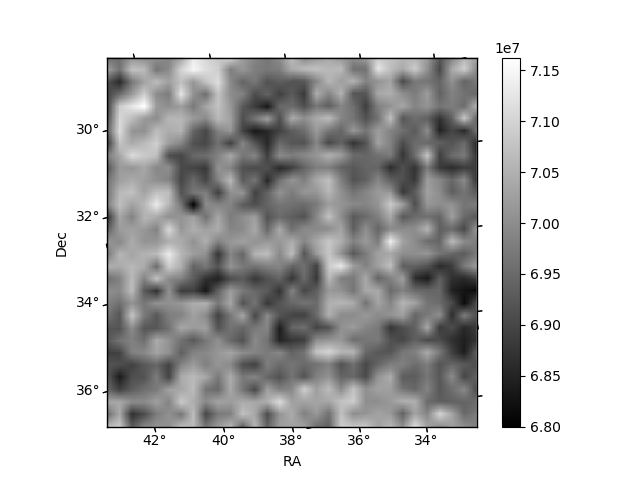
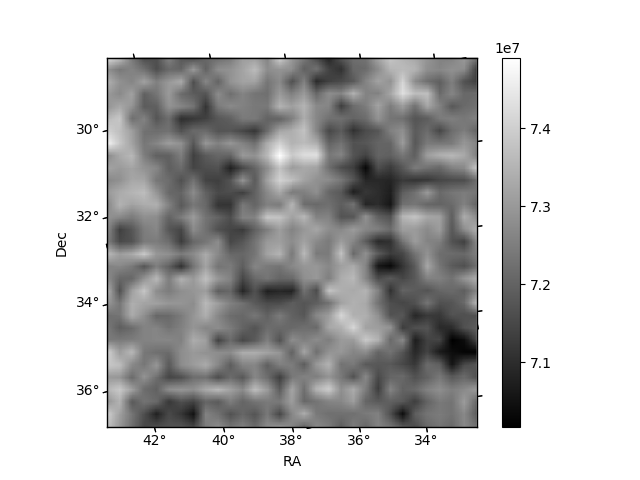
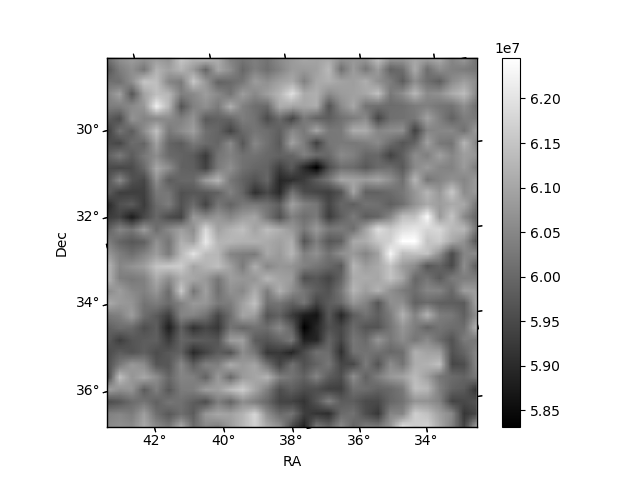
Histogram calculated using DETX and DETY for each event in the final _common_clean file
| Quadrant A | 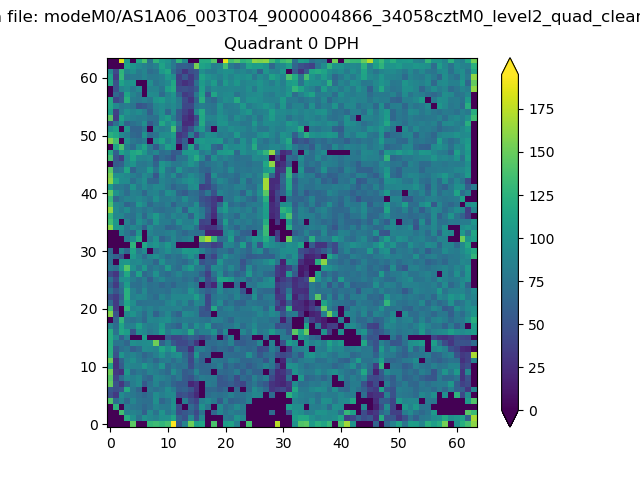 |
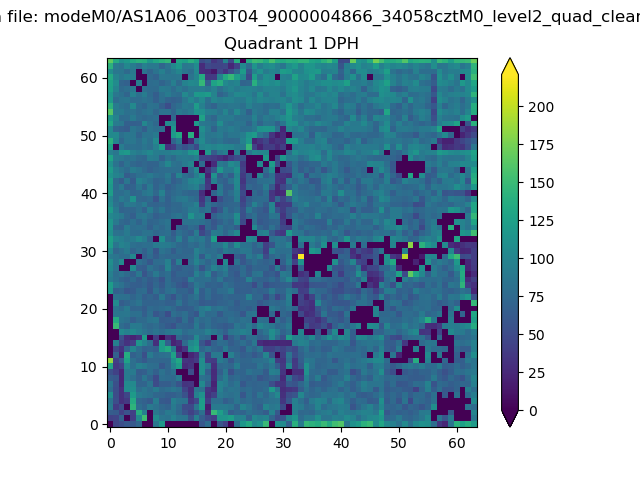 |
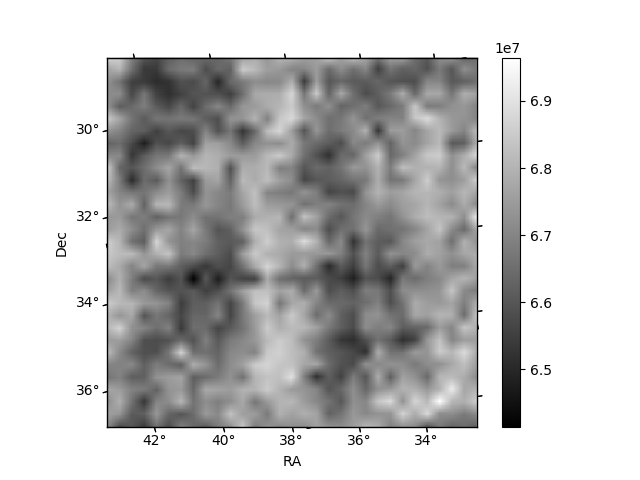
Quadrant B |
|---|---|---|---|
| Quadrant D | 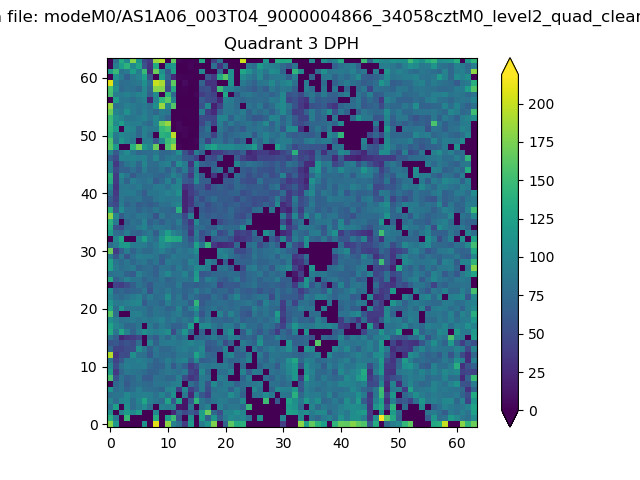 |
 |
Quadrant C |
| Plot type | Count rate plots | Images |
|---|---|---|
| Comparison with Poisson distribution Blue bars denote a histogram of data divided into 1 sec bins. Red curve is a Poisson curve with rate = median count rate of data. |
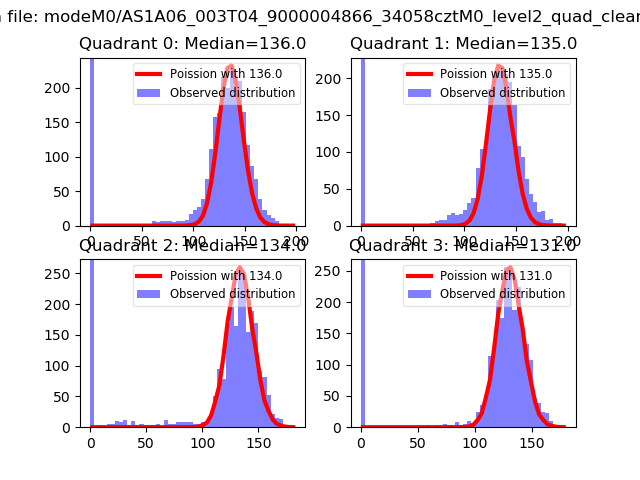 |
 |
| Quadrant-wise count rates Data is divided into 100 sec bins |
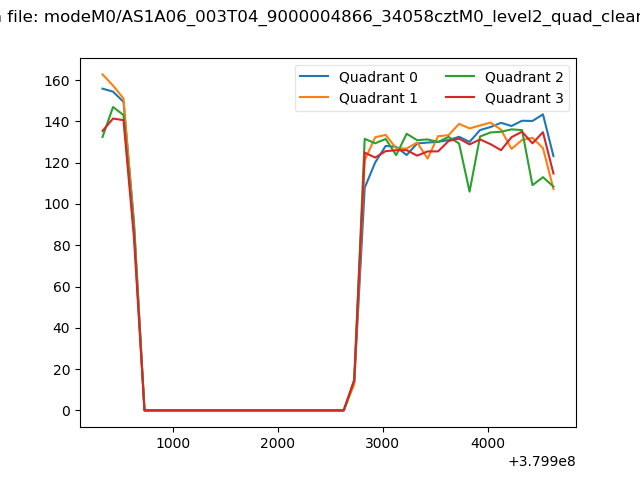 |
|
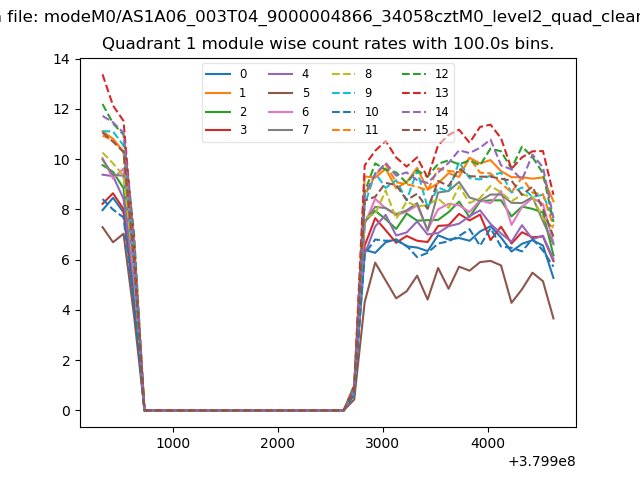
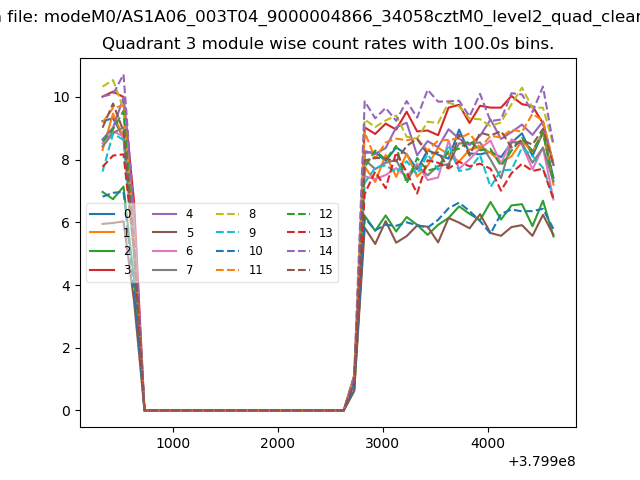
| Module-wise count rates for Quadrant A Data is divided into 100 sec bins |
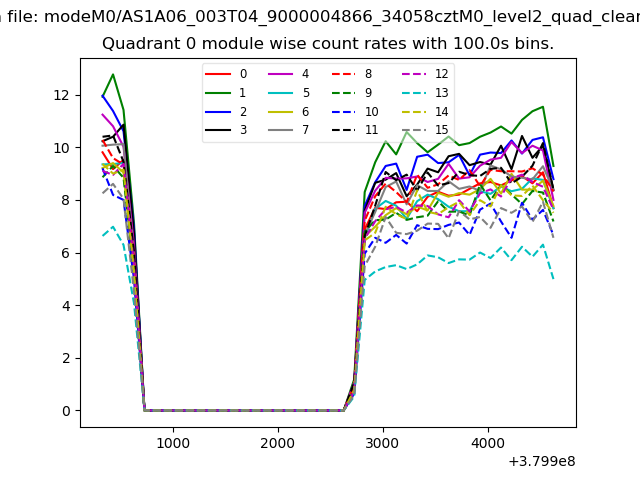 |
 |
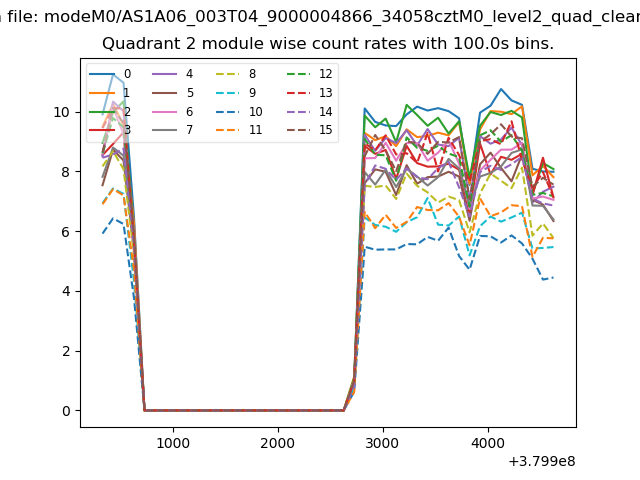
| Module-wise count rates for Quadrant B Data is divided into 100 sec bins |
 |
 |
| Module-wise count rates for Quadrant C Data is divided into 100 sec bins |
 |
 |
| Module-wise count rates for Quadrant D Data is divided into 100 sec bins |
 |
 |
| Parameter | Plot |
|---|---|
| CZT HV Monitor | 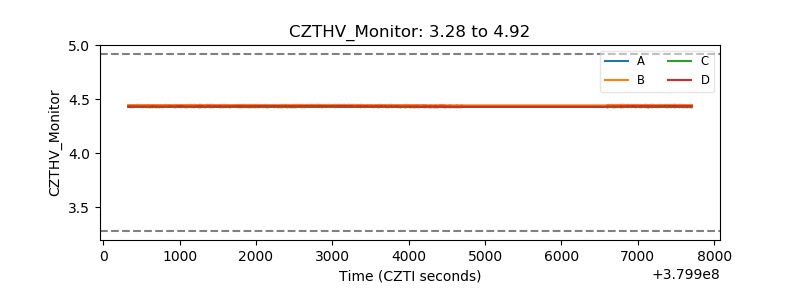 |
| D_VDD | 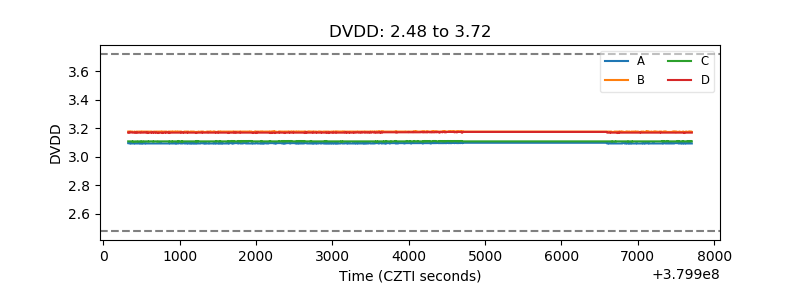 |
| Temperature 1 | 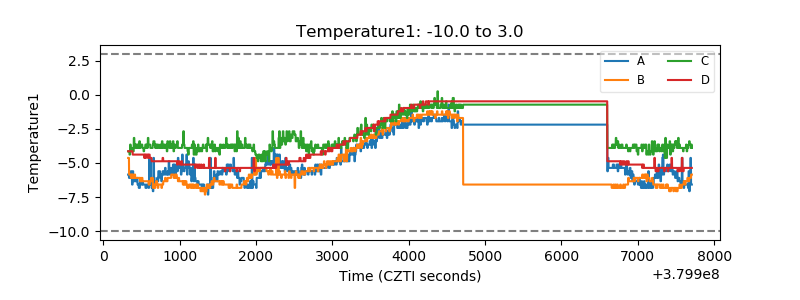 |
| Veto HV Monitor |  |
| Veto LLD | 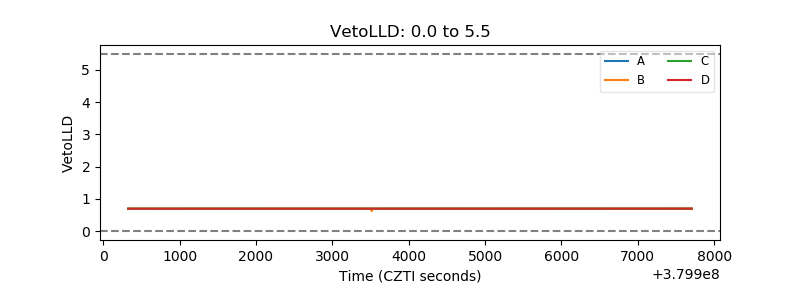 |
| Alpha Counter | 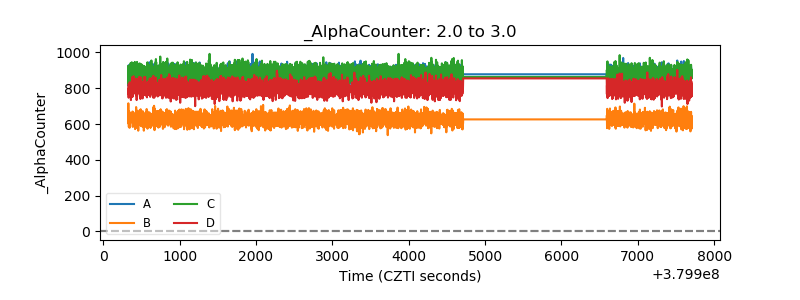 |
| _CPM_Rate | 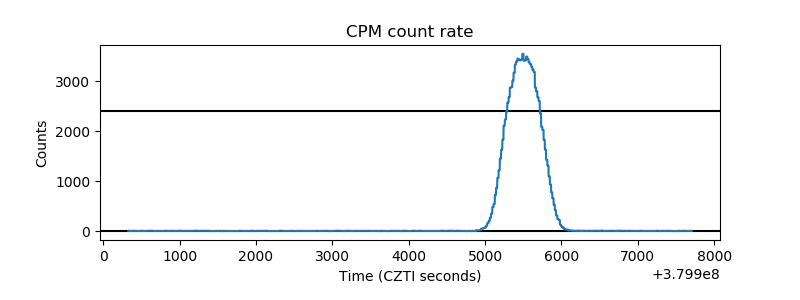 |
| CZT Counter | 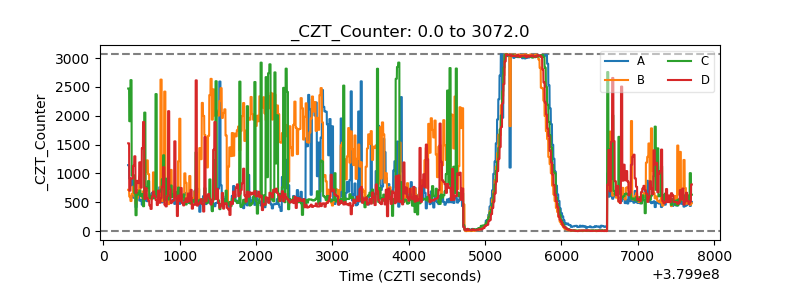 |
| +2.5 Volts monitor |  |
| +5 Volts monitor | 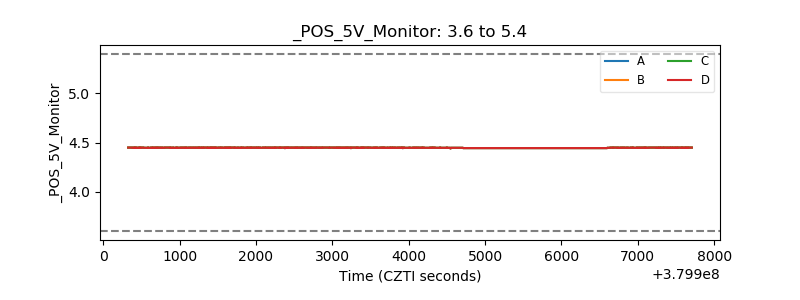 |
| _ROLL_ROT | 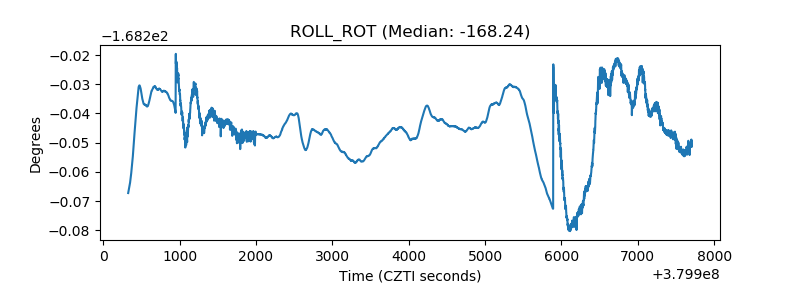 |
| _Roll_DEC | 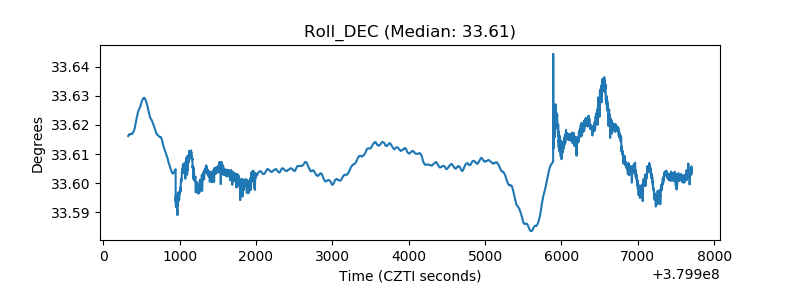 |
| _Roll_RA | 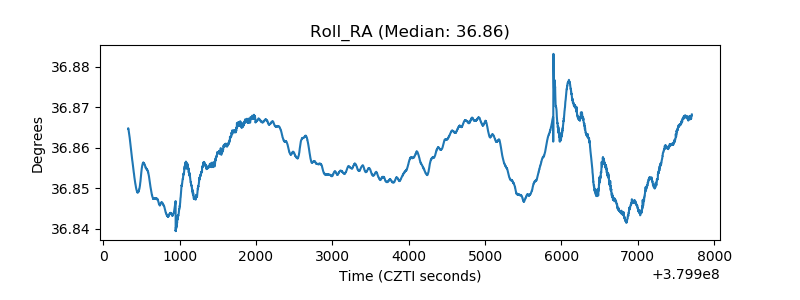 |
| Veto Counter | 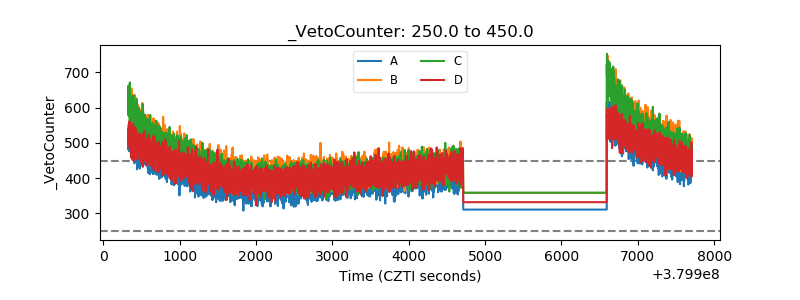 |