| Param | Original file | Final file |
|---|---|---|
| Filename | modeM0/AS1A06_003T04_9000004866_34059cztM0_level2.evt | modeM0/AS1A06_003T04_9000004866_34059cztM0_level2_quad_clean.evt |
| Size (bytes) | 622,451,520 | 49,754,880 |
| Size | 593.6 MB | 47.4 MB |
| Events in quadrant A | 5,161,741 | 271,060 |
| Events in quadrant B | 4,809,138 | 284,144 |
| Events in quadrant C | 3,899,074 | 302,688 |
| Events in quadrant D | 4,620,024 | 273,926 |
| Mode M9 | |||
|---|---|---|---|
| Quadrant | BADHDUFLAG | Total packets | Discarded packets |
| A | 0 | 20 | 0 |
| B | 0 | 20 | 0 |
| C | 0 | 20 | 0 |
| D | 0 | 20 | 0 |
| Mode M0 | |||
|---|---|---|---|
| Quadrant | BADHDUFLAG | Total packets | Discarded packets |
| A | 0 | 18613 | 3 |
| B | 0 | 17733 | 2 |
| C | 0 | 15054 | 2 |
| D | 0 | 17494 | 2 |
| Mode SS | |||
|---|---|---|---|
| Quadrant | BADHDUFLAG | Total packets | Discarded packets |
| A | 0 | 110 | 0 |
| B | 0 | 110 | 0 |
| C | 0 | 110 | 0 |
| D | 0 | 110 | 0 |
| Quadrant | Total seconds | Saturated seconds | Saturation percentage |
|---|---|---|---|
| A | 5333 | 1354 | 25.389087% |
| B | 5333 | 728 | 13.650853% |
| C | 5333 | 147 | 2.756422% |
| D | 5334 | 387 | 7.255343% |
Noise dominated data is calculated using 1-second bins in cleaned event files. If a bin has >2000 counts, and if more than 50% of those come from <1% of pixels, then it is considered to be noise-dominated and hence unusable.
| Quadrant | # 1 sec bins | Bins with >0 counts | Bins with >2000 counts | High rate bins dominated by noise | Noise dominated (total time) | Noise dominated (detector-on time) | Marked lightcurve |
|---|---|---|---|---|---|---|---|
| A | 7335 | 5332 | 1155 | 1155 | 15.75% | 21.66% | 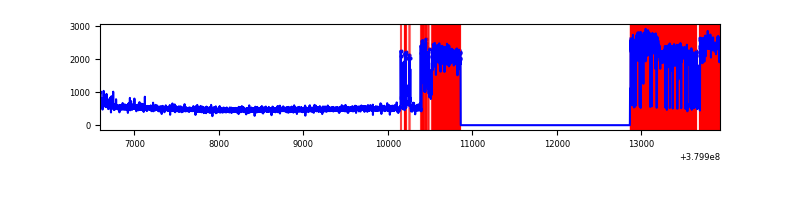 |
| B | 7336 | 5333 | 608 | 608 | 8.29% | 11.40% | 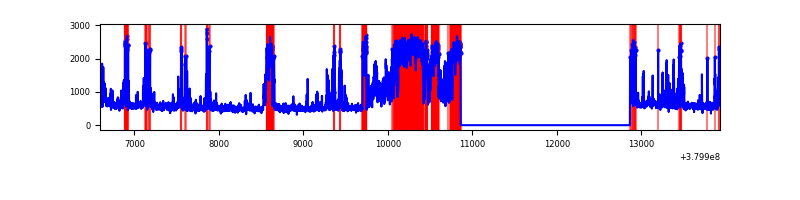 |
| C | 7336 | 5334 | 129 | 129 | 1.76% | 2.42% | 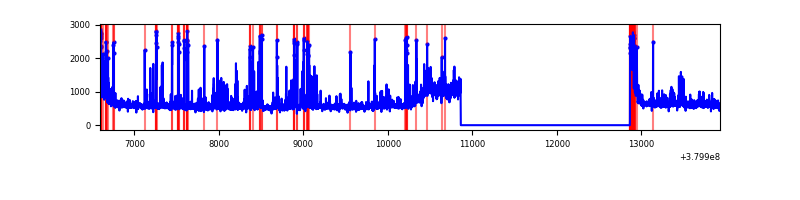 |
| D | 7337 | 5335 | 358 | 358 | 4.88% | 6.71% | 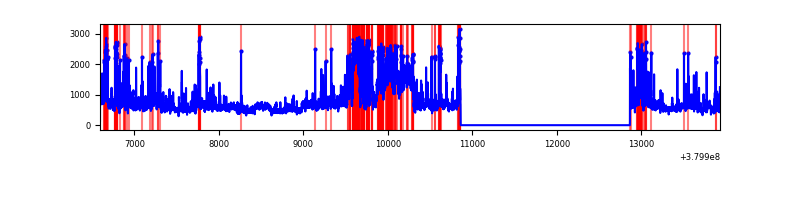 |
Top three noisy pixels from each quadrant. If the there are fewer than three noisy pixels in the level2.evt file, extra rows are filled as -1
| Pixel properties | Quadrant properties | ||||||
|---|---|---|---|---|---|---|---|
| Quadrant | DetID | PixID | Counts | Sigma | Mean | Median | Sigma |
| A | 15 | 169 | 2918250 | 25594.73 | 573 | 563 | 114.0 |
| A | 10 | 83 | 16053 | 135.88 | 573 | 563 | 114.0 |
| A | 7 | 16 | 12550 | 105.15 | 573 | 563 | 114.0 |
| B | 5 | 172 | 622484 | 4972.59 | 665 | 649 | 125.1 |
| B | 5 | 31 | 428535 | 3421.65 | 665 | 649 | 125.1 |
| B | 5 | 15 | 419629 | 3350.43 | 665 | 649 | 125.1 |
| C | 0 | 10 | 545157 | 3604.43 | 659 | 666 | 151.1 |
| C | 3 | 233 | 324641 | 2144.65 | 659 | 666 | 151.1 |
| C | 15 | 214 | 231953 | 1531.08 | 659 | 666 | 151.1 |
| D | 12 | 128 | 577503 | 3639.89 | 646 | 630 | 158.5 |
| D | 13 | 249 | 447960 | 2822.52 | 646 | 630 | 158.5 |
| D | 8 | 195 | 360816 | 2272.66 | 646 | 630 | 158.5 |
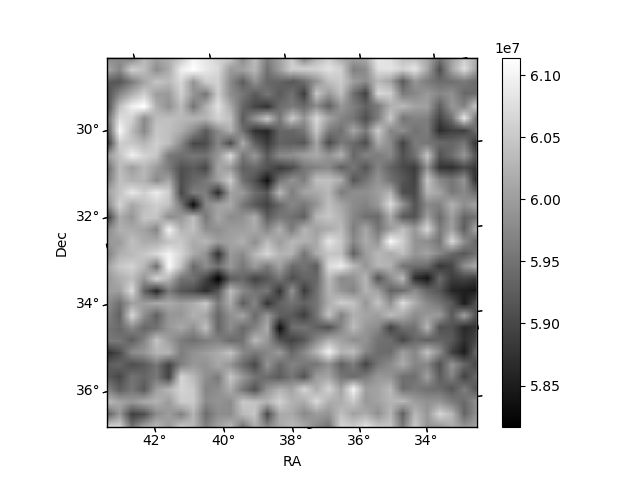
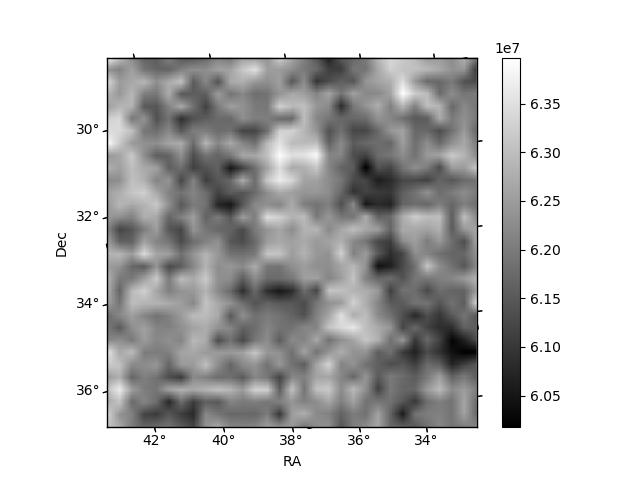
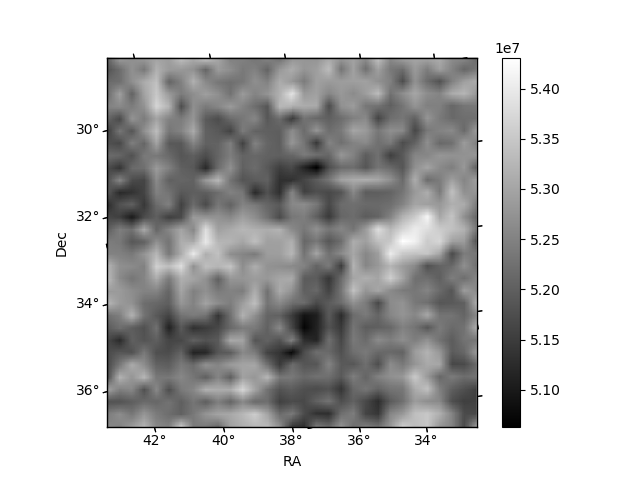
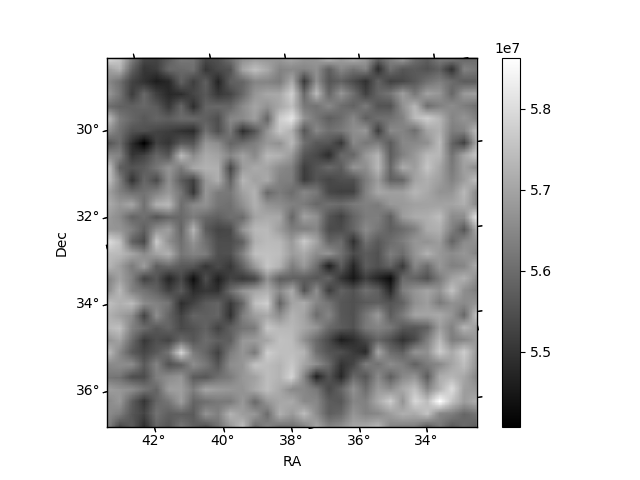
Histogram calculated using DETX and DETY for each event in the final _common_clean file
| Quadrant A | 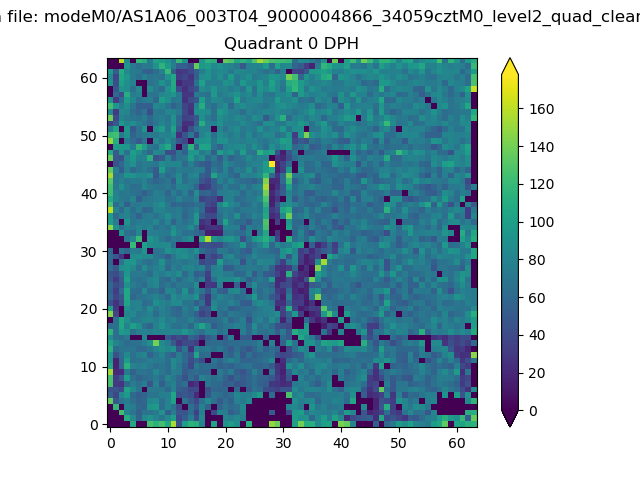 |
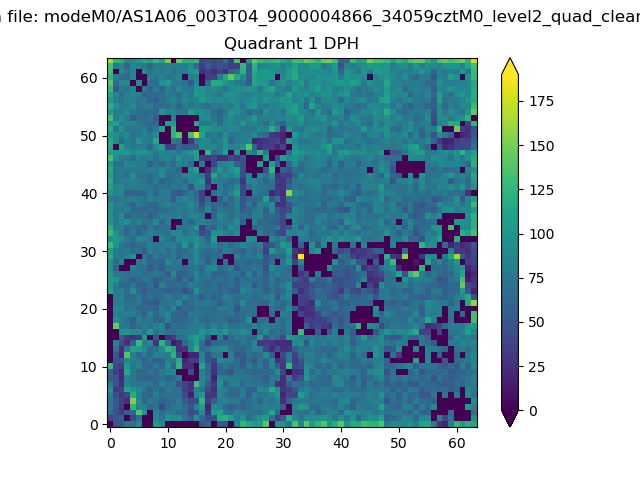 |
Quadrant B |
|---|---|---|---|
| Quadrant D | 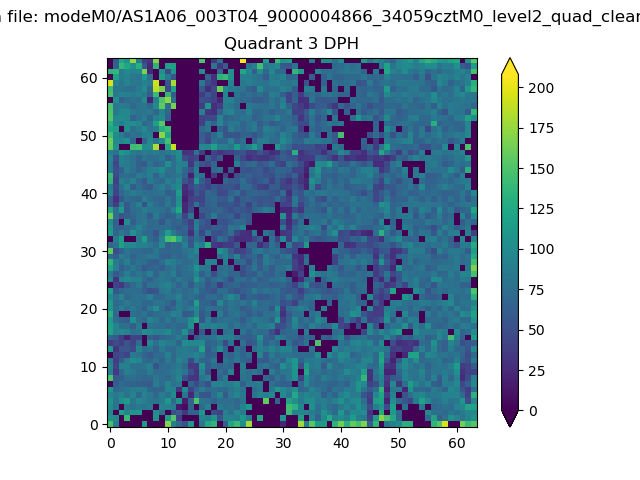 |
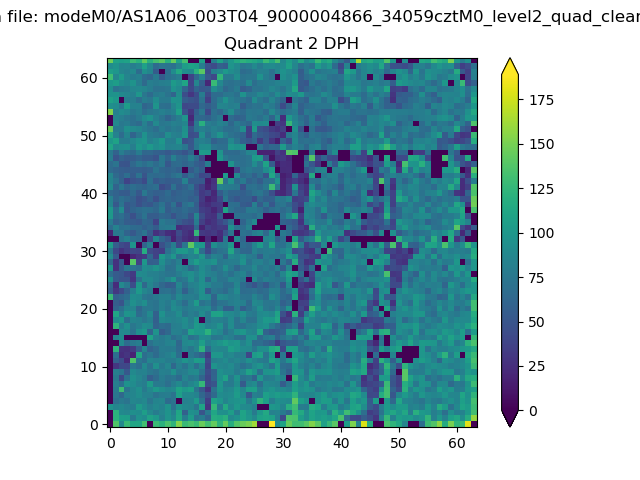 |
Quadrant C |
| Plot type | Count rate plots | Images |
|---|---|---|
| Comparison with Poisson distribution Blue bars denote a histogram of data divided into 1 sec bins. Red curve is a Poisson curve with rate = median count rate of data. |
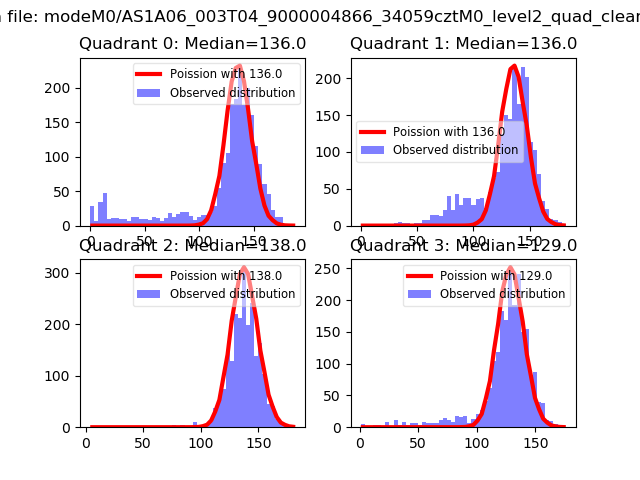 |
 |
| Quadrant-wise count rates Data is divided into 100 sec bins |
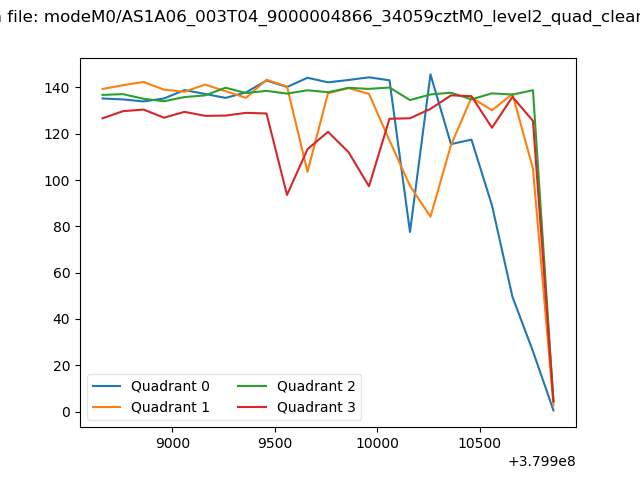 |
|
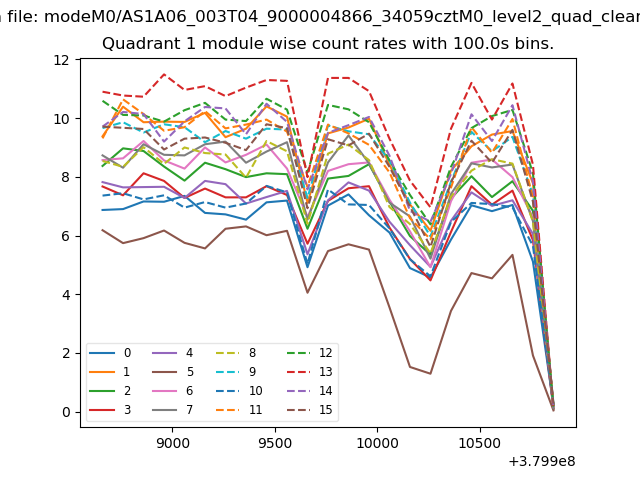
| Module-wise count rates for Quadrant A Data is divided into 100 sec bins |
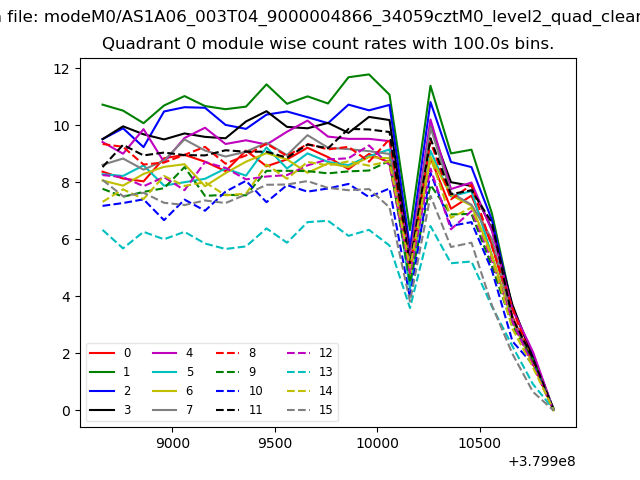 |
 |
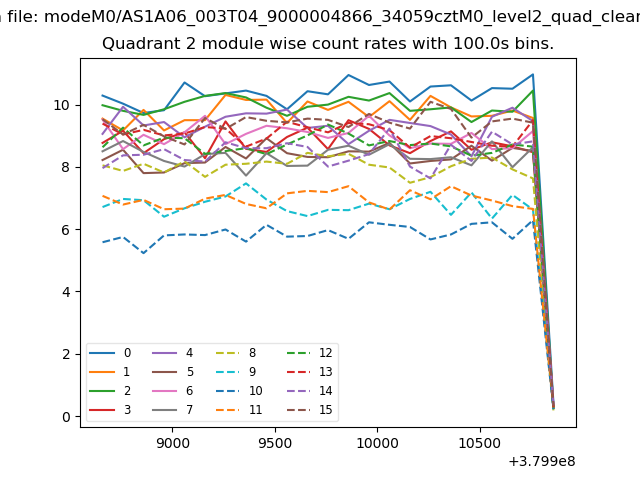
| Module-wise count rates for Quadrant B Data is divided into 100 sec bins |
 |
 |
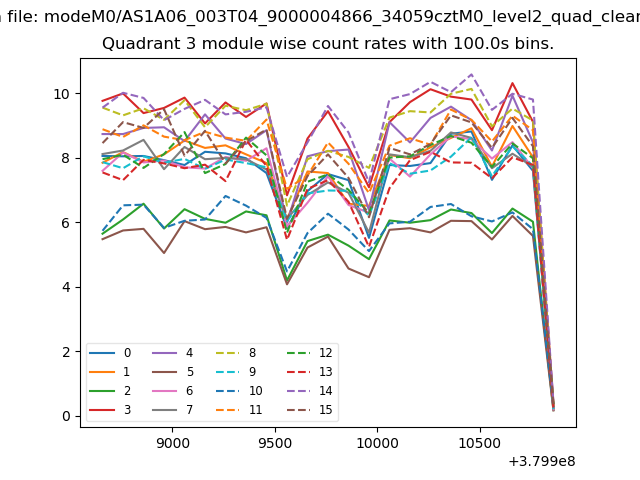
| Module-wise count rates for Quadrant C Data is divided into 100 sec bins |
 |
 |
| Module-wise count rates for Quadrant D Data is divided into 100 sec bins |
 |
 |
| Parameter | Plot |
|---|---|
| CZT HV Monitor | 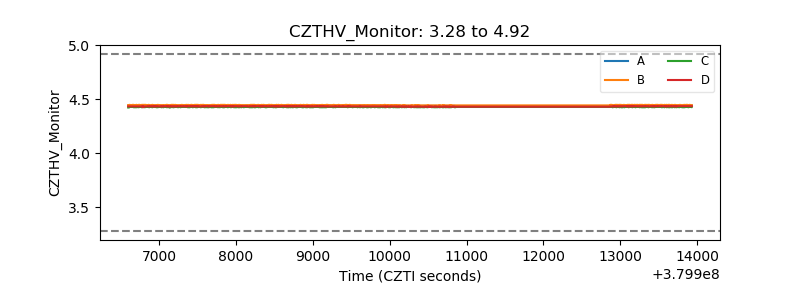 |
| D_VDD | 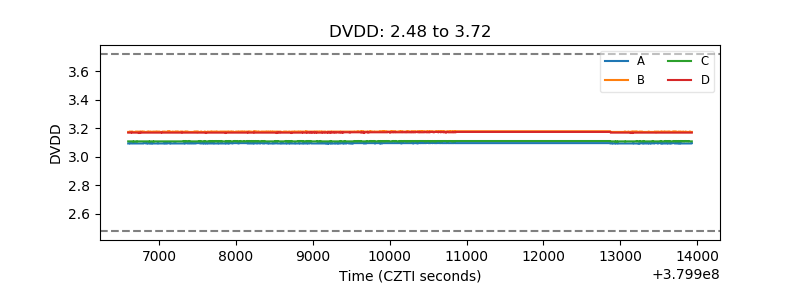 |
| Temperature 1 | 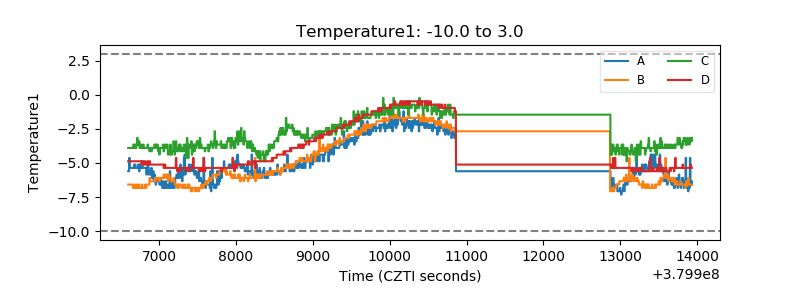 |
| Veto HV Monitor | 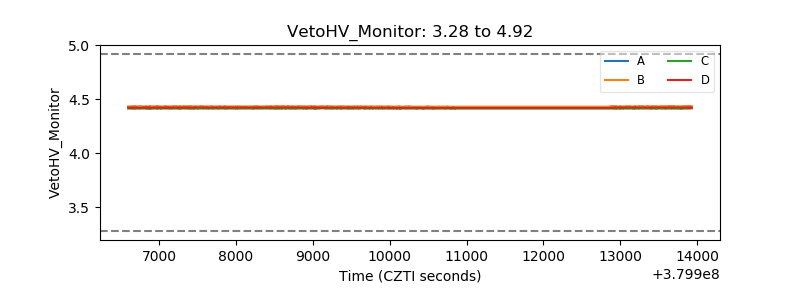 |
| Veto LLD | 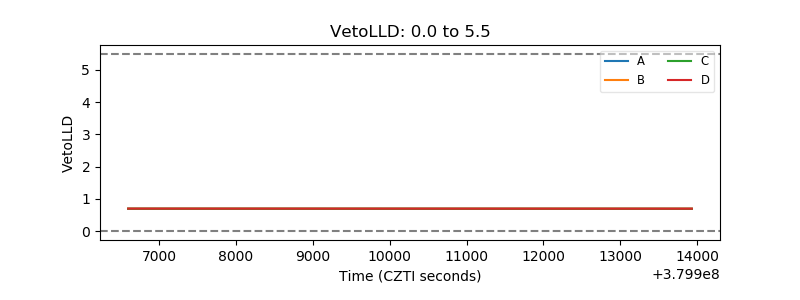 |
| Alpha Counter | 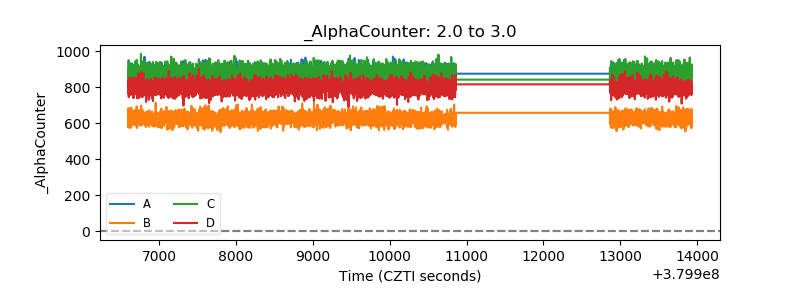 |
| _CPM_Rate | 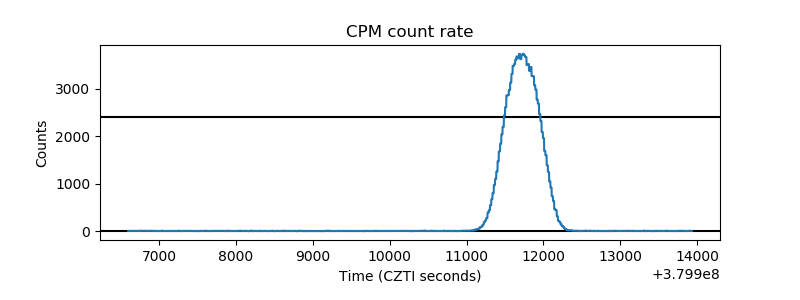 |
| CZT Counter | 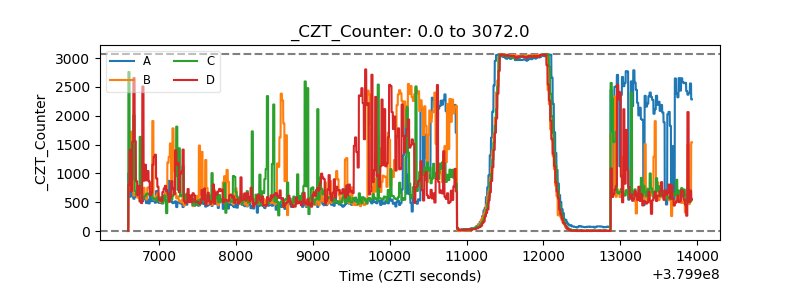 |
| +2.5 Volts monitor |  |
| +5 Volts monitor |  |
| _ROLL_ROT | 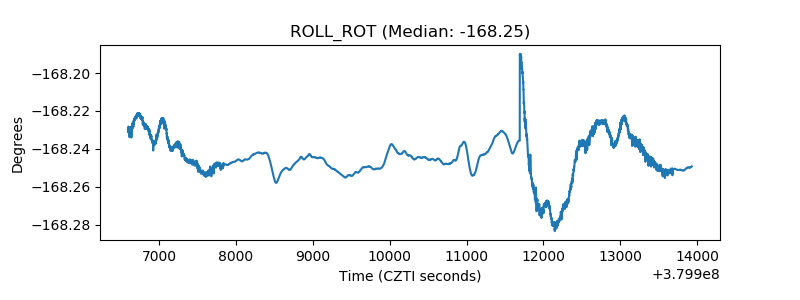 |
| _Roll_DEC | 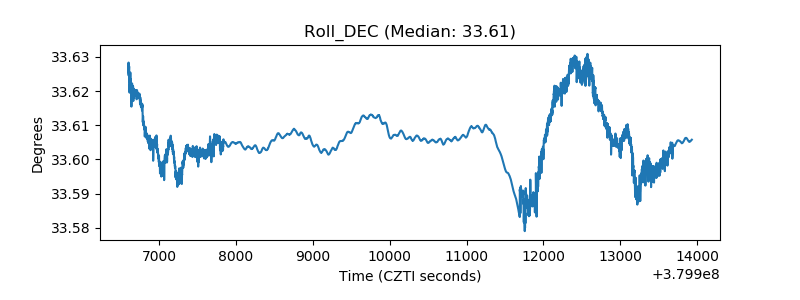 |
| _Roll_RA |  |
| Veto Counter | 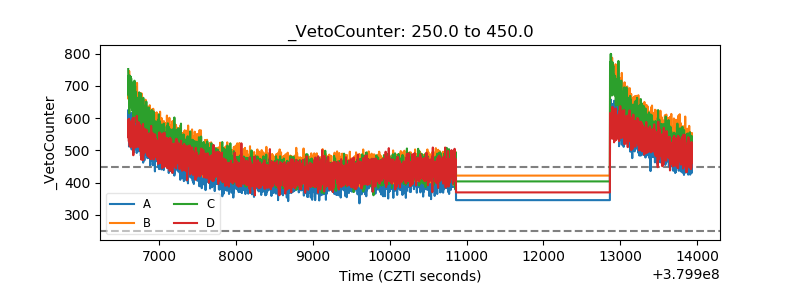 |