| Param | Original file | Final file |
|---|---|---|
| Filename | modeM0/AS1A06_003T04_9000004866_34060cztM0_level2.evt | modeM0/AS1A06_003T04_9000004866_34060cztM0_level2_quad_clean.evt |
| Size (bytes) | 685,578,240 | 54,590,400 |
| Size | 653.8 MB | 52.1 MB |
| Events in quadrant A | 8,471,869 | 247,240 |
| Events in quadrant B | 4,781,616 | 339,639 |
| Events in quadrant C | 3,451,215 | 362,224 |
| Events in quadrant D | 3,712,518 | 344,179 |
| Mode M9 | |||
|---|---|---|---|
| Quadrant | BADHDUFLAG | Total packets | Discarded packets |
| A | 0 | 22 | 0 |
| B | 0 | 22 | 0 |
| C | 0 | 22 | 0 |
| D | 0 | 23 | 0 |
| Mode M0 | |||
|---|---|---|---|
| Quadrant | BADHDUFLAG | Total packets | Discarded packets |
| A | 0 | 28777 | 3 |
| B | 0 | 17671 | 2 |
| C | 0 | 13850 | 2 |
| D | 0 | 14704 | 2 |
| Mode SS | |||
|---|---|---|---|
| Quadrant | BADHDUFLAG | Total packets | Discarded packets |
| A | 0 | 104 | 0 |
| B | 0 | 104 | 0 |
| C | 0 | 104 | 0 |
| D | 0 | 104 | 0 |
| Quadrant | Total seconds | Saturated seconds | Saturation percentage |
|---|---|---|---|
| A | 5118 | 2540 | 49.628761% |
| B | 5118 | 663 | 12.954279% |
| C | 5118 | 94 | 1.836655% |
| D | 5118 | 107 | 2.090660% |
Noise dominated data is calculated using 1-second bins in cleaned event files. If a bin has >2000 counts, and if more than 50% of those come from <1% of pixels, then it is considered to be noise-dominated and hence unusable.
| Quadrant | # 1 sec bins | Bins with >0 counts | Bins with >2000 counts | High rate bins dominated by noise | Noise dominated (total time) | Noise dominated (detector-on time) | Marked lightcurve |
|---|---|---|---|---|---|---|---|
| A | 7210 | 5119 | 2388 | 2388 | 33.12% | 46.65% | 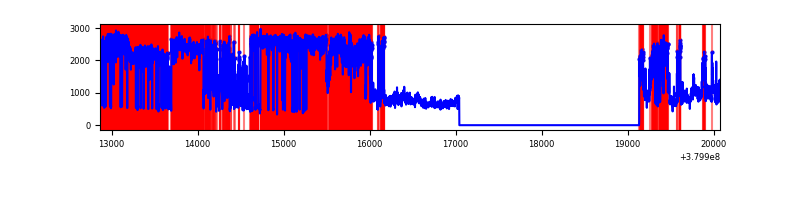 |
| B | 7210 | 5118 | 530 | 530 | 7.35% | 10.36% | 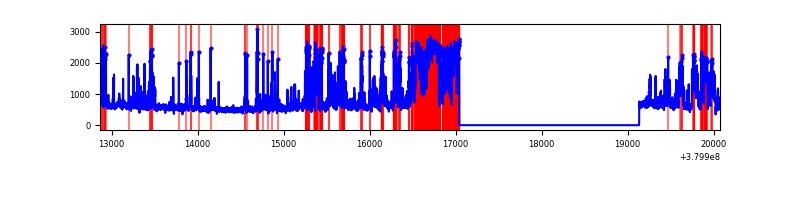 |
| C | 7210 | 5119 | 83 | 83 | 1.15% | 1.62% | 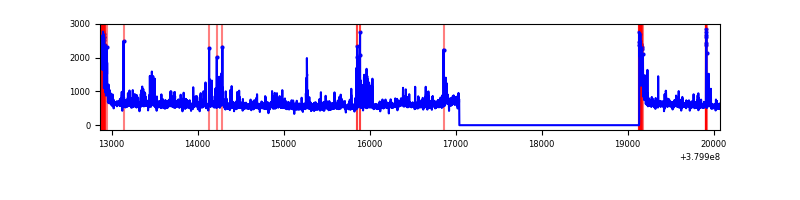 |
| D | 7210 | 5119 | 96 | 96 | 1.33% | 1.88% | 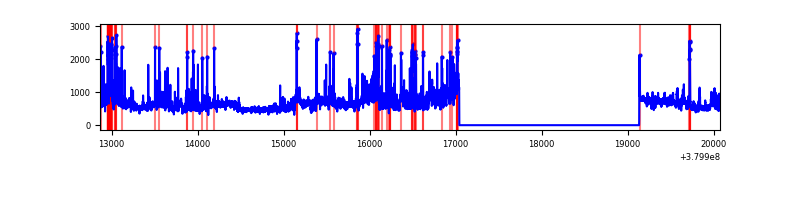 |
Top three noisy pixels from each quadrant. If the there are fewer than three noisy pixels in the level2.evt file, extra rows are filled as -1
| Pixel properties | Quadrant properties | ||||||
|---|---|---|---|---|---|---|---|
| Quadrant | DetID | PixID | Counts | Sigma | Mean | Median | Sigma |
| A | 15 | 169 | 6631764 | 70481.01 | 470 | 462 | 94.1 |
| A | 10 | 83 | 15545 | 160.31 | 470 | 462 | 94.1 |
| A | 7 | 16 | 10008 | 101.46 | 470 | 462 | 94.1 |
| B | 5 | 172 | 672276 | 5510.02 | 649 | 635 | 121.9 |
| B | 5 | 31 | 400144 | 3277.5 | 649 | 635 | 121.9 |
| B | 5 | 15 | 391383 | 3205.63 | 649 | 635 | 121.9 |
| C | 0 | 10 | 308289 | 2089.81 | 647 | 654 | 147.2 |
| C | 15 | 214 | 225336 | 1526.3 | 647 | 654 | 147.2 |
| C | 3 | 233 | 148154 | 1001.99 | 647 | 654 | 147.2 |
| D | 8 | 195 | 468242 | 2957.08 | 646 | 629 | 158.1 |
| D | 13 | 249 | 289793 | 1828.61 | 646 | 629 | 158.1 |
| D | 13 | 168 | 199862 | 1259.9 | 646 | 629 | 158.1 |
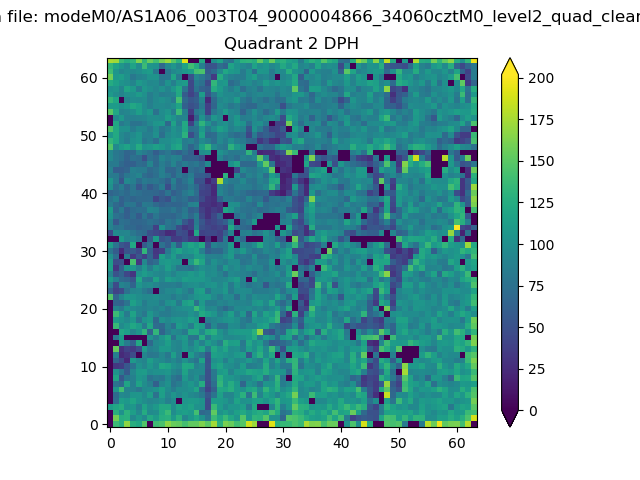
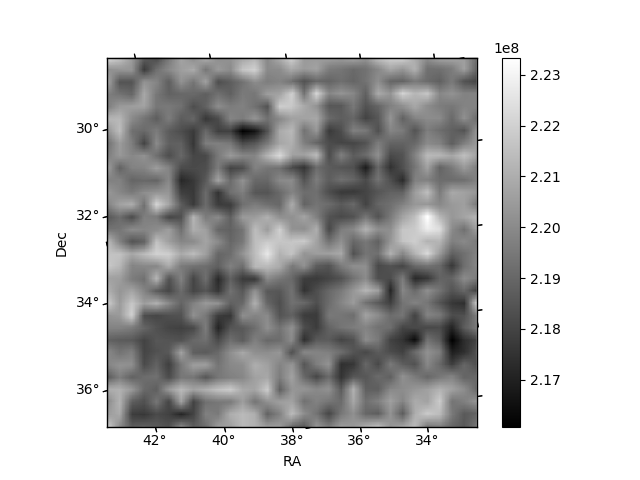
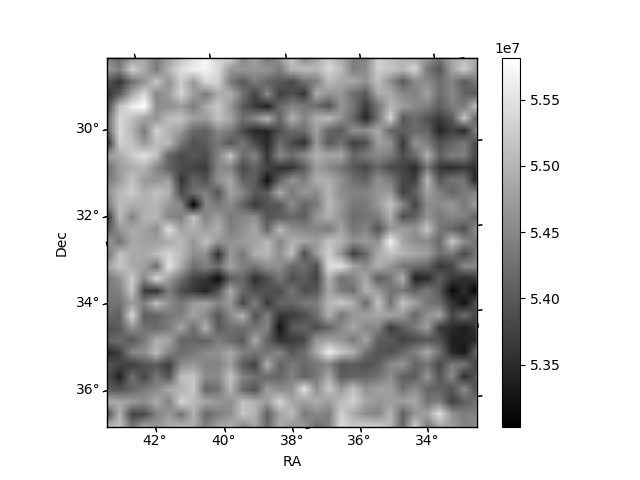
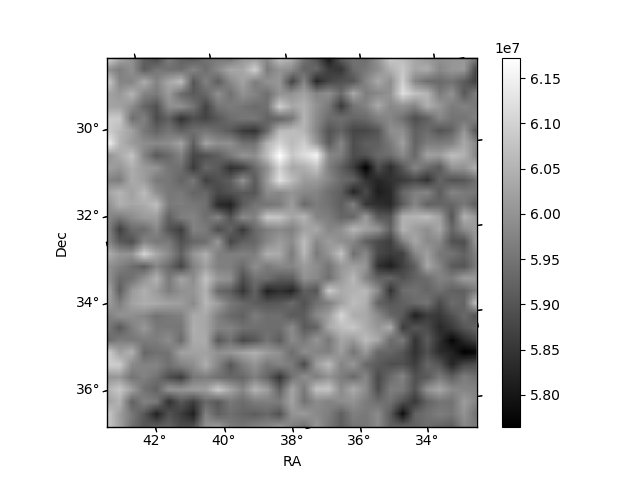
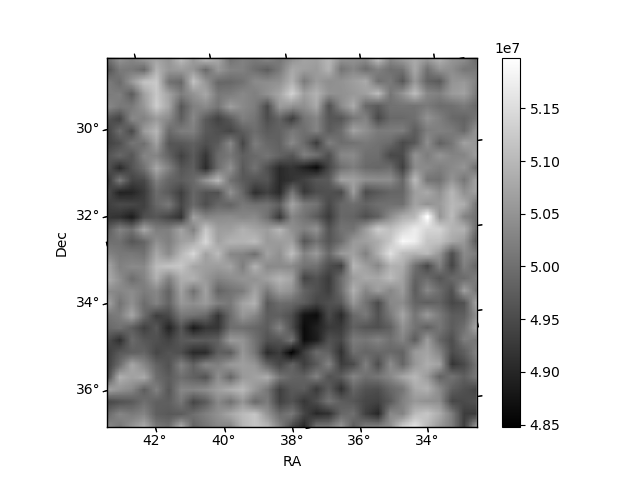
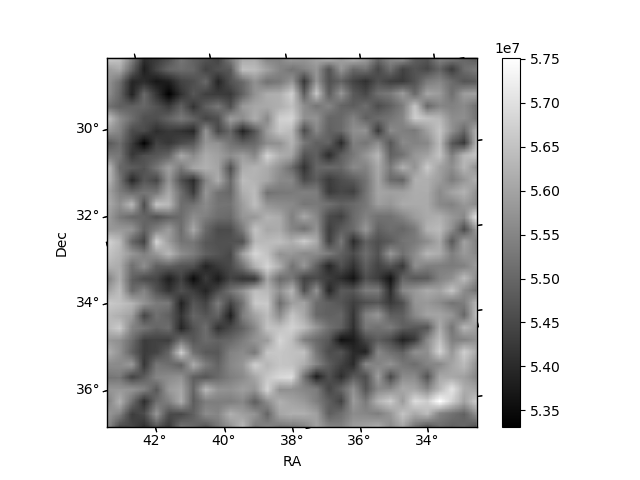
Histogram calculated using DETX and DETY for each event in the final _common_clean file
| Quadrant A | 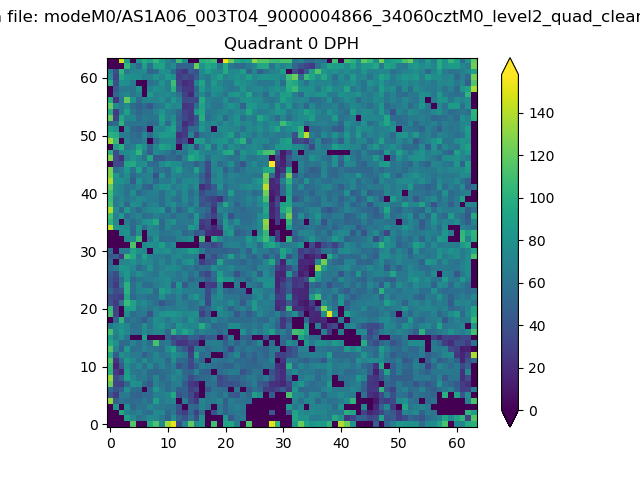 |
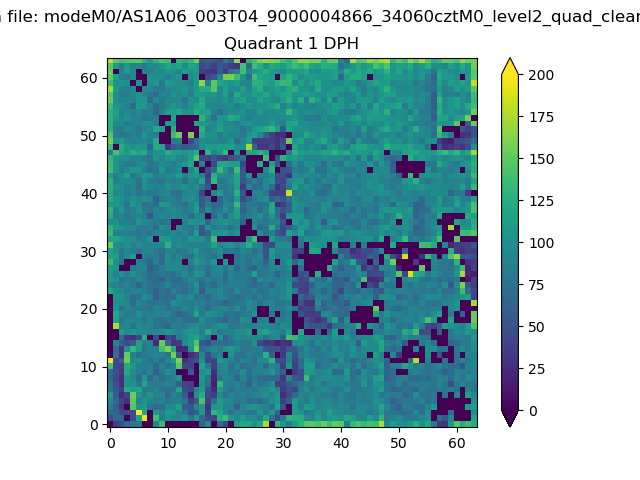 |
Quadrant B |
|---|---|---|---|
| Quadrant D | 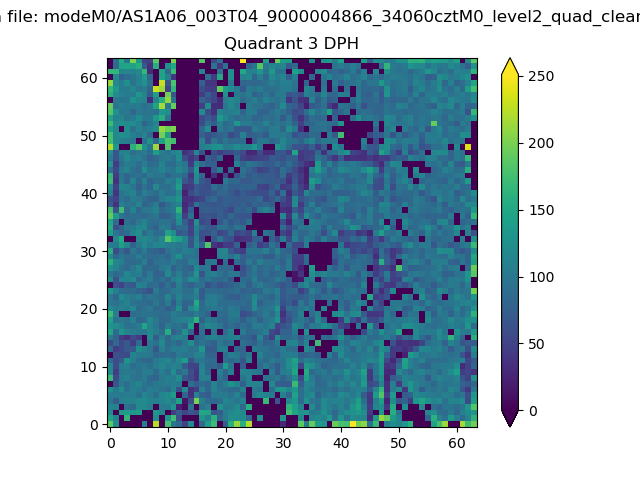 |
 |
Quadrant C |
| Plot type | Count rate plots | Images |
|---|---|---|
| Comparison with Poisson distribution Blue bars denote a histogram of data divided into 1 sec bins. Red curve is a Poisson curve with rate = median count rate of data. |
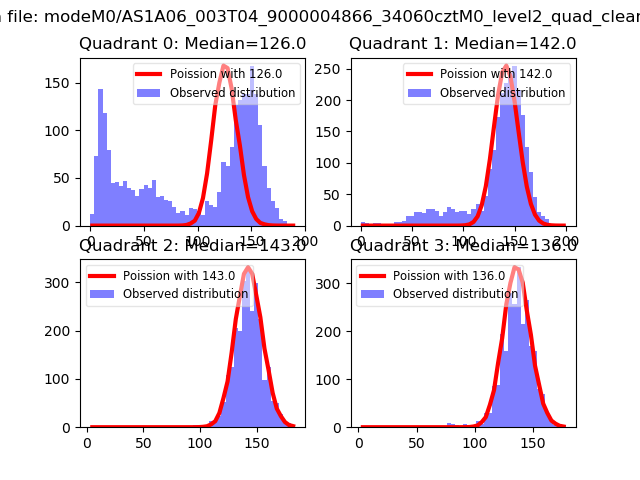 |
 |
| Quadrant-wise count rates Data is divided into 100 sec bins |
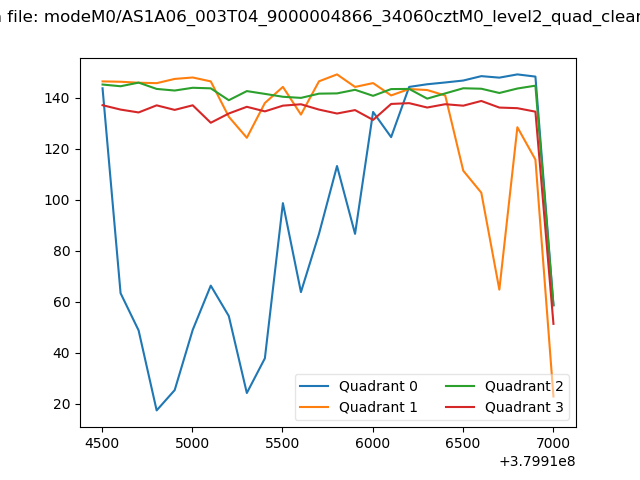 |
|
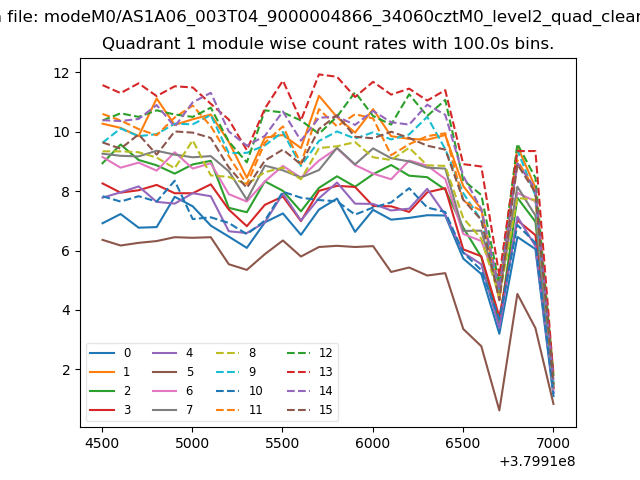
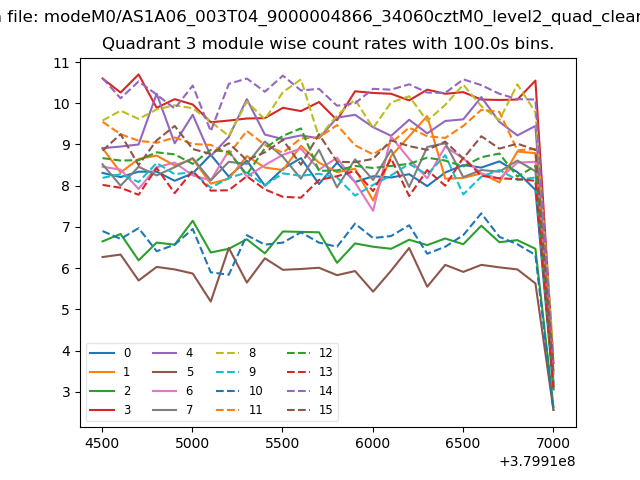
| Module-wise count rates for Quadrant A Data is divided into 100 sec bins |
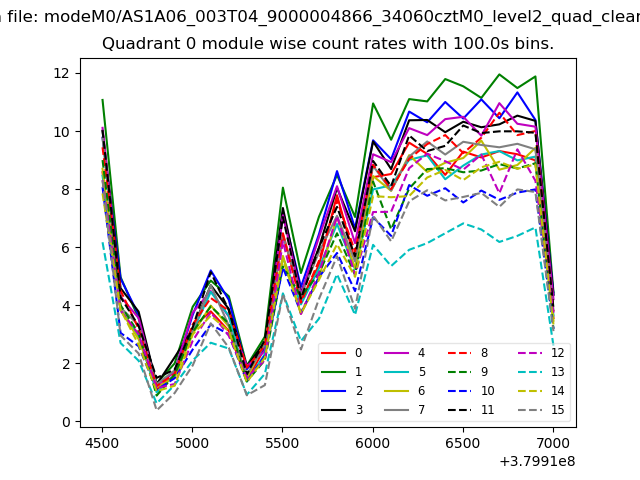 |
 |
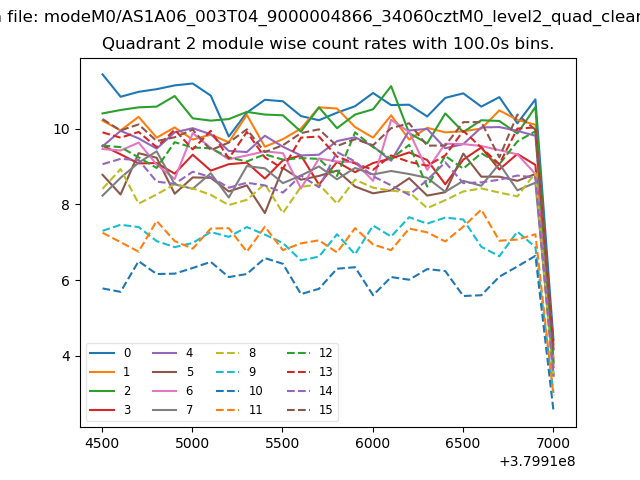
| Module-wise count rates for Quadrant B Data is divided into 100 sec bins |
 |
 |
| Module-wise count rates for Quadrant C Data is divided into 100 sec bins |
 |
 |
| Module-wise count rates for Quadrant D Data is divided into 100 sec bins |
 |
 |
| Parameter | Plot |
|---|---|
| CZT HV Monitor | 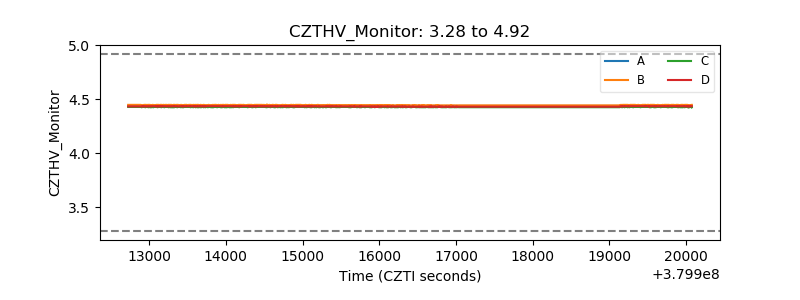 |
| D_VDD |  |
| Temperature 1 | 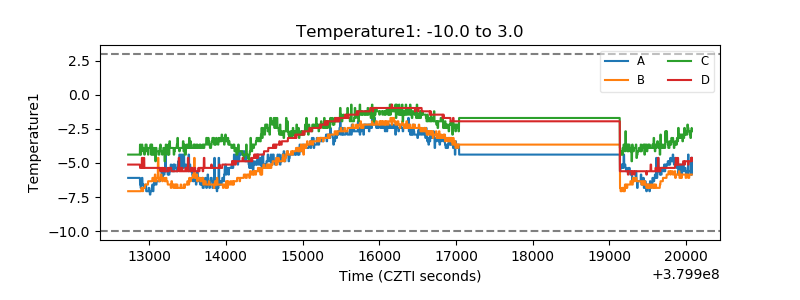 |
| Veto HV Monitor |  |
| Veto LLD | 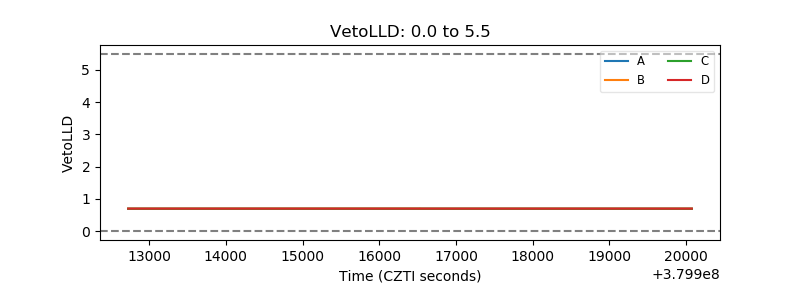 |
| Alpha Counter | 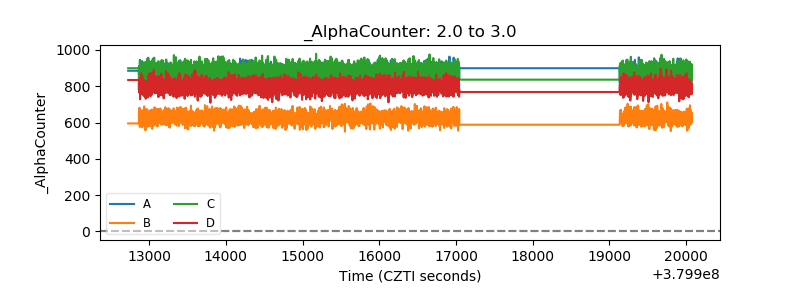 |
| _CPM_Rate | 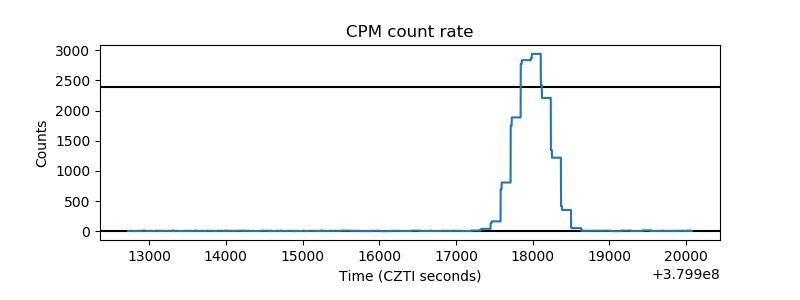 |
| CZT Counter | 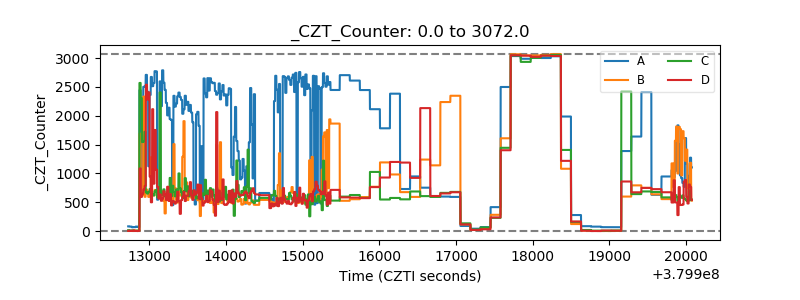 |
| +2.5 Volts monitor |  |
| +5 Volts monitor |  |
| _ROLL_ROT | 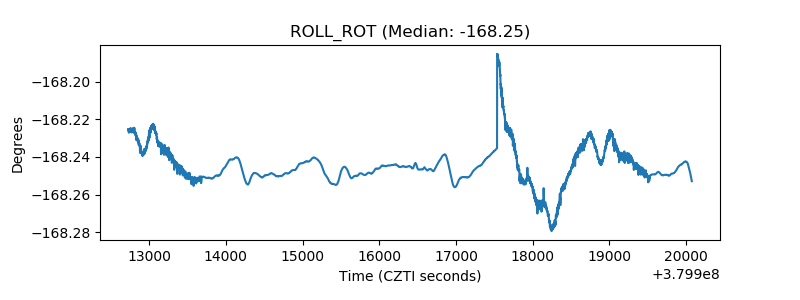 |
| _Roll_DEC | 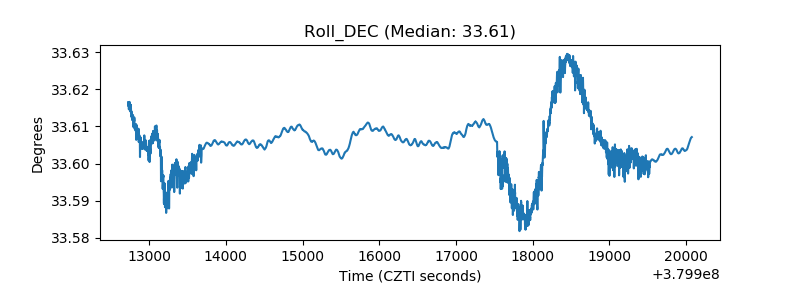 |
| _Roll_RA | 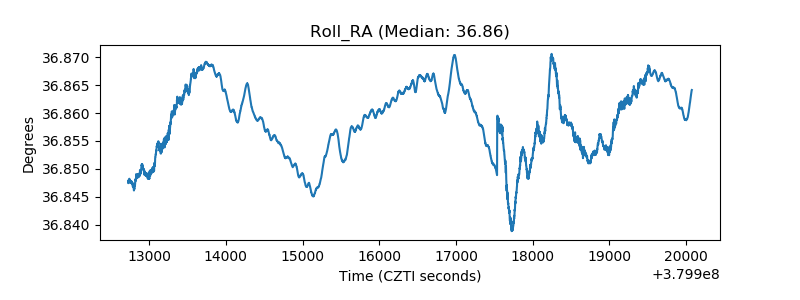 |
| Veto Counter | 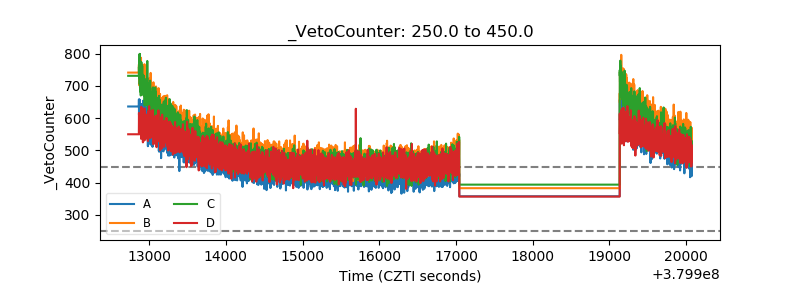 |