| Param | Original file | Final file |
|---|---|---|
| Filename | modeM0/AS1A06_003T04_9000004866_34061cztM0_level2.evt | modeM0/AS1A06_003T04_9000004866_34061cztM0_level2_quad_clean.evt |
| Size (bytes) | 615,623,040 | 58,564,800 |
| Size | 587.1 MB | 55.9 MB |
| Events in quadrant A | 5,063,139 | 395,789 |
| Events in quadrant B | 6,506,172 | 299,926 |
| Events in quadrant C | 2,854,415 | 406,331 |
| Events in quadrant D | 3,944,300 | 381,229 |
| Mode M9 | |||
|---|---|---|---|
| Quadrant | BADHDUFLAG | Total packets | Discarded packets |
| A | 0 | 6 | 0 |
| B | 0 | 6 | 0 |
| C | 0 | 6 | 0 |
| D | 0 | 7 | 0 |
| Mode M0 | |||
|---|---|---|---|
| Quadrant | BADHDUFLAG | Total packets | Discarded packets |
| A | 0 | 17946 | 1 |
| B | 0 | 22099 | 1 |
| C | 0 | 11380 | 1 |
| D | 0 | 14637 | 1 |
| Mode SS | |||
|---|---|---|---|
| Quadrant | BADHDUFLAG | Total packets | Discarded packets |
| A | 0 | 82 | 0 |
| B | 0 | 82 | 0 |
| C | 0 | 82 | 0 |
| D | 0 | 82 | 0 |
| Quadrant | Total seconds | Saturated seconds | Saturation percentage |
|---|---|---|---|
| A | 4098 | 664 | 16.203026% |
| B | 4098 | 1941 | 47.364568% |
| C | 4098 | 104 | 2.537823% |
| D | 4098 | 152 | 3.709126% |
Noise dominated data is calculated using 1-second bins in cleaned event files. If a bin has >2000 counts, and if more than 50% of those come from <1% of pixels, then it is considered to be noise-dominated and hence unusable.
| Quadrant | # 1 sec bins | Bins with >0 counts | Bins with >2000 counts | High rate bins dominated by noise | Noise dominated (total time) | Noise dominated (detector-on time) | Marked lightcurve |
|---|---|---|---|---|---|---|---|
| A | 4098 | 4098 | 551 | 551 | 13.45% | 13.45% | 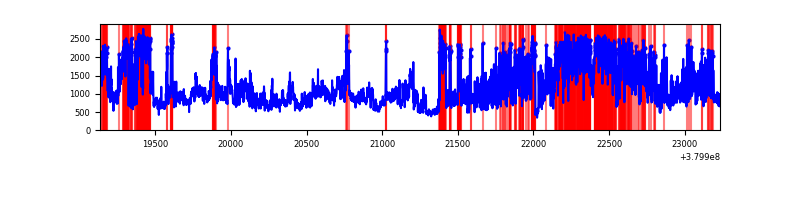 |
| B | 4097 | 4097 | 1846 | 1846 | 45.06% | 45.06% | 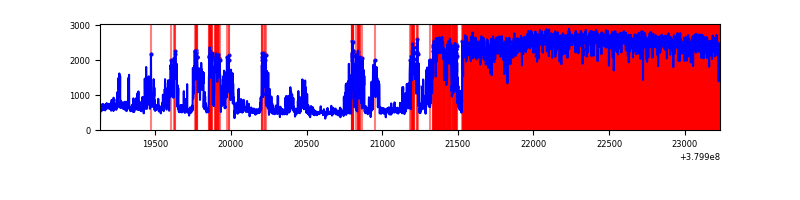 |
| C | 4098 | 4098 | 99 | 99 | 2.42% | 2.42% | 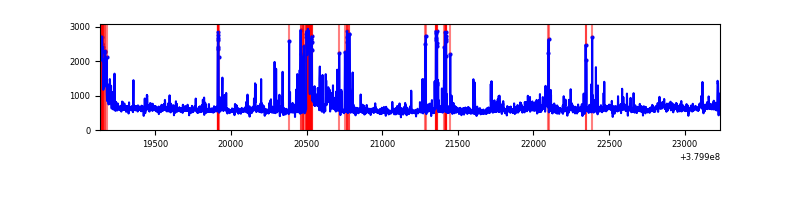 |
| D | 4098 | 4098 | 116 | 116 | 2.83% | 2.83% | 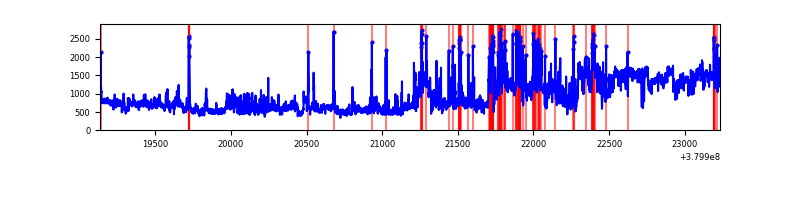 |
Top three noisy pixels from each quadrant. If the there are fewer than three noisy pixels in the level2.evt file, extra rows are filled as -1
| Pixel properties | Quadrant properties | ||||||
|---|---|---|---|---|---|---|---|
| Quadrant | DetID | PixID | Counts | Sigma | Mean | Median | Sigma |
| A | 15 | 169 | 3064977 | 30349.33 | 511 | 503 | 101.0 |
| A | 10 | 83 | 10323 | 97.25 | 511 | 503 | 101.0 |
| A | 7 | 144 | 8287 | 77.09 | 511 | 503 | 101.0 |
| B | 5 | 31 | 1867770 | 22665.05 | 431 | 422 | 82.4 |
| B | 5 | 15 | 1673030 | 20301.38 | 431 | 422 | 82.4 |
| B | 5 | 14 | 879870 | 10674.35 | 431 | 422 | 82.4 |
| C | 15 | 214 | 176494 | 1518.53 | 505 | 512 | 115.9 |
| C | 0 | 10 | 168391 | 1448.61 | 505 | 512 | 115.9 |
| C | 0 | 207 | 162707 | 1399.56 | 505 | 512 | 115.9 |
| D | 13 | 168 | 975267 | 7816.21 | 508 | 493 | 124.7 |
| D | 8 | 195 | 540909 | 4333.32 | 508 | 493 | 124.7 |
| D | 13 | 249 | 143725 | 1148.5 | 508 | 493 | 124.7 |
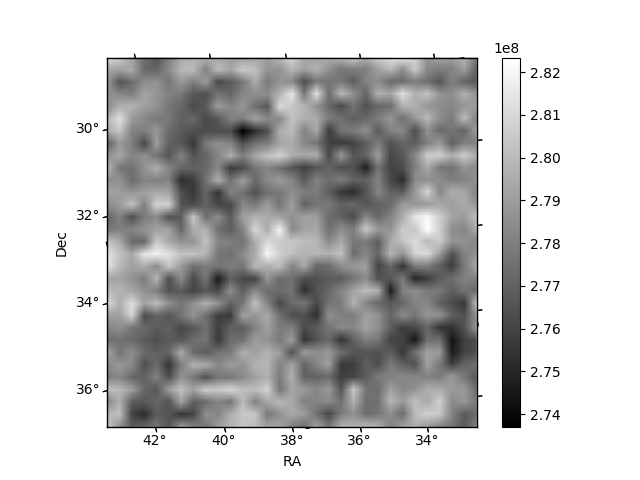
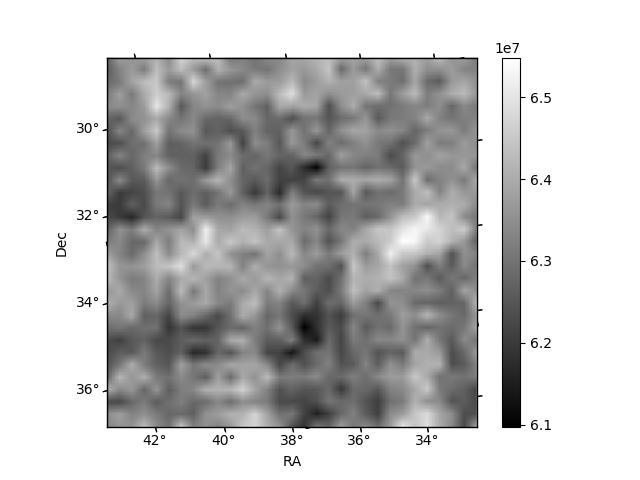
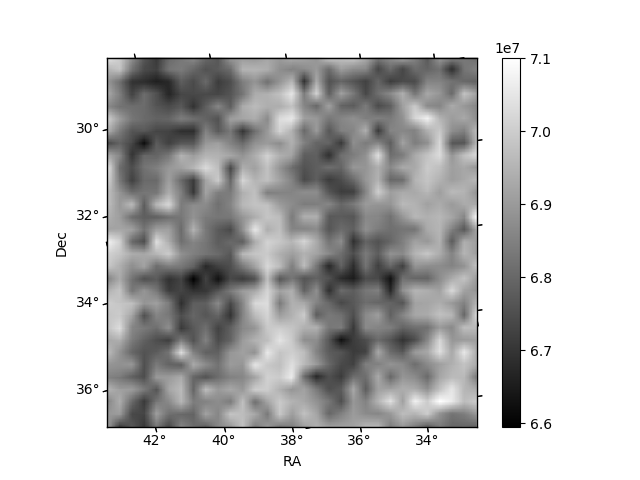
Histogram calculated using DETX and DETY for each event in the final _common_clean file
| Quadrant A | 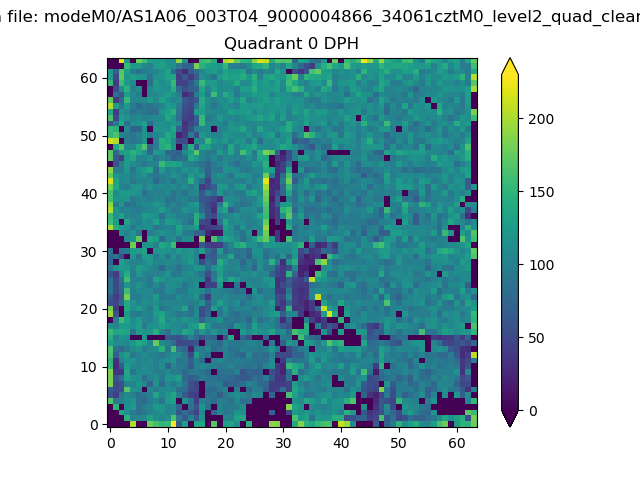 |
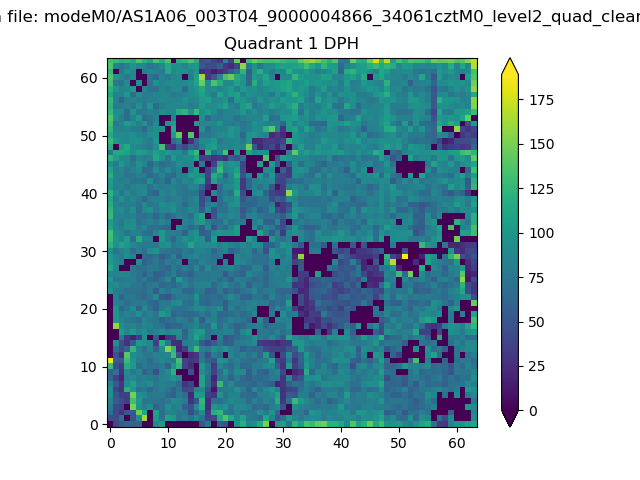 |
Quadrant B |
|---|---|---|---|
| Quadrant D | 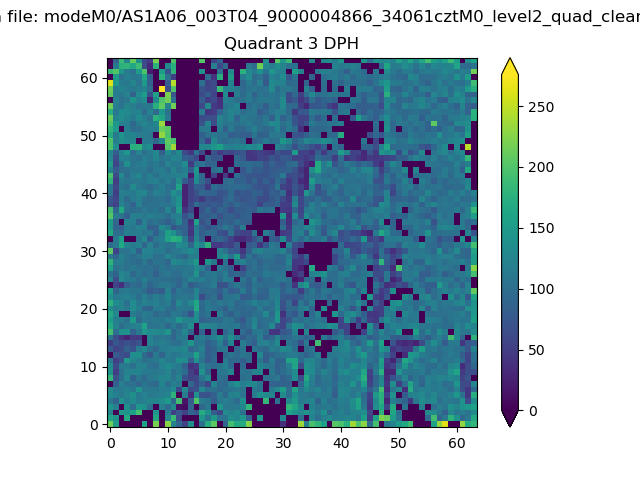 |
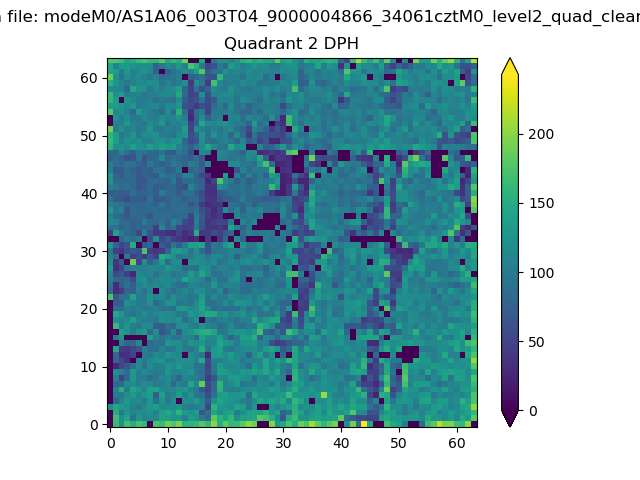 |
Quadrant C |
| Plot type | Count rate plots | Images |
|---|---|---|
| Comparison with Poisson distribution Blue bars denote a histogram of data divided into 1 sec bins. Red curve is a Poisson curve with rate = median count rate of data. |
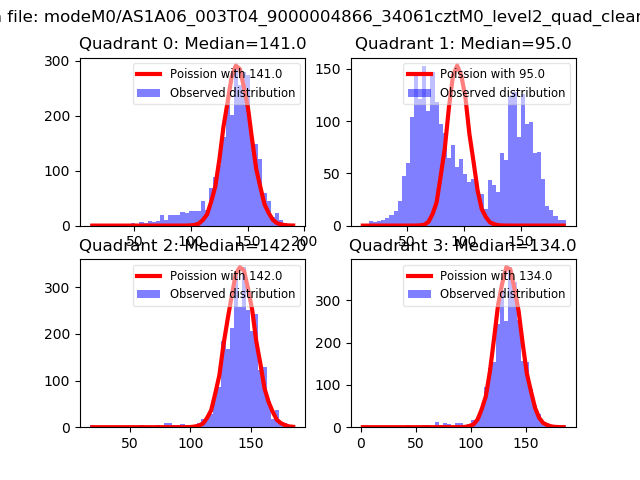 |
 |
| Quadrant-wise count rates Data is divided into 100 sec bins |
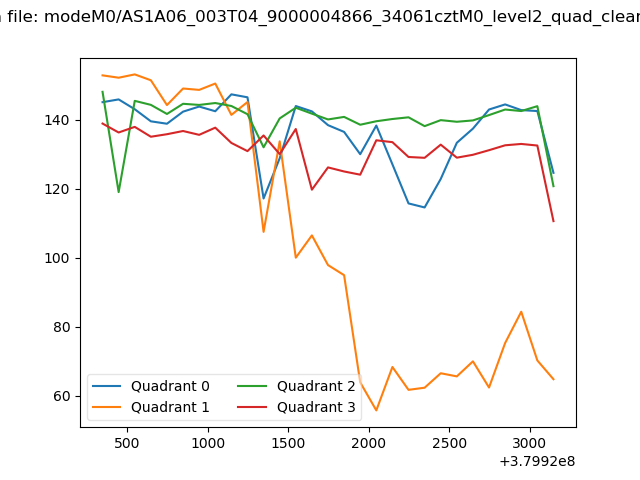 |
|
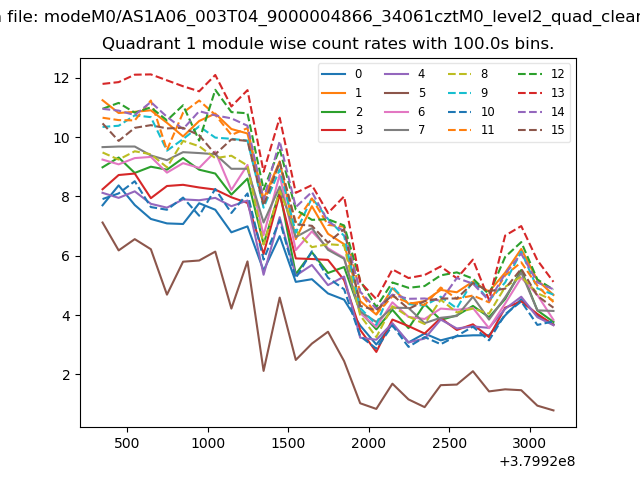
| Module-wise count rates for Quadrant A Data is divided into 100 sec bins |
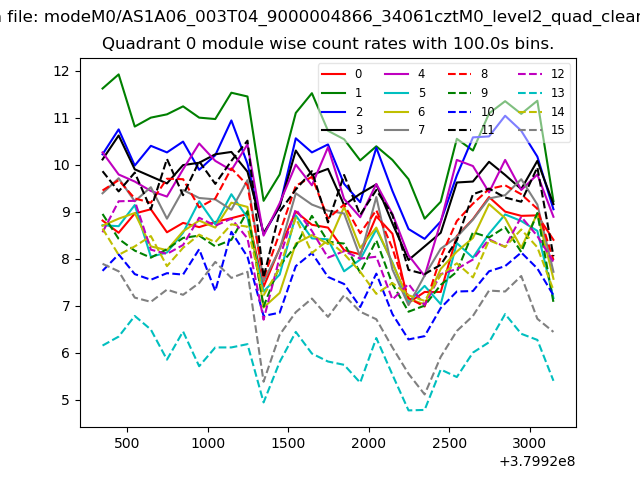 |
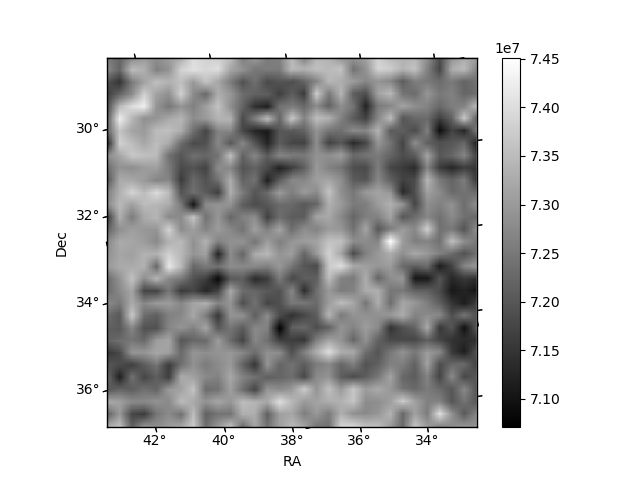 |
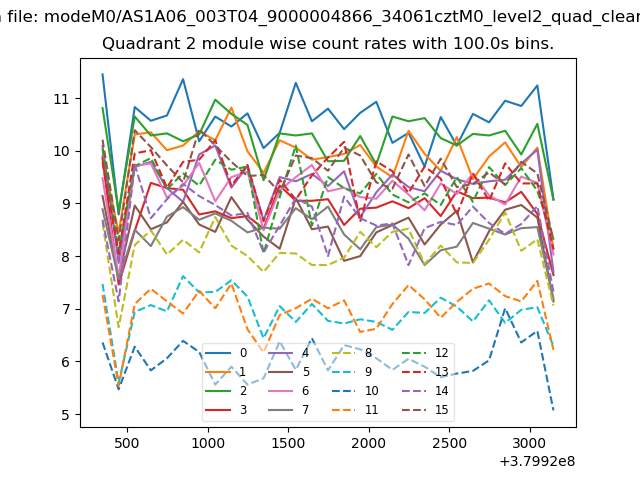
| Module-wise count rates for Quadrant B Data is divided into 100 sec bins |
 |
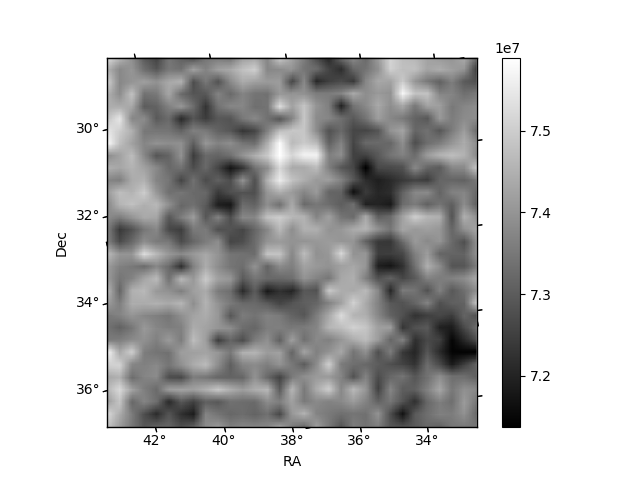 |
| Module-wise count rates for Quadrant C Data is divided into 100 sec bins |
 |
 |
| Module-wise count rates for Quadrant D Data is divided into 100 sec bins |
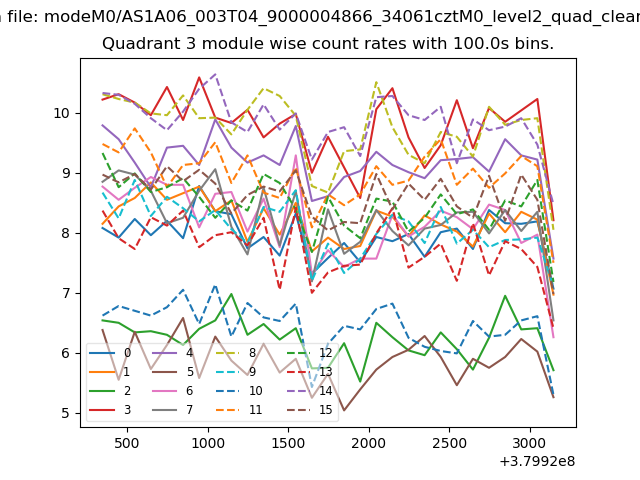 |
 |
| Parameter | Plot |
|---|---|
| CZT HV Monitor |  |
| D_VDD | 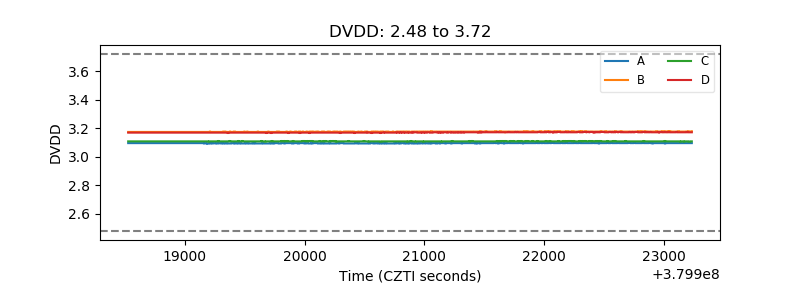 |
| Temperature 1 | 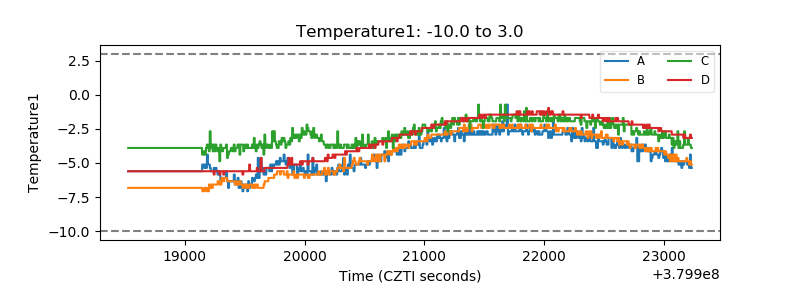 |
| Veto HV Monitor | 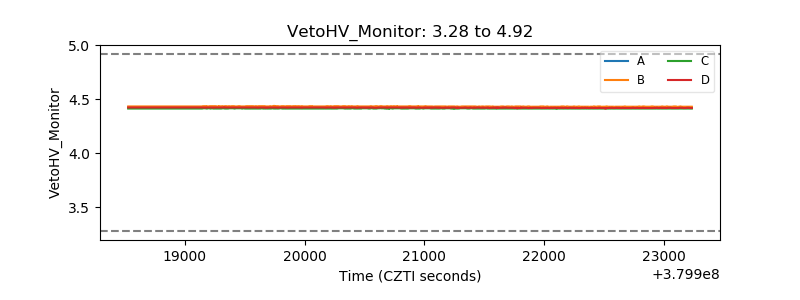 |
| Veto LLD | 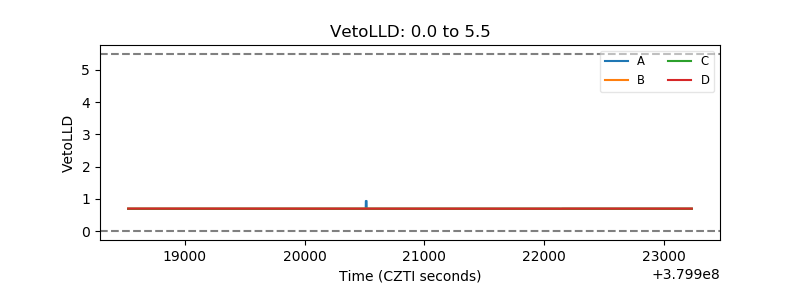 |
| Alpha Counter |  |
| _CPM_Rate |  |
| CZT Counter | 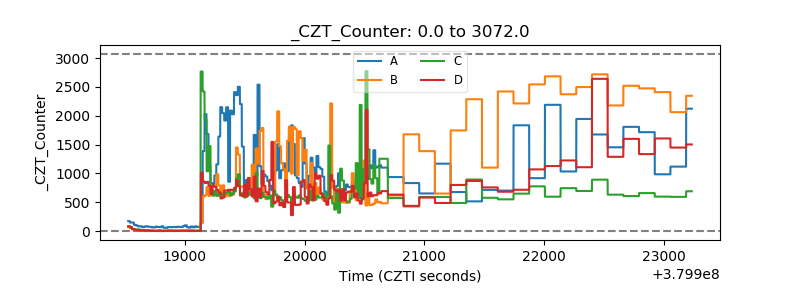 |
| +2.5 Volts monitor |  |
| +5 Volts monitor |  |
| _ROLL_ROT | 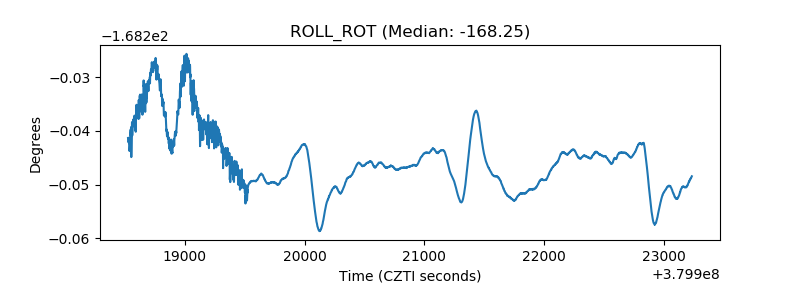 |
| _Roll_DEC | 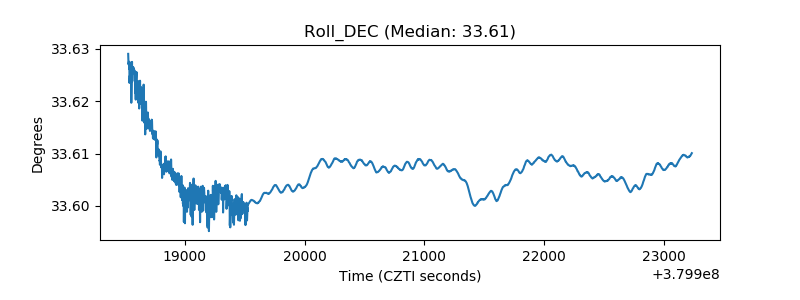 |
| _Roll_RA | 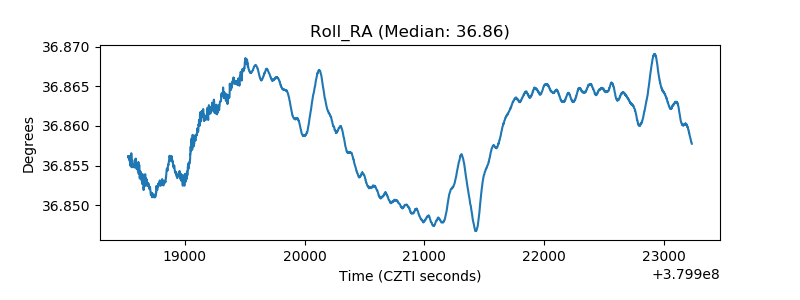 |
| Veto Counter | 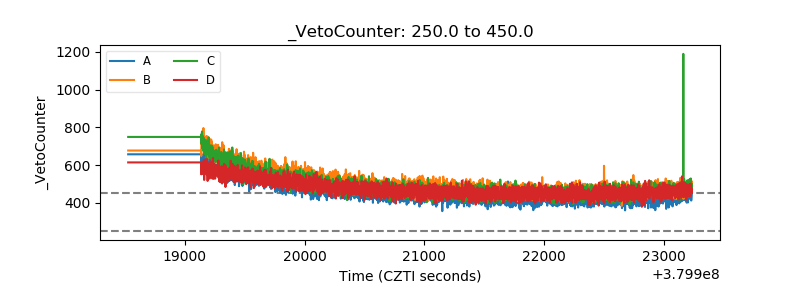 |