| Param | Original file | Final file |
|---|---|---|
| Filename | modeM0/AS1C07_001T04_9000004868cztM0_level2.fits | modeM0/AS1C07_001T04_9000004868cztM0_level2_quad_clean.evt |
| Size (bytes) | 769,861,440 | 931,078,080 |
| Size | 734.2 MB | 887.9 MB |
| Events in quadrant A | 4,751,166 | 6,012,188 |
| Events in quadrant B | 4,275,002 | 5,416,143 |
| Events in quadrant C | 4,619,320 | 5,839,273 |
| Events in quadrant D | 3,933,558 | 5,206,134 |
| Mode M9 | |||
|---|---|---|---|
| Quadrant | BADHDUFLAG | Total packets | Discarded packets |
| A | 0 | 318 | 0 |
| B | 0 | 317 | 0 |
| C | 0 | 319 | 0 |
| D | 0 | 315 | 0 |
| Mode SS | |||
|---|---|---|---|
| Quadrant | BADHDUFLAG | Total packets | Discarded packets |
| A | 0 | 1729 | 0 |
| B | 0 | 1722 | 0 |
| C | 0 | 1722 | 0 |
| D | 0 | 1712 | 0 |
| Mode M0 | |||
|---|---|---|---|
| Quadrant | BADHDUFLAG | Total packets | Discarded packets |
| A | 0 | 211151 | 0 |
| B | 0 | 314670 | 0 |
| C | 0 | 200783 | 0 |
| D | 0 | 261247 | 0 |
| Quadrant | Total seconds | Saturated seconds | Saturation percentage |
|---|---|---|---|
| A | 83449 | 4017 | 4.813719% |
| B | 83641 | 15690 | 18.758743% |
| C | 83386 | 1479 | 1.773679% |
| D | 83378 | 3986 | 4.780638% |
Noise dominated data is calculated using 1-second bins in cleaned event files. If a bin has >2000 counts, and if more than 50% of those come from <1% of pixels, then it is considered to be noise-dominated and hence unusable.
| Quadrant | # 1 sec bins | Bins with >0 counts | Bins with >2000 counts | High rate bins dominated by noise | Noise dominated (total time) | Noise dominated (detector-on time) | Marked lightcurve |
|---|---|---|---|---|---|---|---|
| A | 116806 | 83490 | 0 | 0 | 0.00% | 0.00% |  |
| B | 116806 | 83601 | 0 | 0 | 0.00% | 0.00% |  |
| C | 116806 | 83393 | 0 | 0 | 0.00% | 0.00% |  |
| D | 116806 | 83358 | 0 | 0 | 0.00% | 0.00% |  |
Top three noisy pixels from each quadrant. If the there are fewer than three noisy pixels in the level2.evt file, extra rows are filled as -1
| Pixel properties | Quadrant properties | ||||||
|---|---|---|---|---|---|---|---|
| Quadrant | DetID | PixID | Counts | Sigma | Mean | Median | Sigma |
| A | 9 | 19 | 3876 | 8.91 | 1237 | 1169 | 303.6 |
| A | 7 | 110 | 3795 | 8.65 | 1237 | 1169 | 303.6 |
| A | 0 | 29 | 3788 | 8.63 | 1237 | 1169 | 303.6 |
| B | 2 | 9 | 3758 | 12.16 | 1133 | 1086 | 219.8 |
| B | 3 | 80 | 3270 | 9.94 | 1133 | 1086 | 219.8 |
| B | 2 | 8 | 2973 | 8.59 | 1133 | 1086 | 219.8 |
| C | 1 | 81 | 3937 | 8.99 | 1223 | 1149 | 310.0 |
| C | 1 | 80 | 3880 | 8.81 | 1223 | 1149 | 310.0 |
| C | 1 | 65 | 3187 | 6.57 | 1223 | 1149 | 310.0 |
| D | 4 | 160 | 2959 | 6.45 | 1127 | 1030 | 298.9 |
| D | 7 | 3 | 2941 | 6.39 | 1127 | 1030 | 298.9 |
| D | 10 | 189 | 2878 | 6.18 | 1127 | 1030 | 298.9 |
Histogram calculated using DETX and DETY for each event in the final _common_clean file
| Quadrant A |  |
 |
Quadrant B |
|---|---|---|---|
| Quadrant D |  |
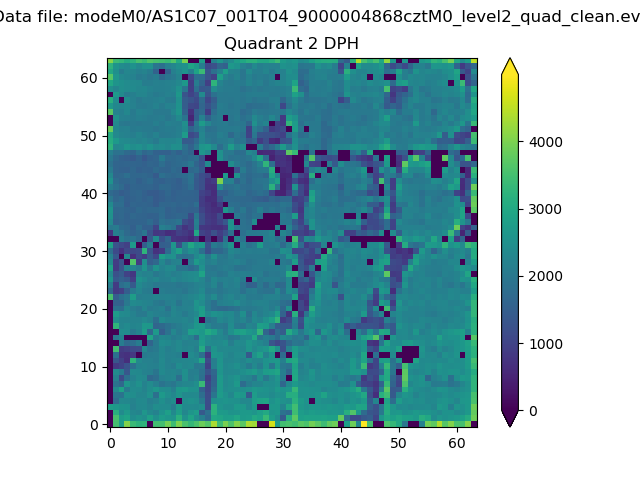 |
Quadrant C |
| Plot type | Count rate plots | Images |
|---|---|---|
| Comparison with Poisson distribution Blue bars denote a histogram of data divided into 1 sec bins. Red curve is a Poisson curve with rate = median count rate of data. |
 |
 |
| Quadrant-wise count rates Data is divided into 100 sec bins |
 |
|
| Module-wise count rates for Quadrant A Data is divided into 100 sec bins |
 |
 |
| Module-wise count rates for Quadrant B Data is divided into 100 sec bins |
 |
 |
| Module-wise count rates for Quadrant C Data is divided into 100 sec bins |
 |
 |
| Module-wise count rates for Quadrant D Data is divided into 100 sec bins |
 |
 |
| Parameter | Plot |
|---|---|
| CZT HV Monitor |  |
| D_VDD |  |
| Temperature 1 |  |
| Veto HV Monitor |  |
| Veto LLD |  |
| Alpha Counter |  |
| _CPM_Rate |  |
| CZT Counter |  |
| +2.5 Volts monitor |  |
| +5 Volts monitor |  |
| _ROLL_ROT |  |
| _Roll_DEC |  |
| _Roll_RA |  |
| Veto Counter |  |