| Param | Original file | Final file |
|---|---|---|
| Filename | modeM0/AS1C07_001T04_9000004868_34061cztM0_level2.evt | modeM0/AS1C07_001T04_9000004868_34061cztM0_level2_quad_clean.evt |
| Size (bytes) | 113,904,000 | 17,827,200 |
| Size | 108.6 MB | 17.0 MB |
| Events in quadrant A | 868,593 | 123,906 |
| Events in quadrant B | 1,205,207 | 114,271 |
| Events in quadrant C | 562,118 | 119,145 |
| Events in quadrant D | 753,035 | 114,856 |
| Mode M9 | |||
|---|---|---|---|
| Quadrant | BADHDUFLAG | Total packets | Discarded packets |
| A | 0 | 13 | 0 |
| B | 0 | 13 | 0 |
| C | 0 | 13 | 0 |
| D | 0 | 13 | 0 |
| Mode SS | |||
|---|---|---|---|
| Quadrant | BADHDUFLAG | Total packets | Discarded packets |
| A | 0 | 18 | 0 |
| B | 0 | 18 | 0 |
| C | 0 | 18 | 0 |
| D | 0 | 18 | 0 |
| Mode M0 | |||
|---|---|---|---|
| Quadrant | BADHDUFLAG | Total packets | Discarded packets |
| A | 0 | 3203 | 2 |
| B | 0 | 4133 | 1 |
| C | 0 | 2163 | 1 |
| D | 0 | 2867 | 1 |
| Quadrant | Total seconds | Saturated seconds | Saturation percentage |
|---|---|---|---|
| A | 849 | 10 | 1.177856% |
| B | 849 | 356 | 41.931684% |
| C | 849 | 31 | 3.651355% |
| D | 849 | 3 | 0.353357% |
Noise dominated data is calculated using 1-second bins in cleaned event files. If a bin has >2000 counts, and if more than 50% of those come from <1% of pixels, then it is considered to be noise-dominated and hence unusable.
| Quadrant | # 1 sec bins | Bins with >0 counts | Bins with >2000 counts | High rate bins dominated by noise | Noise dominated (total time) | Noise dominated (detector-on time) | Marked lightcurve |
|---|---|---|---|---|---|---|---|
| A | 849 | 849 | 1 | 1 | 0.12% | 0.12% | 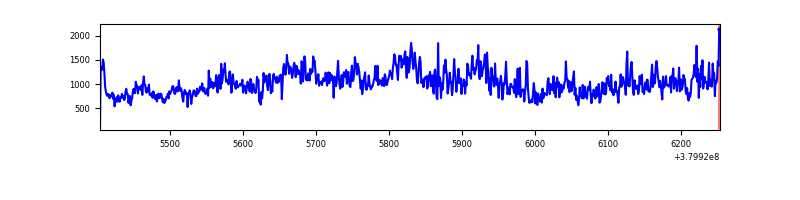 |
| B | 848 | 848 | 295 | 295 | 34.79% | 34.79% | 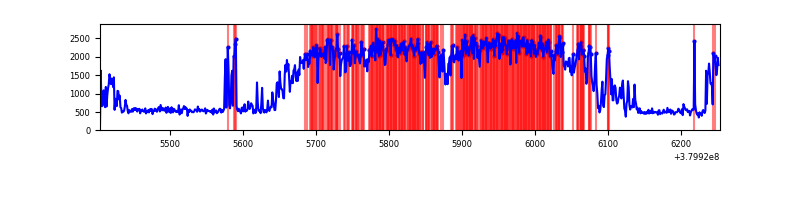 |
| C | 849 | 849 | 26 | 26 | 3.06% | 3.06% | 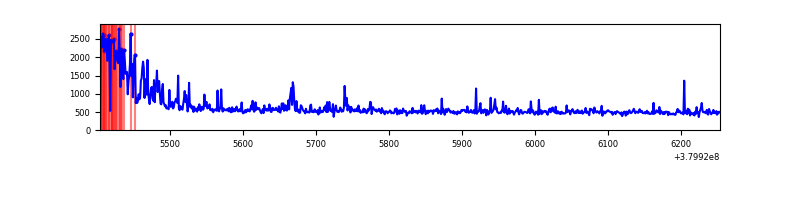 |
| D | 849 | 849 | 1 | 1 | 0.12% | 0.12% | 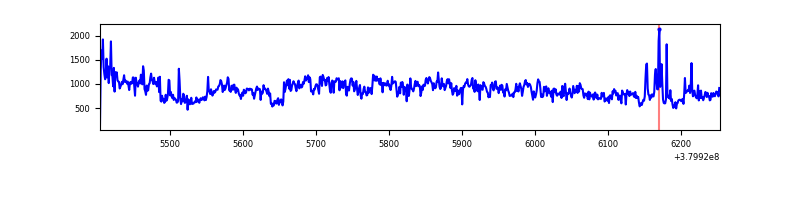 |
Top three noisy pixels from each quadrant. If the there are fewer than three noisy pixels in the level2.evt file, extra rows are filled as -1
| Pixel properties | Quadrant properties | ||||||
|---|---|---|---|---|---|---|---|
| Quadrant | DetID | PixID | Counts | Sigma | Mean | Median | Sigma |
| A | 15 | 169 | 451392 | 19852.62 | 105 | 103 | 22.7 |
| A | 10 | 83 | 8576 | 372.74 | 105 | 103 | 22.7 |
| A | 13 | 6 | 1555 | 63.87 | 105 | 103 | 22.7 |
| B | 5 | 31 | 248858 | 12414.57 | 95 | 93 | 20.0 |
| B | 5 | 15 | 242897 | 12117.09 | 95 | 93 | 20.0 |
| B | 5 | 14 | 179790 | 8967.75 | 95 | 93 | 20.0 |
| C | 0 | 10 | 132533 | 5653.54 | 95 | 95 | 23.4 |
| C | 15 | 214 | 41451 | 1765.41 | 95 | 95 | 23.4 |
| C | 3 | 233 | 8309 | 350.64 | 95 | 95 | 23.4 |
| D | 13 | 168 | 228996 | 8821.77 | 98 | 94 | 25.9 |
| D | 8 | 195 | 125359 | 4827.65 | 98 | 94 | 25.9 |
| D | 10 | 118 | 8928 | 340.46 | 98 | 94 | 25.9 |
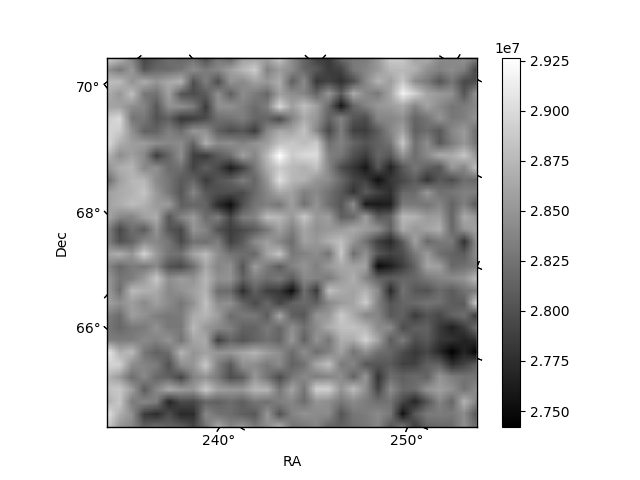
Histogram calculated using DETX and DETY for each event in the final _common_clean file
| Quadrant A | 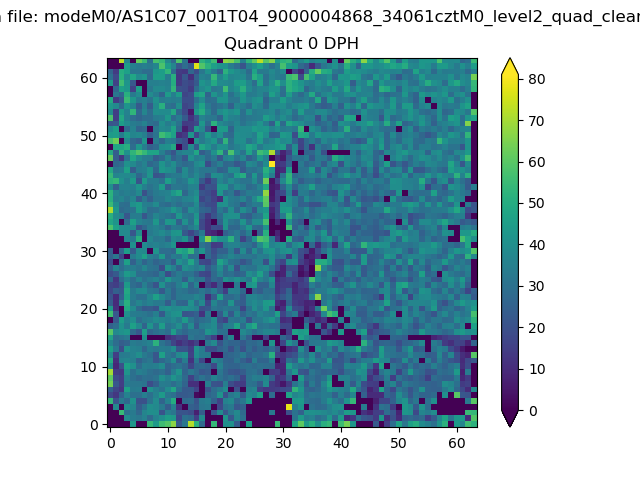 |
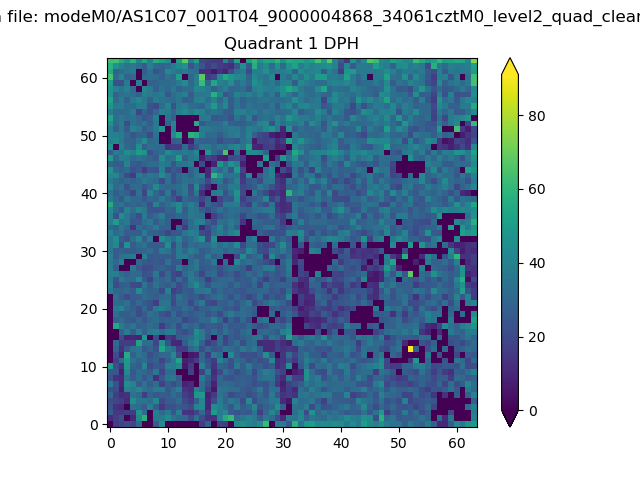 |
Quadrant B |
|---|---|---|---|
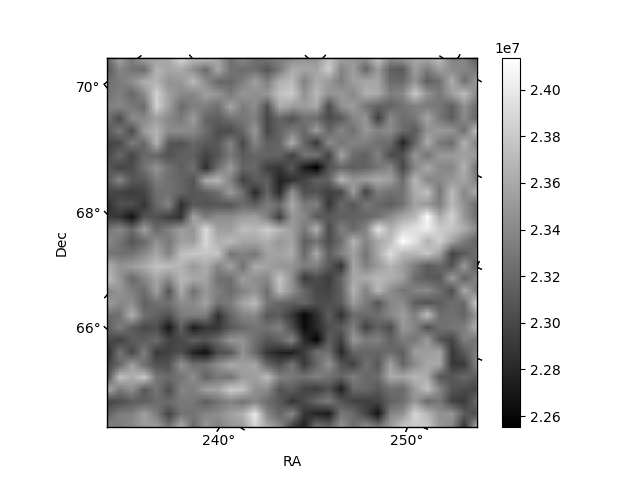
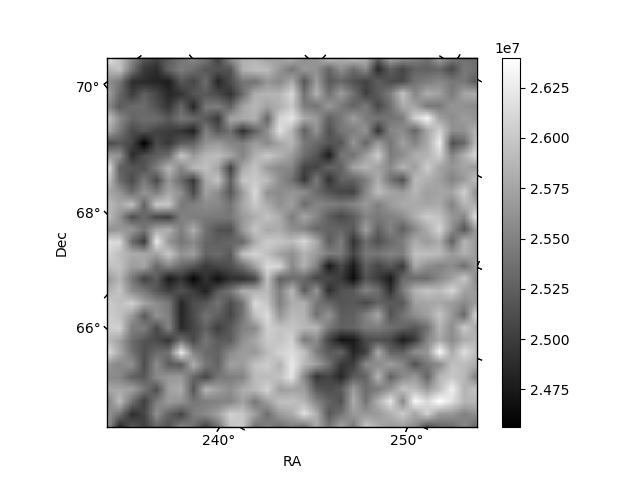
| Quadrant D |  |
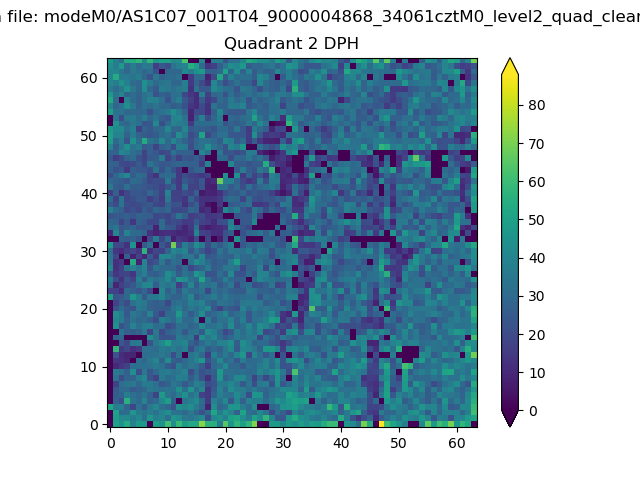 |
Quadrant C |
| Plot type | Count rate plots | Images |
|---|---|---|
| Comparison with Poisson distribution Blue bars denote a histogram of data divided into 1 sec bins. Red curve is a Poisson curve with rate = median count rate of data. |
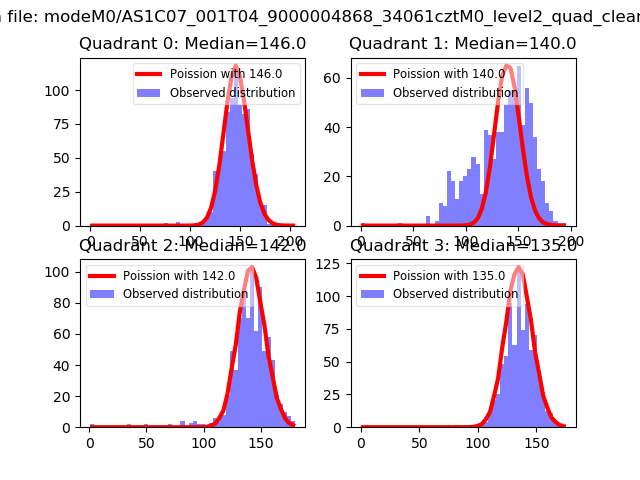 |
 |
| Quadrant-wise count rates Data is divided into 100 sec bins |
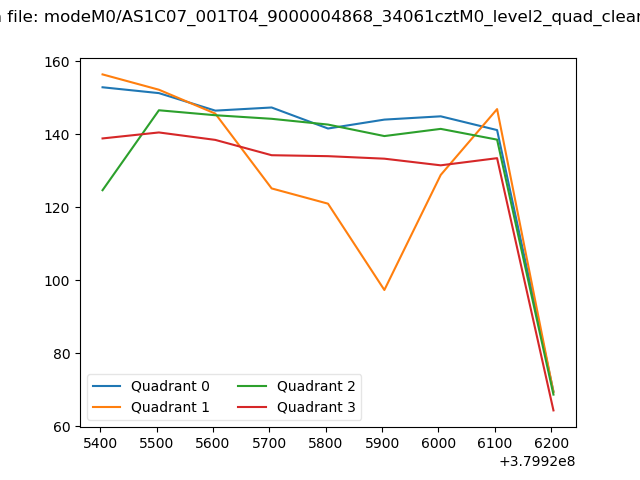 |
|
| Module-wise count rates for Quadrant A Data is divided into 100 sec bins |
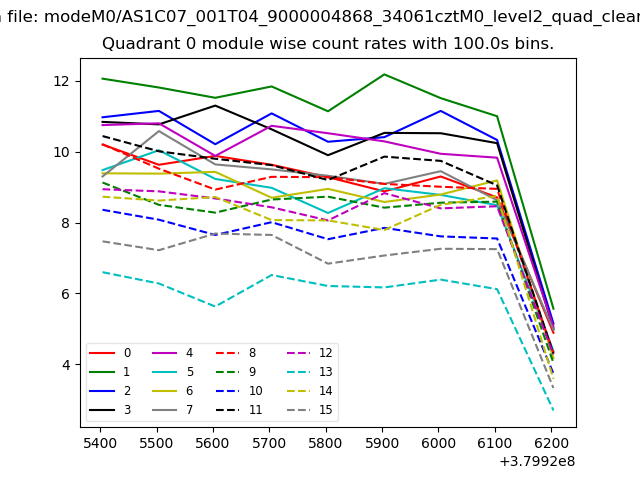 |
 |
| Module-wise count rates for Quadrant B Data is divided into 100 sec bins |
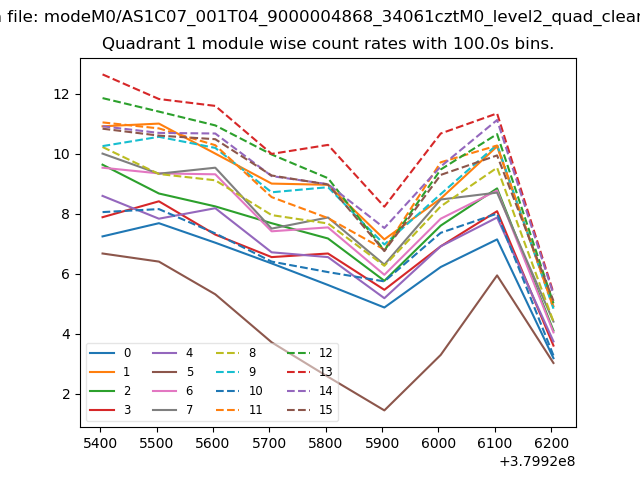 |
 |
| Module-wise count rates for Quadrant C Data is divided into 100 sec bins |
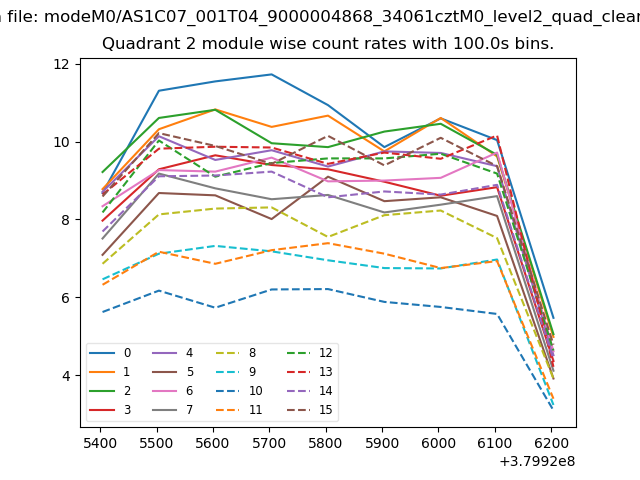 |
 |
| Module-wise count rates for Quadrant D Data is divided into 100 sec bins |
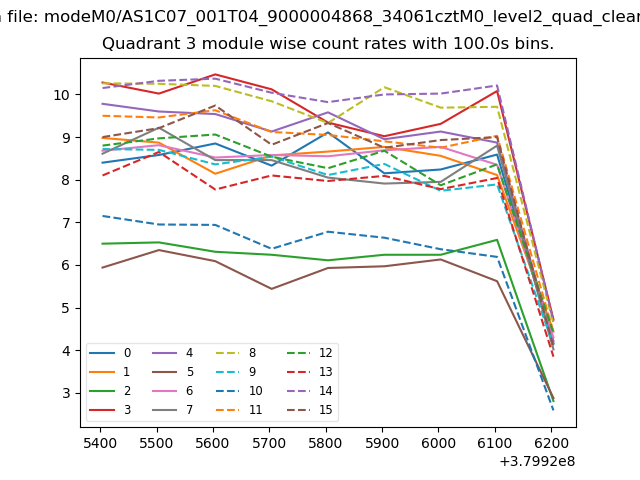 |
 |
| Parameter | Plot |
|---|---|
| CZT HV Monitor | 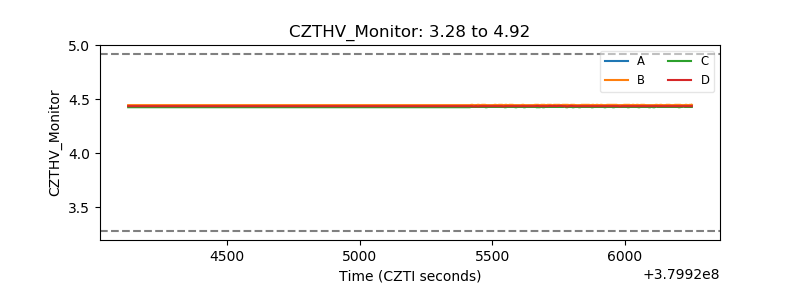 |
| D_VDD | 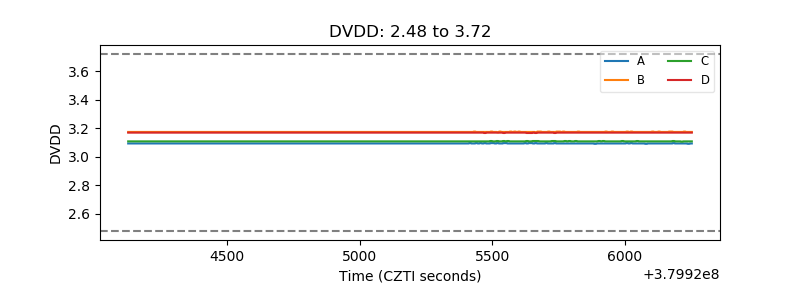 |
| Temperature 1 | 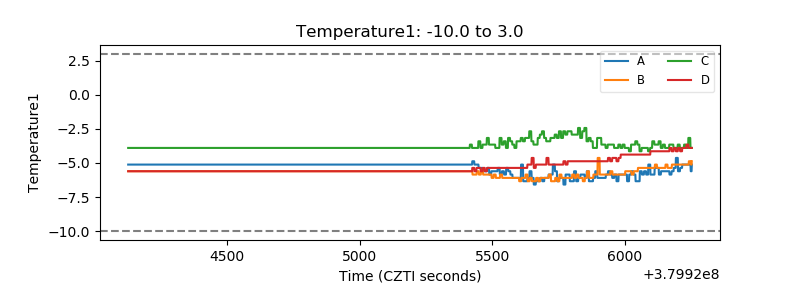 |
| Veto HV Monitor | 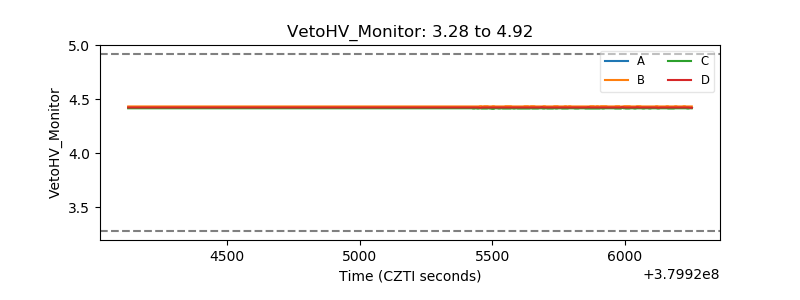 |
| Veto LLD | 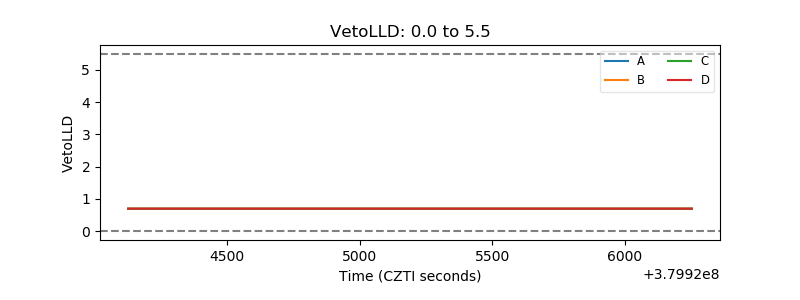 |
| Alpha Counter | 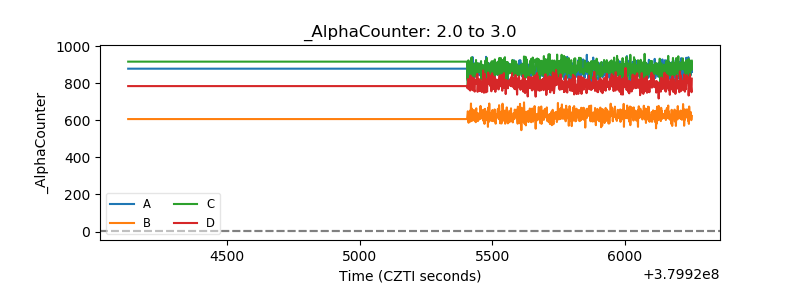 |
| _CPM_Rate | 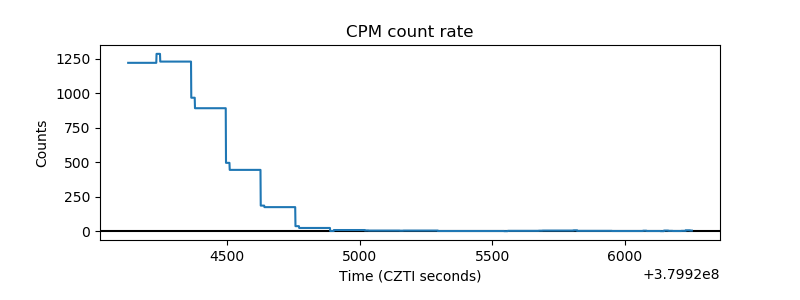 |
| CZT Counter |  |
| +2.5 Volts monitor | 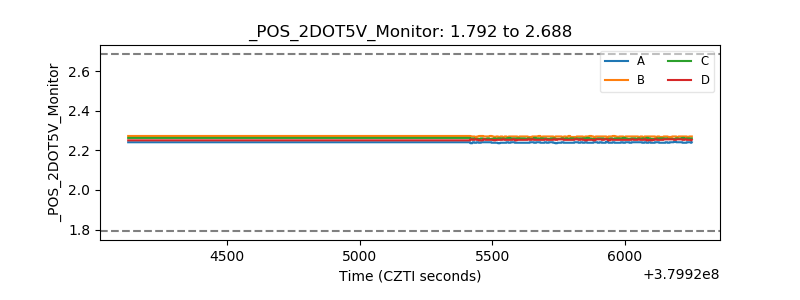 |
| +5 Volts monitor |  |
| _ROLL_ROT | 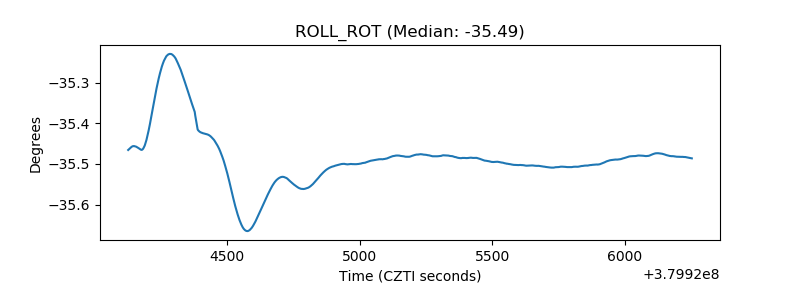 |
| _Roll_DEC | 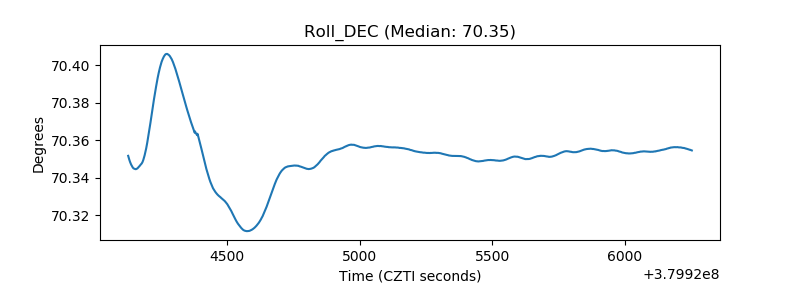 |
| _Roll_RA |  |
| Veto Counter | 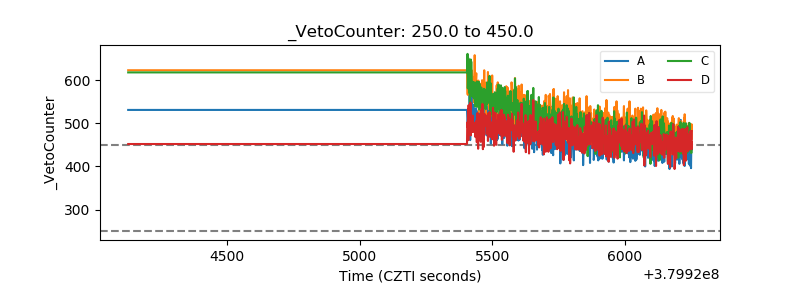 |