| Param | Original file | Final file |
|---|---|---|
| Filename | modeM0/AS1C07_001T04_9000004868_34062cztM0_level2.evt | modeM0/AS1C07_001T04_9000004868_34062cztM0_level2_quad_clean.evt |
| Size (bytes) | 688,112,640 | 74,413,440 |
| Size | 656.2 MB | 71.0 MB |
| Events in quadrant A | 5,985,245 | 479,417 |
| Events in quadrant B | 7,059,187 | 464,867 |
| Events in quadrant C | 2,936,899 | 498,668 |
| Events in quadrant D | 4,528,459 | 466,232 |
| Mode M9 | |||
|---|---|---|---|
| Quadrant | BADHDUFLAG | Total packets | Discarded packets |
| A | 0 | 21 | 0 |
| B | 0 | 21 | 0 |
| C | 0 | 21 | 0 |
| D | 0 | 21 | 0 |
| Mode SS | |||
|---|---|---|---|
| Quadrant | BADHDUFLAG | Total packets | Discarded packets |
| A | 0 | 100 | 0 |
| B | 0 | 100 | 0 |
| C | 0 | 100 | 0 |
| D | 0 | 100 | 0 |
| Mode M0 | |||
|---|---|---|---|
| Quadrant | BADHDUFLAG | Total packets | Discarded packets |
| A | 0 | 21222 | 2 |
| B | 0 | 24123 | 1 |
| C | 0 | 11624 | 1 |
| D | 0 | 16796 | 1 |
| Quadrant | Total seconds | Saturated seconds | Saturation percentage |
|---|---|---|---|
| A | 4890 | 916 | 18.732106% |
| B | 4890 | 2119 | 43.333333% |
| C | 4890 | 65 | 1.329243% |
| D | 4890 | 210 | 4.294479% |
Noise dominated data is calculated using 1-second bins in cleaned event files. If a bin has >2000 counts, and if more than 50% of those come from <1% of pixels, then it is considered to be noise-dominated and hence unusable.
| Quadrant | # 1 sec bins | Bins with >0 counts | Bins with >2000 counts | High rate bins dominated by noise | Noise dominated (total time) | Noise dominated (detector-on time) | Marked lightcurve |
|---|---|---|---|---|---|---|---|
| A | 6983 | 4891 | 716 | 716 | 10.25% | 14.64% | 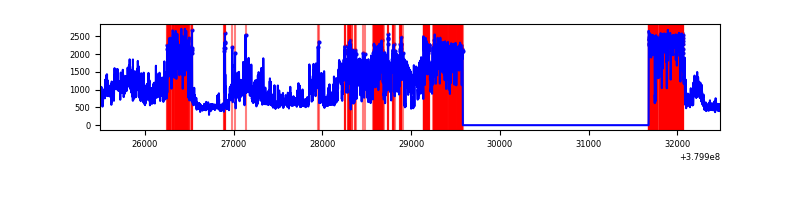 |
| B | 6983 | 4891 | 1946 | 1946 | 27.87% | 39.79% | 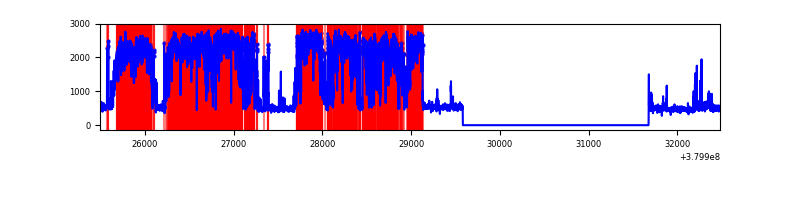 |
| C | 6983 | 4891 | 65 | 65 | 0.93% | 1.33% | 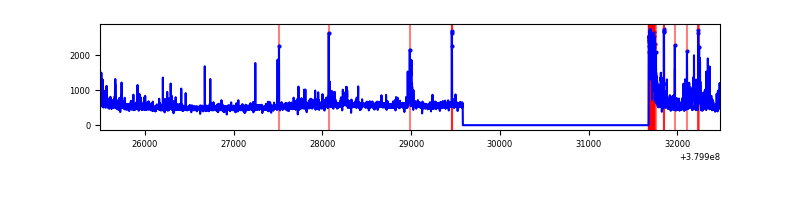 |
| D | 6983 | 4891 | 195 | 195 | 2.79% | 3.99% | 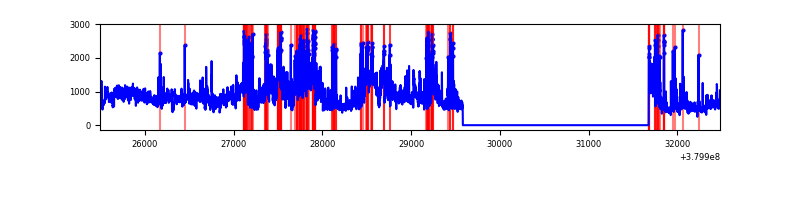 |
Top three noisy pixels from each quadrant. If the there are fewer than three noisy pixels in the level2.evt file, extra rows are filled as -1
| Pixel properties | Quadrant properties | ||||||
|---|---|---|---|---|---|---|---|
| Quadrant | DetID | PixID | Counts | Sigma | Mean | Median | Sigma |
| A | 15 | 169 | 3812084 | 34178.8 | 559 | 550 | 111.5 |
| A | 10 | 83 | 9541 | 80.62 | 559 | 550 | 111.5 |
| A | 13 | 254 | 7582 | 63.06 | 559 | 550 | 111.5 |
| B | 5 | 31 | 1780568 | 18272.64 | 512 | 500 | 97.4 |
| B | 5 | 15 | 1652186 | 16954.78 | 512 | 500 | 97.4 |
| B | 5 | 14 | 988914 | 10146.21 | 512 | 500 | 97.4 |
| C | 0 | 10 | 237411 | 1870.19 | 558 | 562 | 126.6 |
| C | 15 | 214 | 215762 | 1699.25 | 558 | 562 | 126.6 |
| C | 0 | 207 | 175514 | 1381.45 | 558 | 562 | 126.6 |
| D | 13 | 168 | 865100 | 6390.5 | 558 | 543 | 135.3 |
| D | 8 | 195 | 688139 | 5082.47 | 558 | 543 | 135.3 |
| D | 2 | 250 | 252628 | 1863.32 | 558 | 543 | 135.3 |
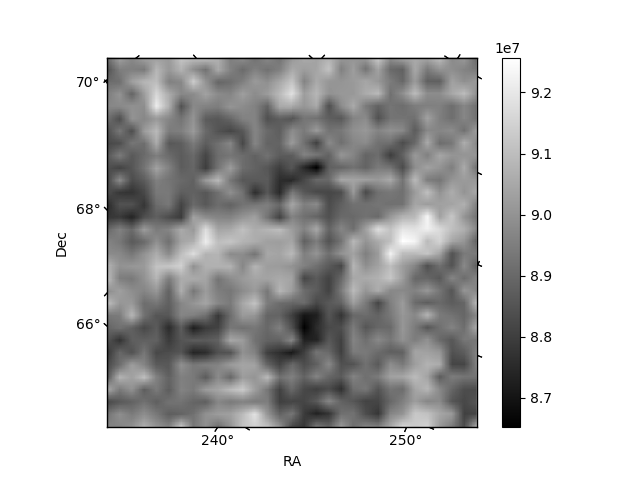
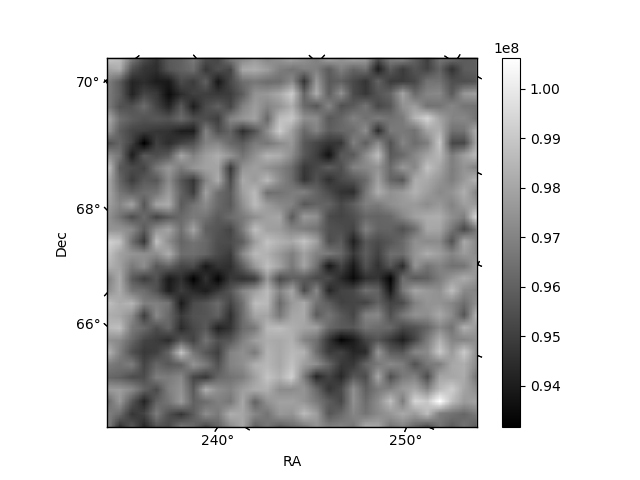
Histogram calculated using DETX and DETY for each event in the final _common_clean file
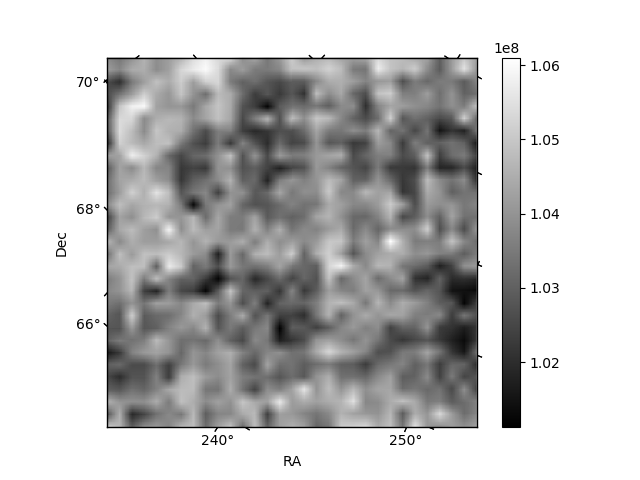
| Quadrant A |  |
 |
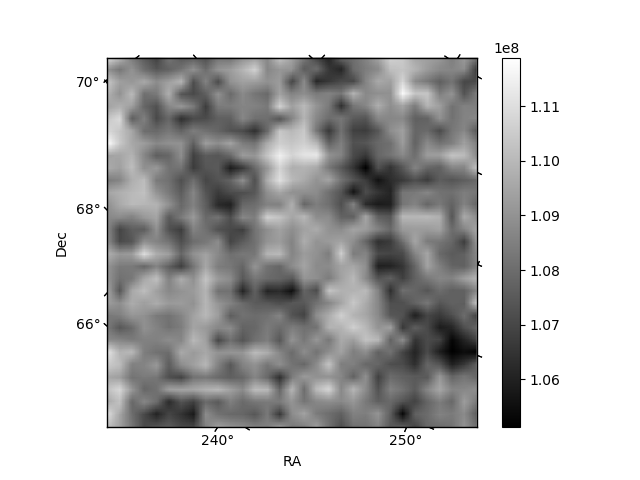
Quadrant B |
|---|---|---|---|
| Quadrant D | 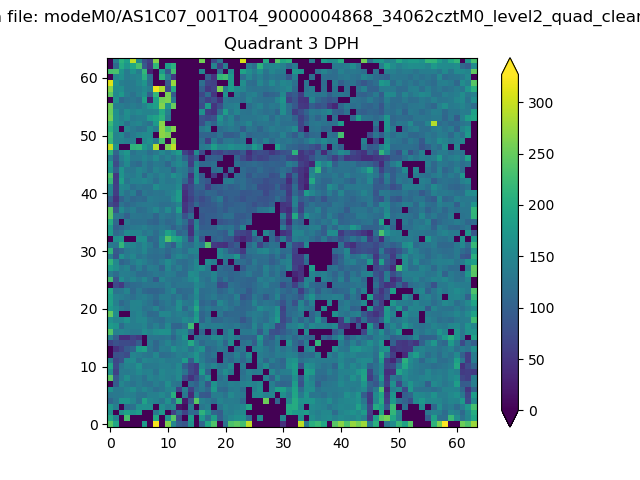 |
 |
Quadrant C |
| Plot type | Count rate plots | Images |
|---|---|---|
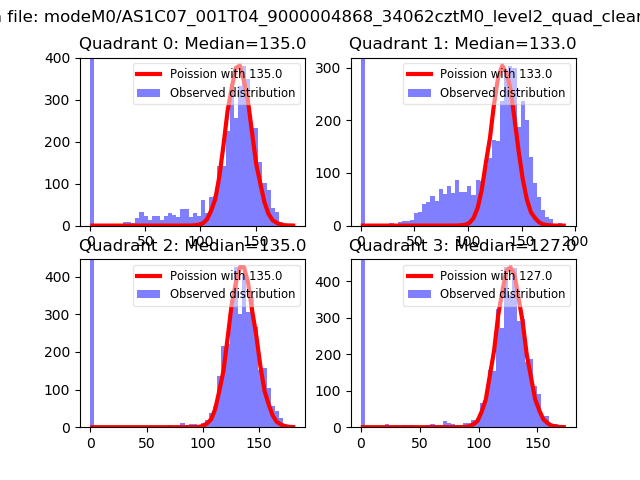
| Comparison with Poisson distribution Blue bars denote a histogram of data divided into 1 sec bins. Red curve is a Poisson curve with rate = median count rate of data. |
 |
 |
| Quadrant-wise count rates Data is divided into 100 sec bins |
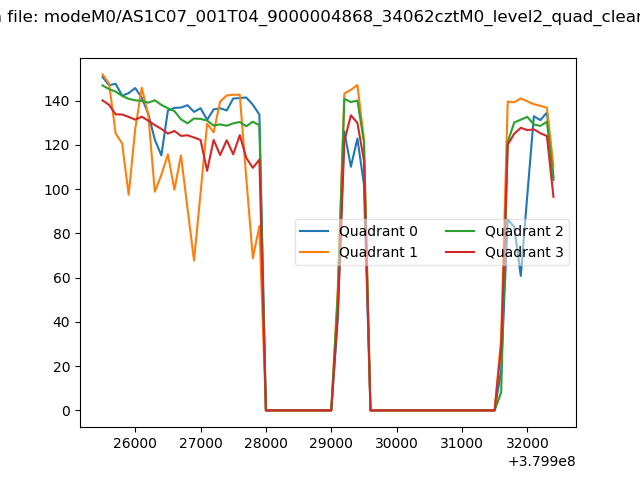 |
|
| Module-wise count rates for Quadrant A Data is divided into 100 sec bins |
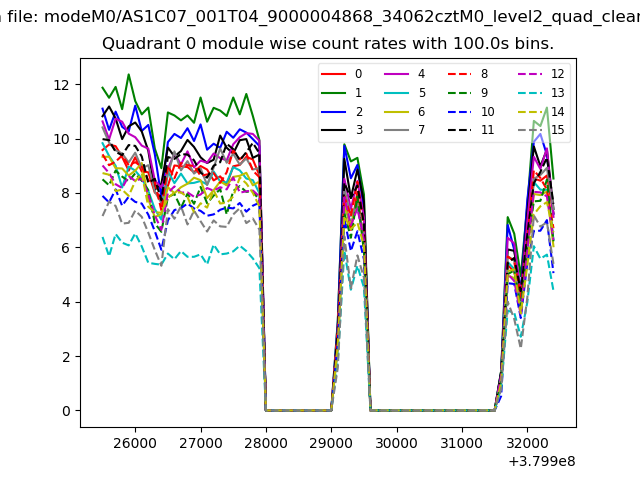 |
 |
| Module-wise count rates for Quadrant B Data is divided into 100 sec bins |
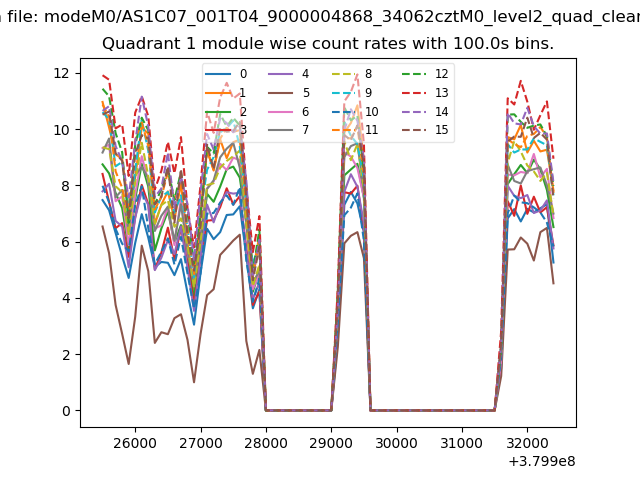 |
 |
| Module-wise count rates for Quadrant C Data is divided into 100 sec bins |
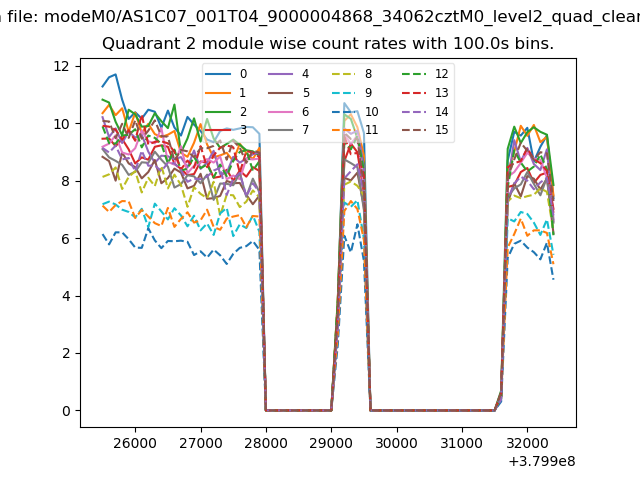 |
 |
| Module-wise count rates for Quadrant D Data is divided into 100 sec bins |
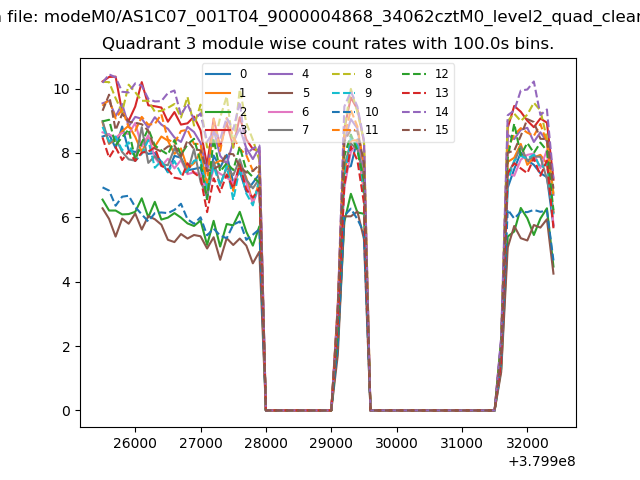 |
 |
| Parameter | Plot |
|---|---|
| CZT HV Monitor | 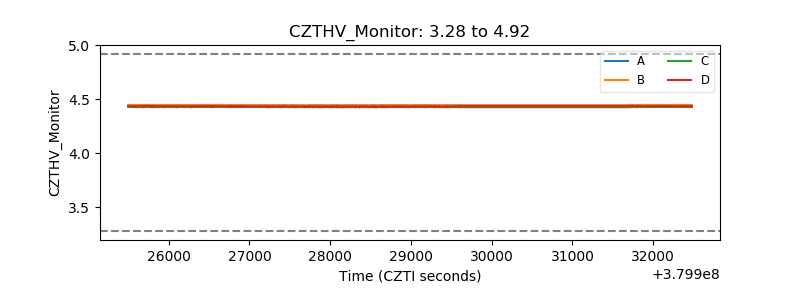 |
| D_VDD | 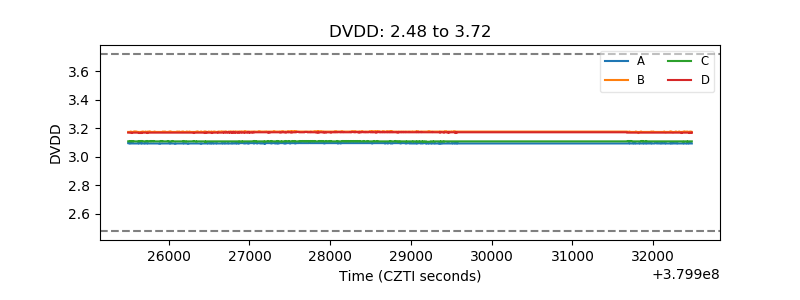 |
| Temperature 1 | 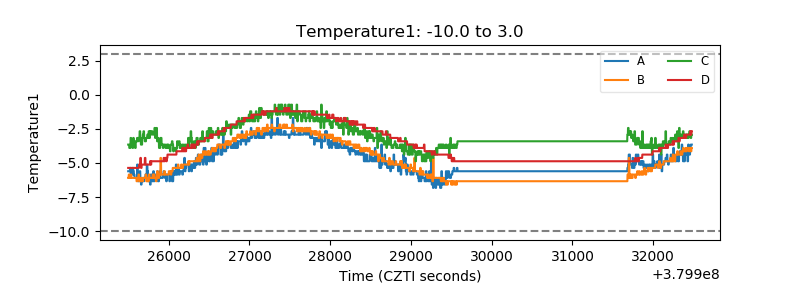 |
| Veto HV Monitor | 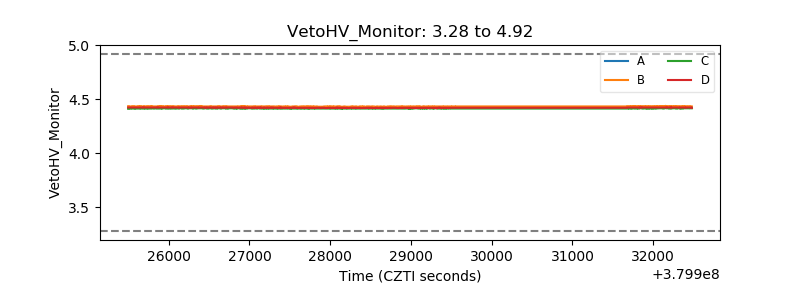 |
| Veto LLD | 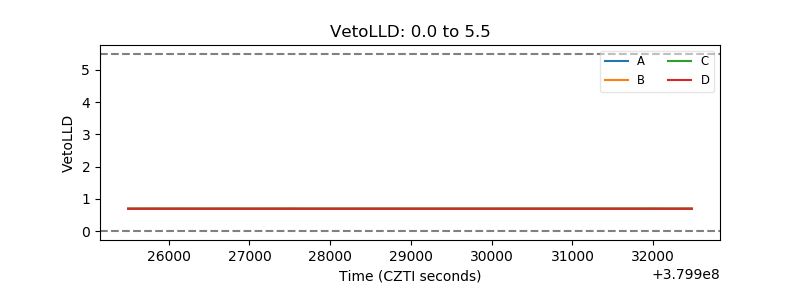 |
| Alpha Counter | 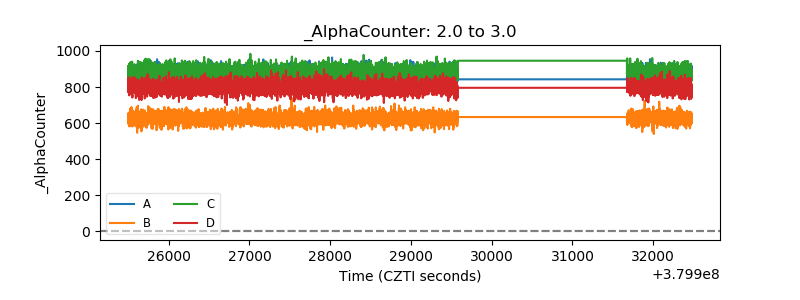 |
| _CPM_Rate | 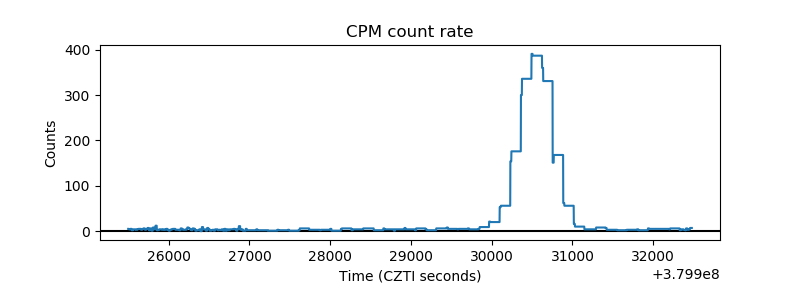 |
| CZT Counter | 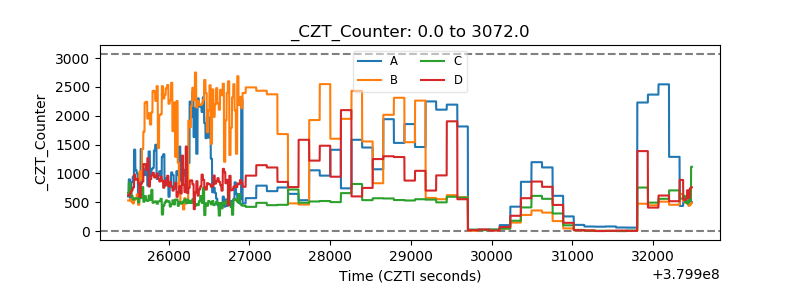 |
| +2.5 Volts monitor |  |
| +5 Volts monitor |  |
| _ROLL_ROT | 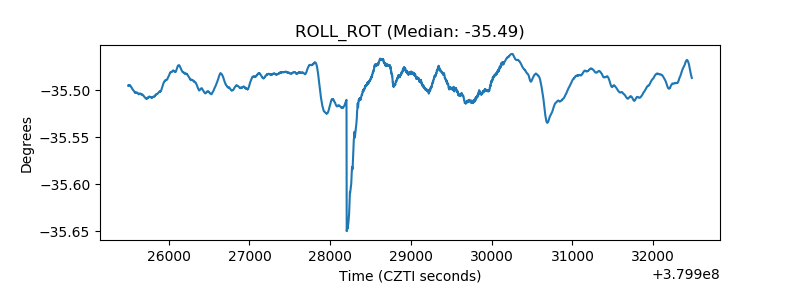 |
| _Roll_DEC | 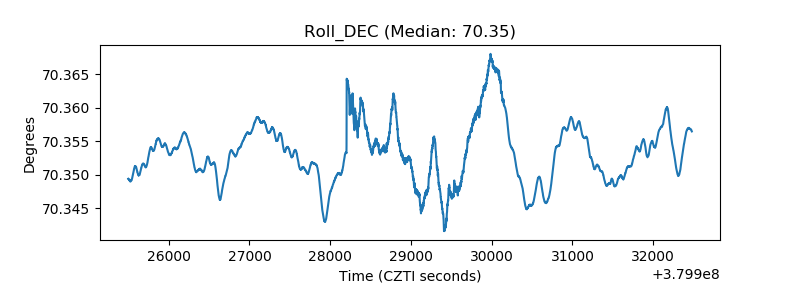 |
| _Roll_RA | 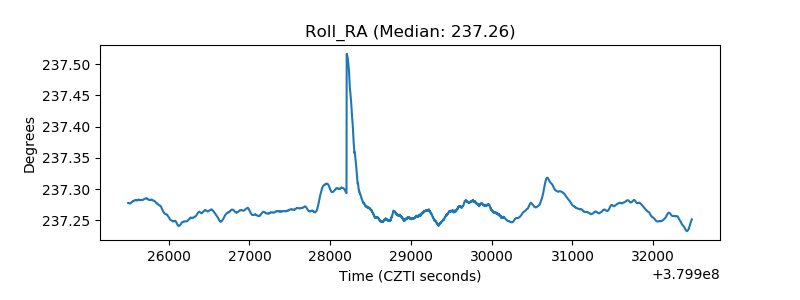 |
| Veto Counter | 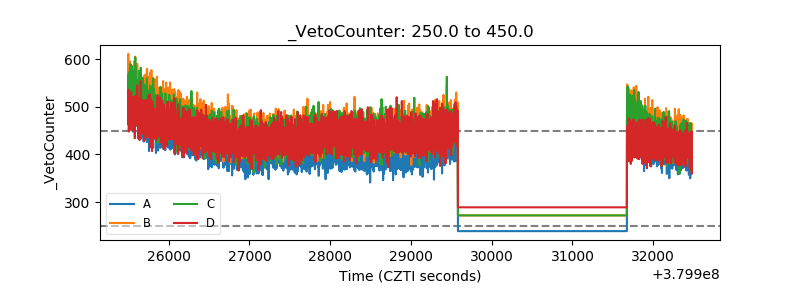 |