| Param | Original file | Final file |
|---|---|---|
| Filename | modeM0/AS1C07_001T04_9000004868_34063cztM0_level2.evt | modeM0/AS1C07_001T04_9000004868_34063cztM0_level2_quad_clean.evt |
| Size (bytes) | 664,761,600 | 76,331,520 |
| Size | 634.0 MB | 72.8 MB |
| Events in quadrant A | 5,346,656 | 462,254 |
| Events in quadrant B | 7,189,450 | 493,056 |
| Events in quadrant C | 3,171,222 | 510,962 |
| Events in quadrant D | 4,074,193 | 480,783 |
| Mode M9 | |||
|---|---|---|---|
| Quadrant | BADHDUFLAG | Total packets | Discarded packets |
| A | 0 | 22 | 0 |
| B | 0 | 22 | 0 |
| C | 0 | 22 | 0 |
| D | 0 | 23 | 0 |
| Mode SS | |||
|---|---|---|---|
| Quadrant | BADHDUFLAG | Total packets | Discarded packets |
| A | 0 | 106 | 0 |
| B | 0 | 106 | 0 |
| C | 0 | 106 | 0 |
| D | 0 | 106 | 0 |
| Mode M0 | |||
|---|---|---|---|
| Quadrant | BADHDUFLAG | Total packets | Discarded packets |
| A | 0 | 19165 | 3 |
| B | 0 | 24775 | 2 |
| C | 0 | 12455 | 2 |
| D | 0 | 15634 | 2 |
| Quadrant | Total seconds | Saturated seconds | Saturation percentage |
|---|---|---|---|
| A | 5186 | 1347 | 25.973776% |
| B | 5186 | 2062 | 39.760895% |
| C | 5186 | 105 | 2.024682% |
| D | 5186 | 246 | 4.743540% |
Noise dominated data is calculated using 1-second bins in cleaned event files. If a bin has >2000 counts, and if more than 50% of those come from <1% of pixels, then it is considered to be noise-dominated and hence unusable.
| Quadrant | # 1 sec bins | Bins with >0 counts | Bins with >2000 counts | High rate bins dominated by noise | Noise dominated (total time) | Noise dominated (detector-on time) | Marked lightcurve |
|---|---|---|---|---|---|---|---|
| A | 7098 | 5186 | 1243 | 1243 | 17.51% | 23.97% | 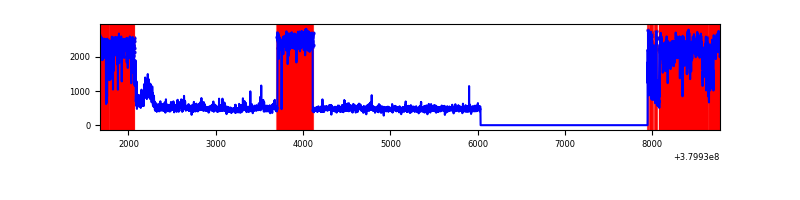 |
| B | 7099 | 5187 | 1916 | 1916 | 26.99% | 36.94% | 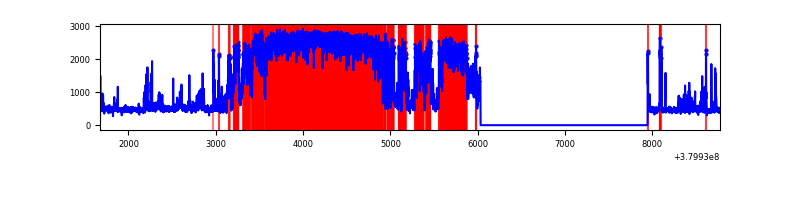 |
| C | 7099 | 5187 | 90 | 90 | 1.27% | 1.74% | 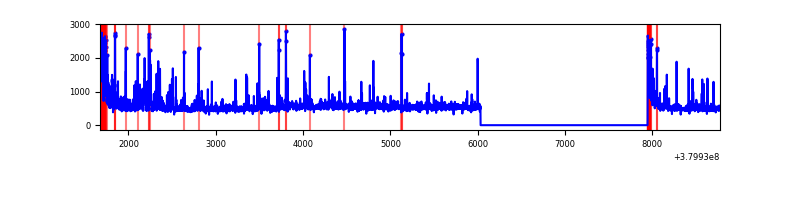 |
| D | 7099 | 5187 | 259 | 259 | 3.65% | 4.99% | 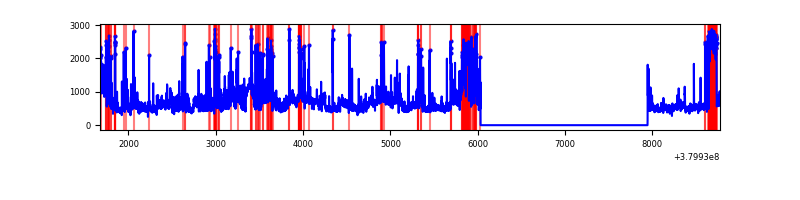 |
Top three noisy pixels from each quadrant. If the there are fewer than three noisy pixels in the level2.evt file, extra rows are filled as -1
| Pixel properties | Quadrant properties | ||||||
|---|---|---|---|---|---|---|---|
| Quadrant | DetID | PixID | Counts | Sigma | Mean | Median | Sigma |
| A | 15 | 169 | 3275050 | 30911.28 | 530 | 521 | 105.9 |
| A | 10 | 83 | 14429 | 131.29 | 530 | 521 | 105.9 |
| A | 13 | 254 | 7554 | 66.39 | 530 | 521 | 105.9 |
| B | 5 | 31 | 1882797 | 19607.83 | 501 | 490 | 96.0 |
| B | 5 | 15 | 1663955 | 17328.17 | 501 | 490 | 96.0 |
| B | 5 | 14 | 927938 | 9661.14 | 501 | 490 | 96.0 |
| C | 0 | 10 | 322034 | 2434.8 | 577 | 581 | 132.0 |
| C | 15 | 214 | 229318 | 1732.53 | 577 | 581 | 132.0 |
| C | 0 | 207 | 220159 | 1663.16 | 577 | 581 | 132.0 |
| D | 8 | 195 | 513079 | 3643.18 | 577 | 562 | 140.7 |
| D | 2 | 250 | 425651 | 3021.71 | 577 | 562 | 140.7 |
| D | 13 | 168 | 245815 | 1743.36 | 577 | 562 | 140.7 |
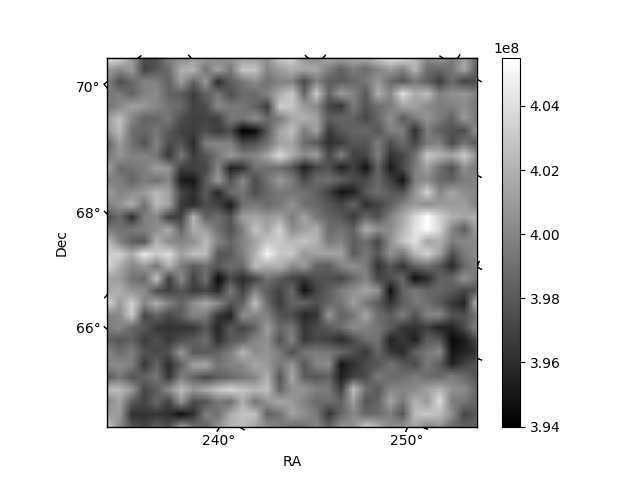
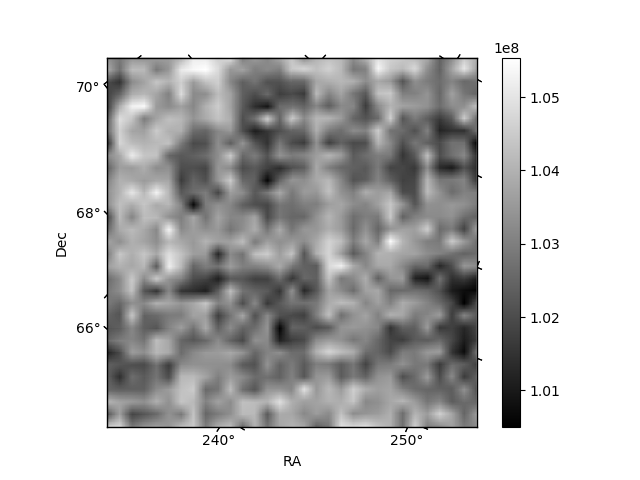
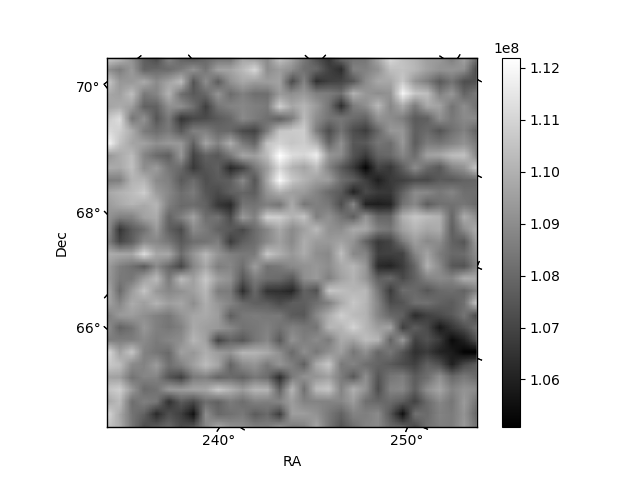
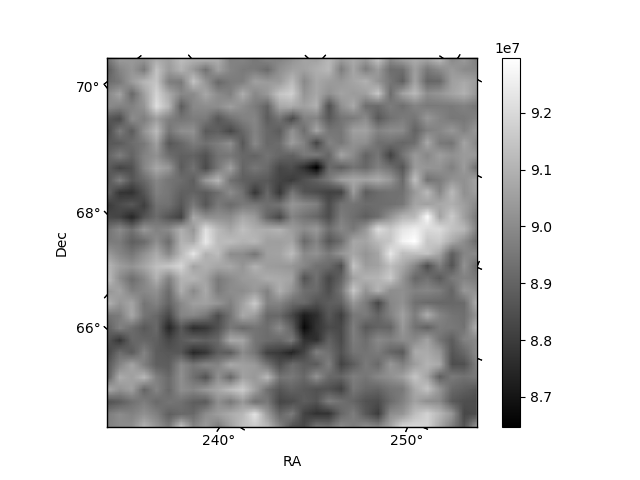
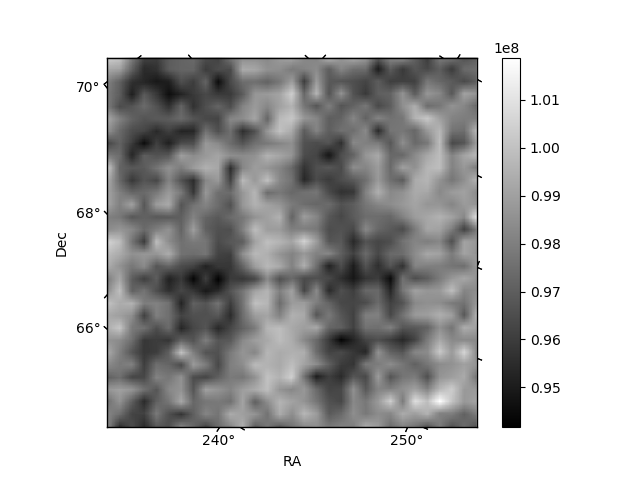
Histogram calculated using DETX and DETY for each event in the final _common_clean file
| Quadrant A | 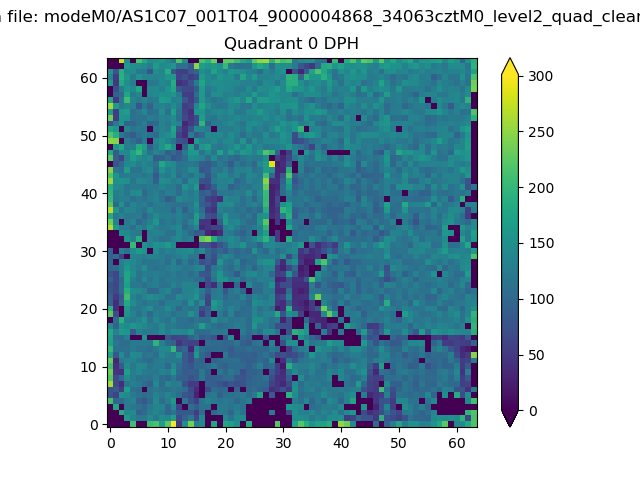 |
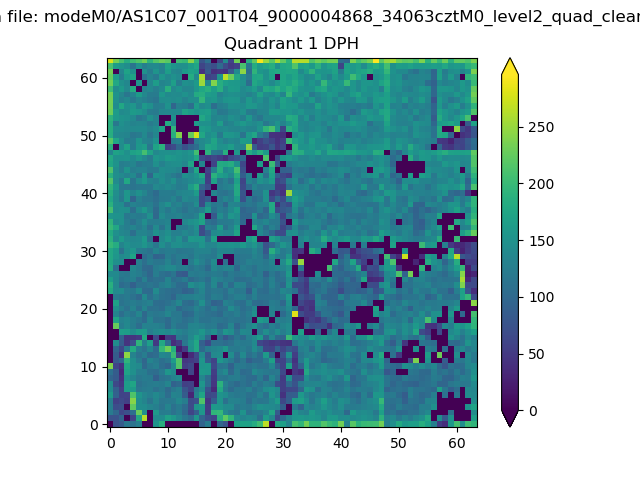 |
Quadrant B |
|---|---|---|---|
| Quadrant D | 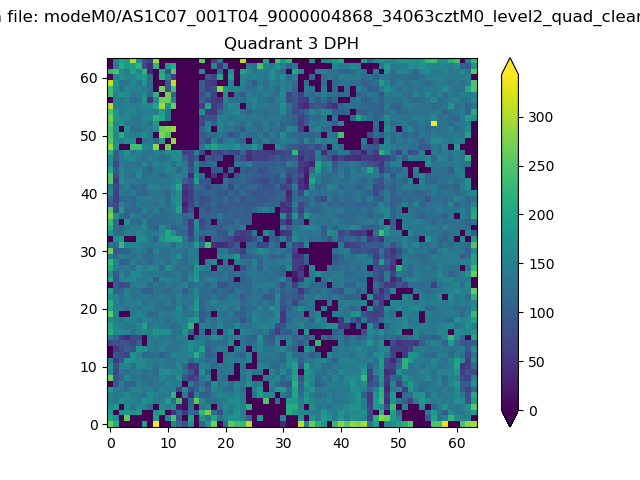 |
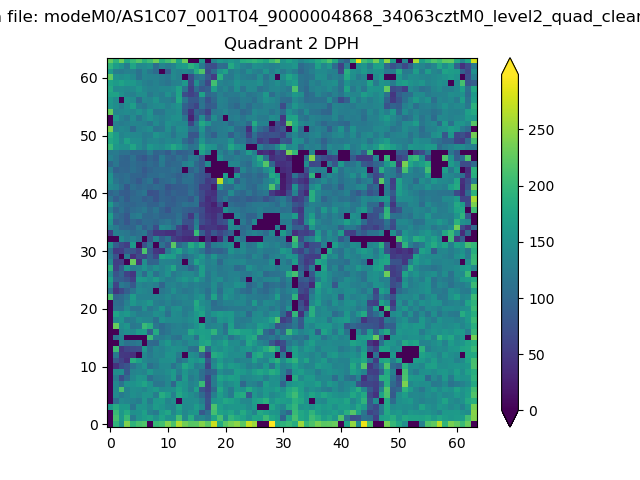 |
Quadrant C |
| Plot type | Count rate plots | Images |
|---|---|---|
| Comparison with Poisson distribution Blue bars denote a histogram of data divided into 1 sec bins. Red curve is a Poisson curve with rate = median count rate of data. |
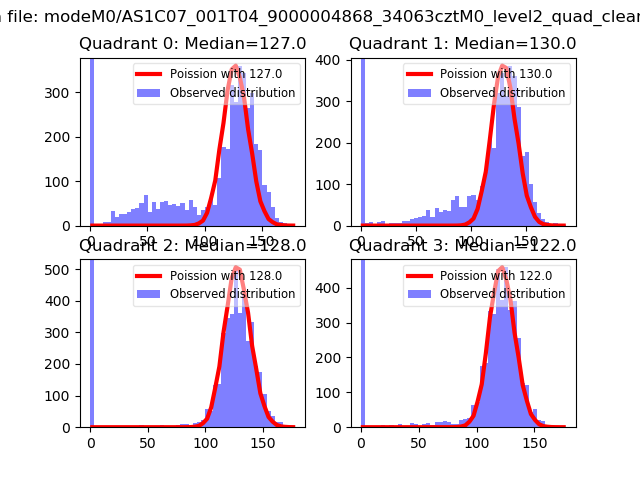 |
 |
| Quadrant-wise count rates Data is divided into 100 sec bins |
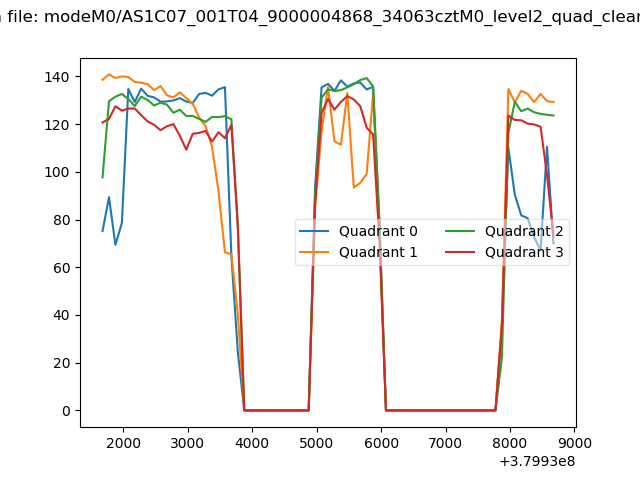 |
|
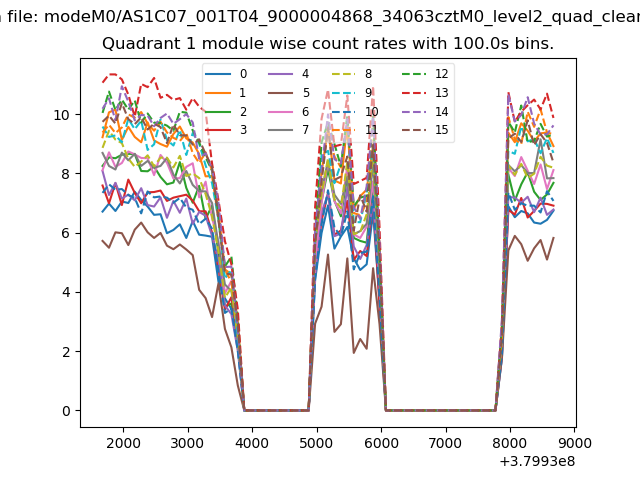
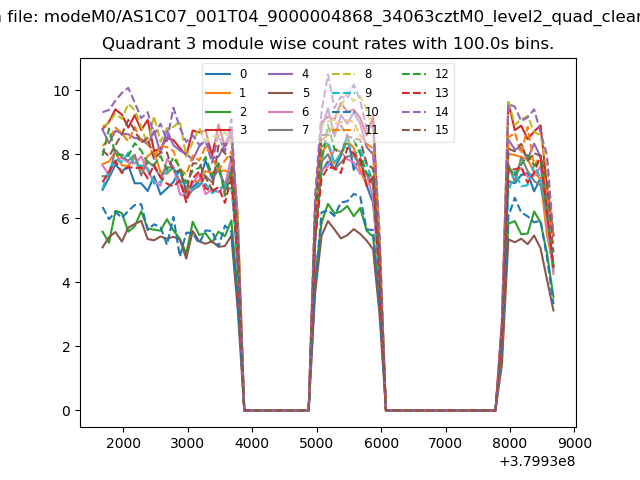
| Module-wise count rates for Quadrant A Data is divided into 100 sec bins |
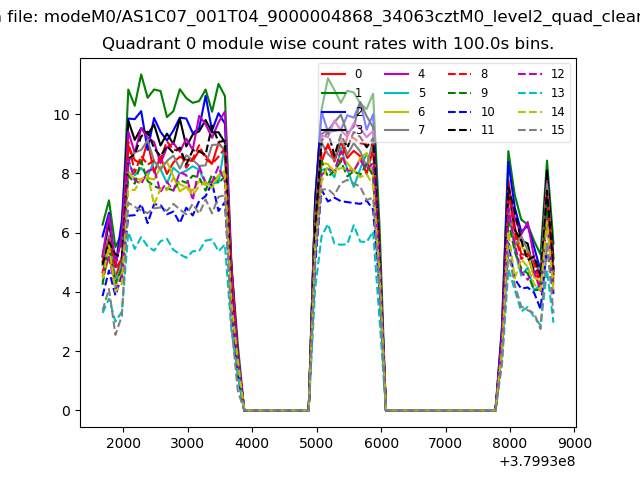 |
 |
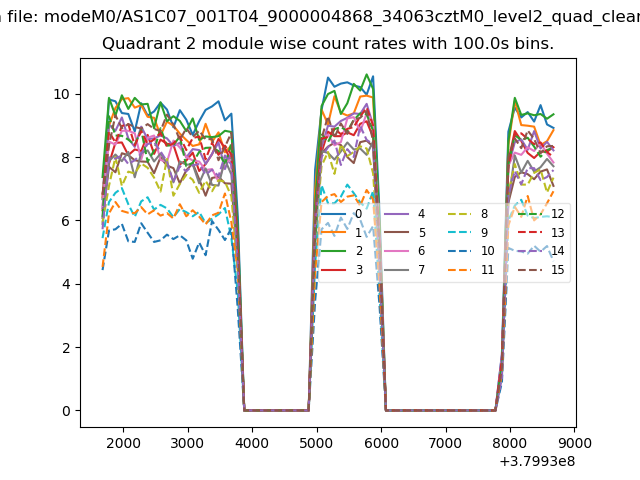
| Module-wise count rates for Quadrant B Data is divided into 100 sec bins |
 |
 |
| Module-wise count rates for Quadrant C Data is divided into 100 sec bins |
 |
 |
| Module-wise count rates for Quadrant D Data is divided into 100 sec bins |
 |
 |
| Parameter | Plot |
|---|---|
| CZT HV Monitor | 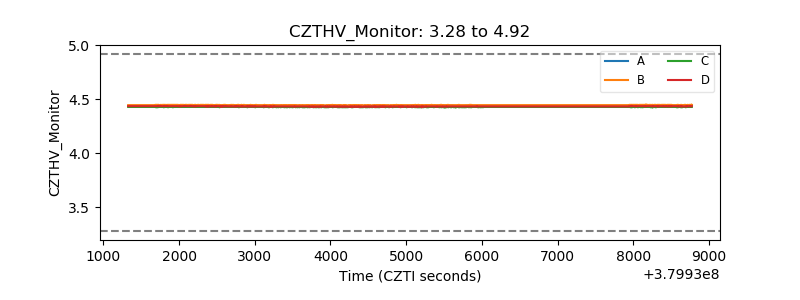 |
| D_VDD | 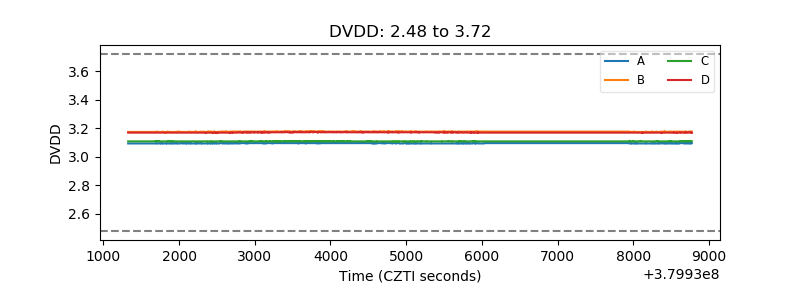 |
| Temperature 1 | 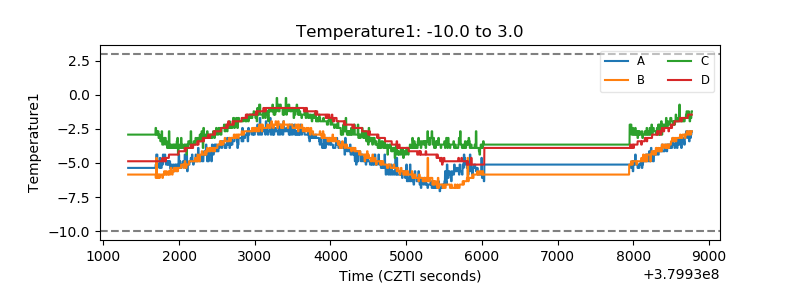 |
| Veto HV Monitor | 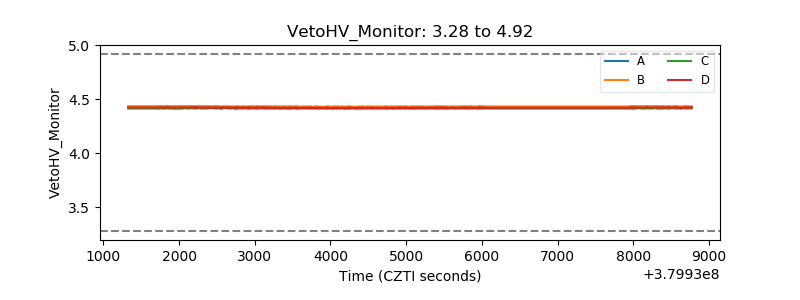 |
| Veto LLD | 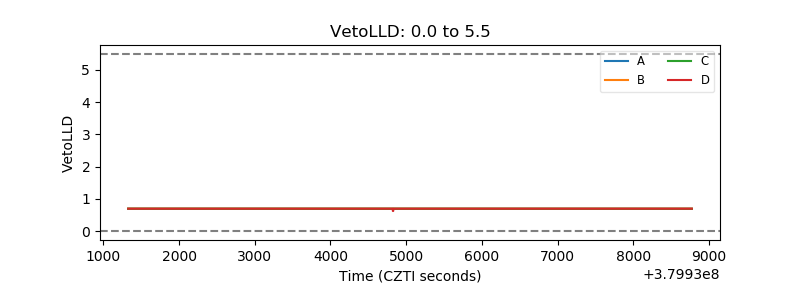 |
| Alpha Counter | 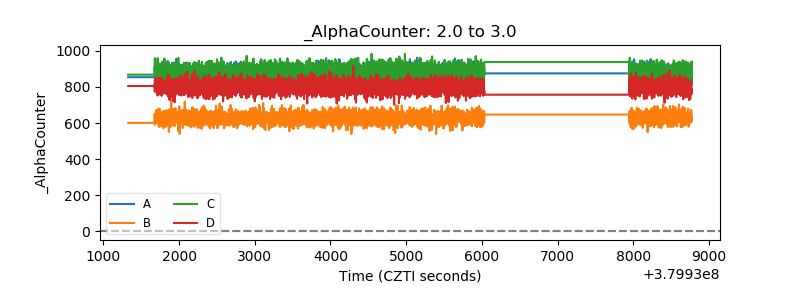 |
| _CPM_Rate | 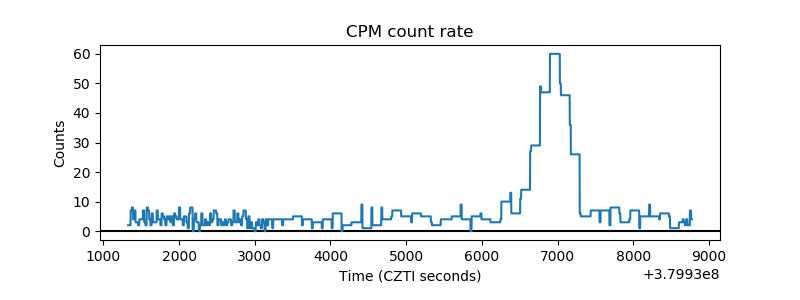 |
| CZT Counter | 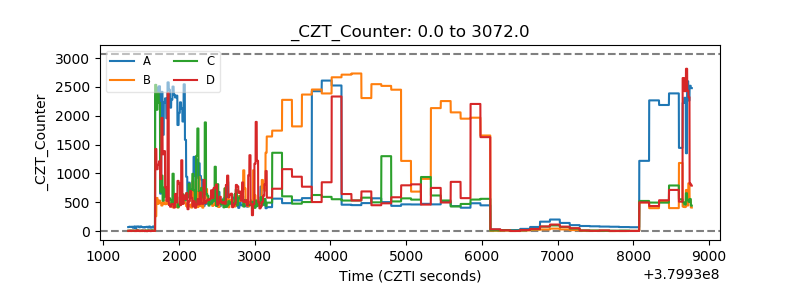 |
| +2.5 Volts monitor |  |
| +5 Volts monitor | 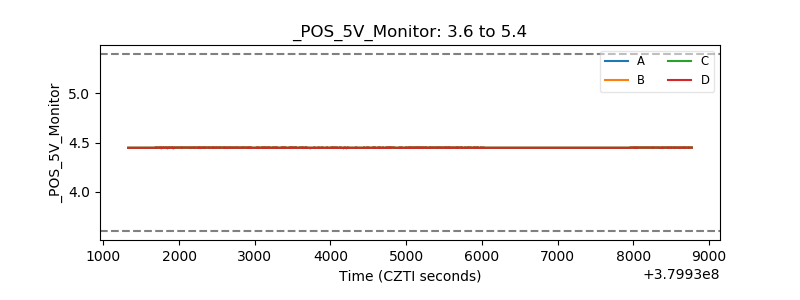 |
| _ROLL_ROT | 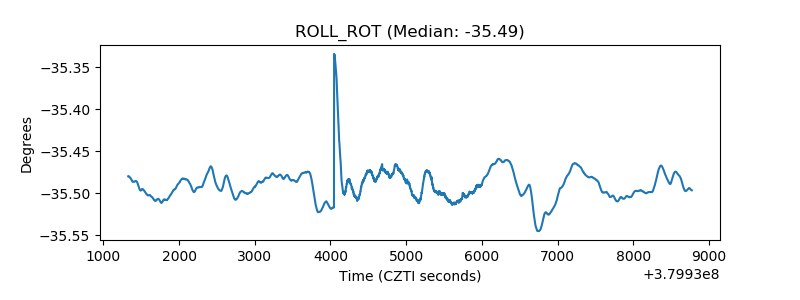 |
| _Roll_DEC | 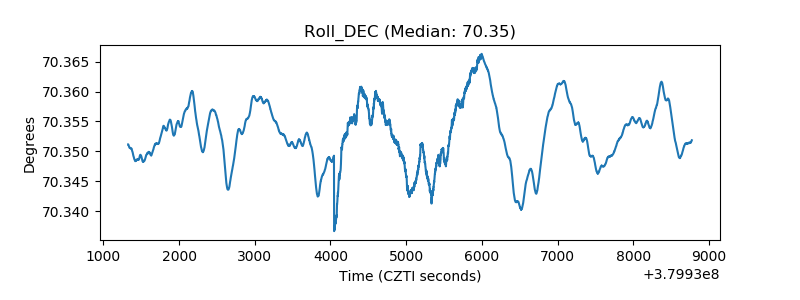 |
| _Roll_RA | 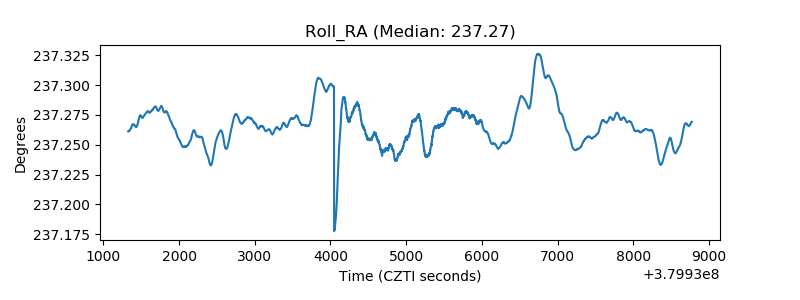 |
| Veto Counter | 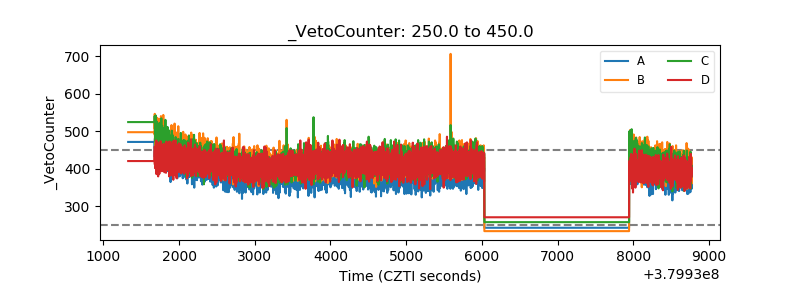 |