| Param | Original file | Final file |
|---|---|---|
| Filename | modeM0/AS1C07_001T04_9000004868_34064cztM0_level2.evt | modeM0/AS1C07_001T04_9000004868_34064cztM0_level2_quad_clean.evt |
| Size (bytes) | 638,242,560 | 81,656,640 |
| Size | 608.7 MB | 77.9 MB |
| Events in quadrant A | 5,996,681 | 497,950 |
| Events in quadrant B | 5,367,288 | 529,271 |
| Events in quadrant C | 3,359,178 | 545,554 |
| Events in quadrant D | 4,231,636 | 511,704 |
| Mode M9 | |||
|---|---|---|---|
| Quadrant | BADHDUFLAG | Total packets | Discarded packets |
| A | 0 | 20 | 0 |
| B | 0 | 20 | 0 |
| C | 0 | 20 | 0 |
| D | 0 | 21 | 0 |
| Mode SS | |||
|---|---|---|---|
| Quadrant | BADHDUFLAG | Total packets | Discarded packets |
| A | 0 | 114 | 0 |
| B | 0 | 114 | 0 |
| C | 0 | 114 | 0 |
| D | 0 | 114 | 0 |
| Mode M0 | |||
|---|---|---|---|
| Quadrant | BADHDUFLAG | Total packets | Discarded packets |
| A | 0 | 21315 | 3 |
| B | 0 | 19619 | 2 |
| C | 0 | 13288 | 2 |
| D | 0 | 16271 | 2 |
| Quadrant | Total seconds | Saturated seconds | Saturation percentage |
|---|---|---|---|
| A | 5531 | 1493 | 26.993310% |
| B | 5531 | 873 | 15.783764% |
| C | 5531 | 67 | 1.211354% |
| D | 5531 | 290 | 5.243175% |
Noise dominated data is calculated using 1-second bins in cleaned event files. If a bin has >2000 counts, and if more than 50% of those come from <1% of pixels, then it is considered to be noise-dominated and hence unusable.
| Quadrant | # 1 sec bins | Bins with >0 counts | Bins with >2000 counts | High rate bins dominated by noise | Noise dominated (total time) | Noise dominated (detector-on time) | Marked lightcurve |
|---|---|---|---|---|---|---|---|
| A | 7084 | 5532 | 1400 | 1400 | 19.76% | 25.31% | 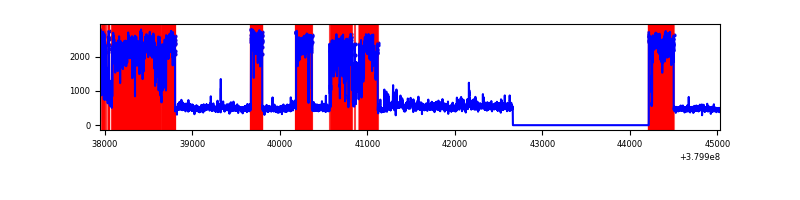 |
| B | 7084 | 5532 | 755 | 755 | 10.66% | 13.65% | 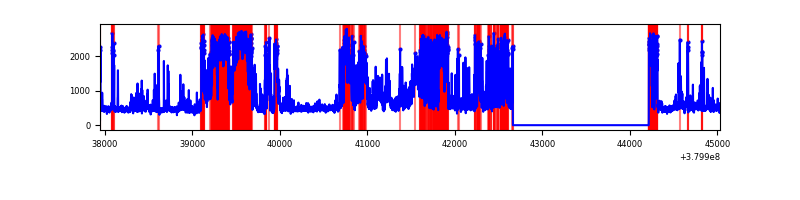 |
| C | 7084 | 5532 | 52 | 52 | 0.73% | 0.94% | 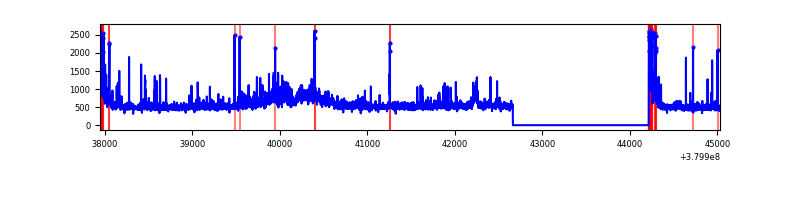 |
| D | 7084 | 5532 | 298 | 298 | 4.21% | 5.39% | 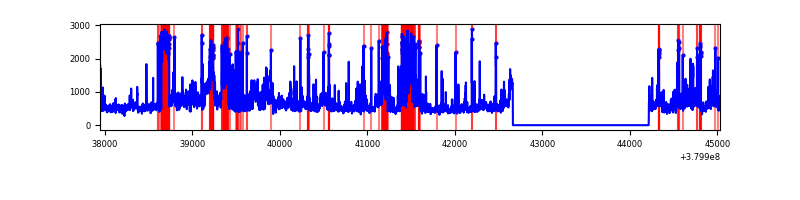 |
Top three noisy pixels from each quadrant. If the there are fewer than three noisy pixels in the level2.evt file, extra rows are filled as -1
| Pixel properties | Quadrant properties | ||||||
|---|---|---|---|---|---|---|---|
| Quadrant | DetID | PixID | Counts | Sigma | Mean | Median | Sigma |
| A | 15 | 169 | 3773563 | 33083.43 | 570 | 558 | 114.0 |
| A | 10 | 83 | 13733 | 115.52 | 570 | 558 | 114.0 |
| A | 13 | 254 | 8392 | 68.69 | 570 | 558 | 114.0 |
| B | 5 | 172 | 1252899 | 10913.73 | 602 | 586 | 114.7 |
| B | 5 | 31 | 722621 | 6292.43 | 602 | 586 | 114.7 |
| B | 5 | 15 | 606610 | 5281.41 | 602 | 586 | 114.7 |
| C | 3 | 233 | 289688 | 2051.27 | 614 | 619 | 140.9 |
| C | 0 | 10 | 277904 | 1967.65 | 614 | 619 | 140.9 |
| C | 15 | 214 | 244231 | 1728.7 | 614 | 619 | 140.9 |
| D | 8 | 195 | 468908 | 3135.36 | 608 | 589 | 149.4 |
| D | 2 | 250 | 458503 | 3065.7 | 608 | 589 | 149.4 |
| D | 10 | 118 | 433484 | 2898.2 | 608 | 589 | 149.4 |
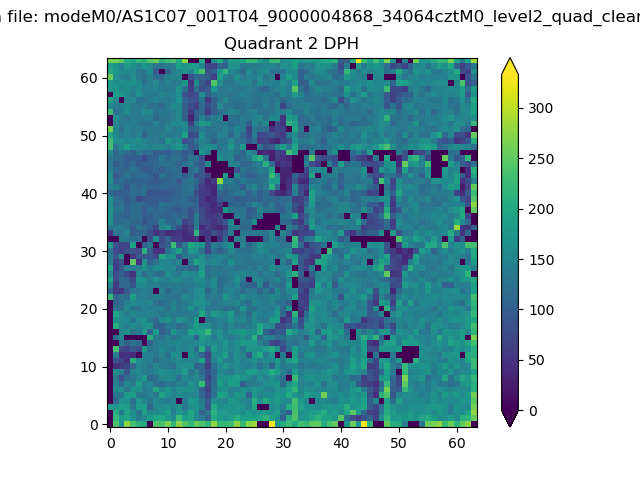
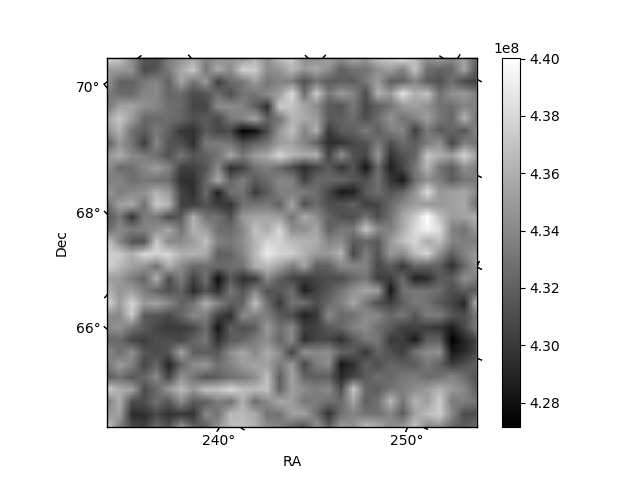
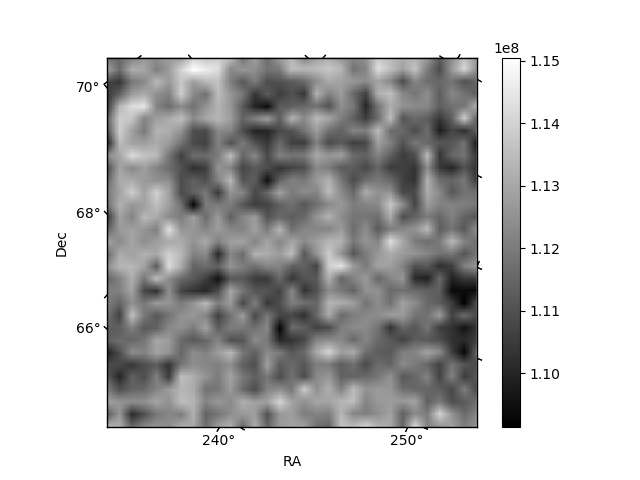
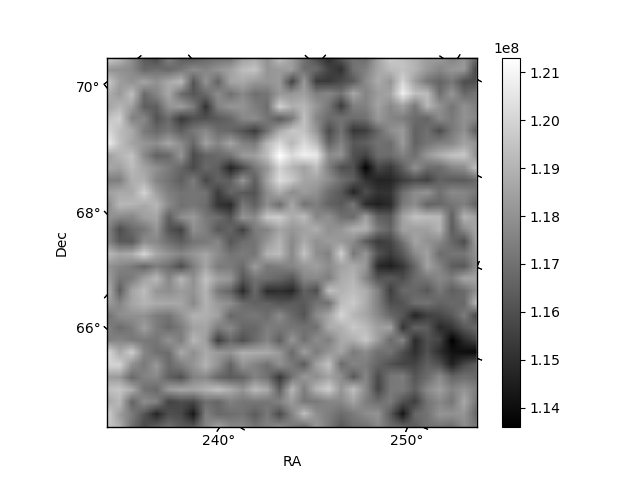
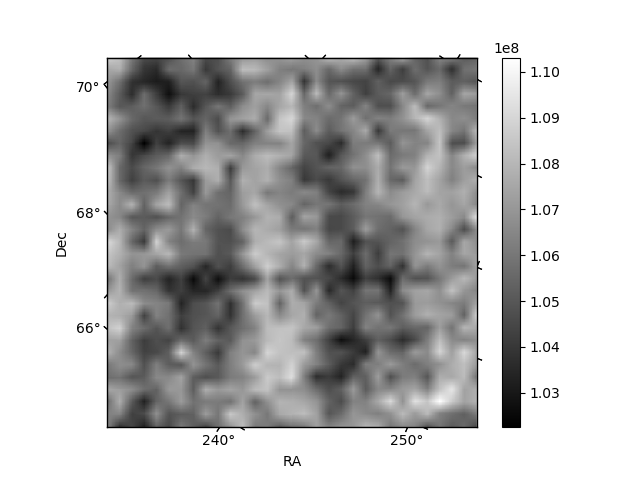
Histogram calculated using DETX and DETY for each event in the final _common_clean file
| Quadrant A | 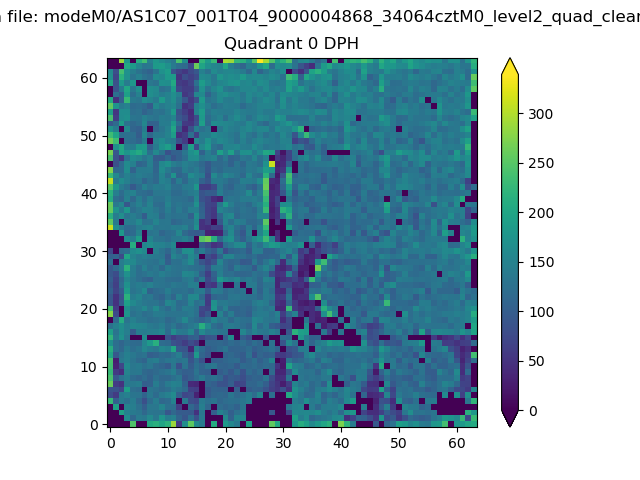 |
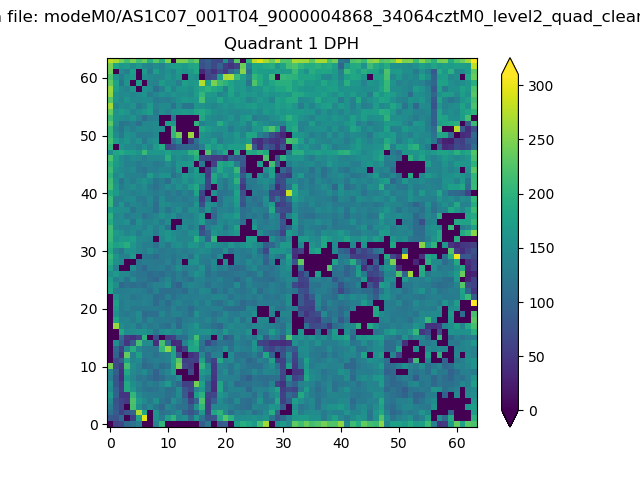 |
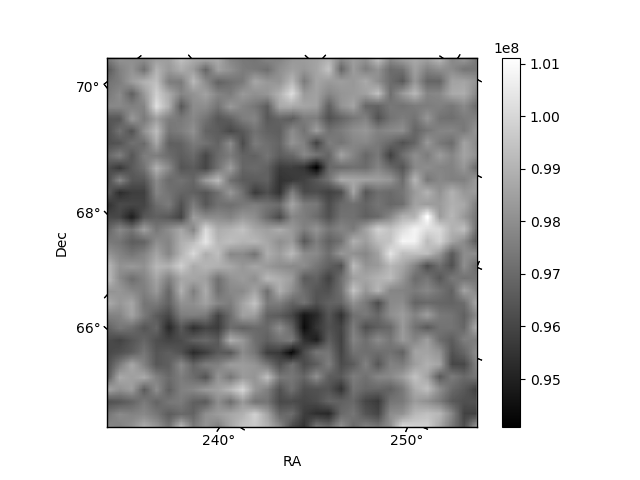
Quadrant B |
|---|---|---|---|
| Quadrant D | 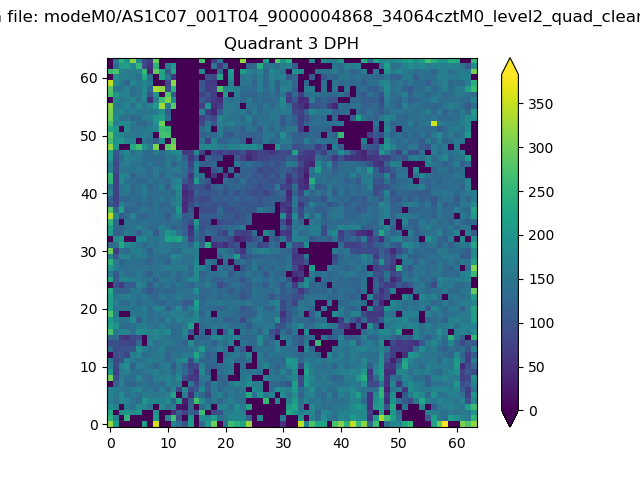 |
 |
Quadrant C |
| Plot type | Count rate plots | Images |
|---|---|---|
| Comparison with Poisson distribution Blue bars denote a histogram of data divided into 1 sec bins. Red curve is a Poisson curve with rate = median count rate of data. |
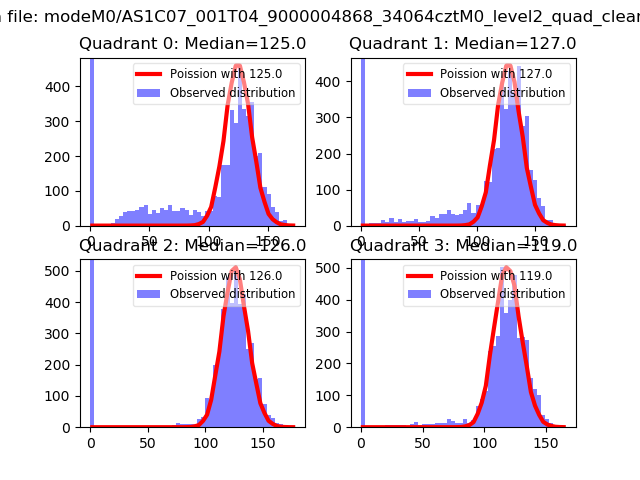 |
 |
| Quadrant-wise count rates Data is divided into 100 sec bins |
 |
|
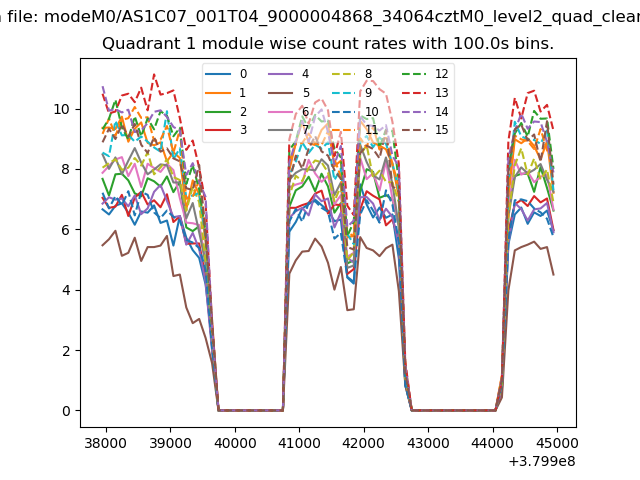
| Module-wise count rates for Quadrant A Data is divided into 100 sec bins |
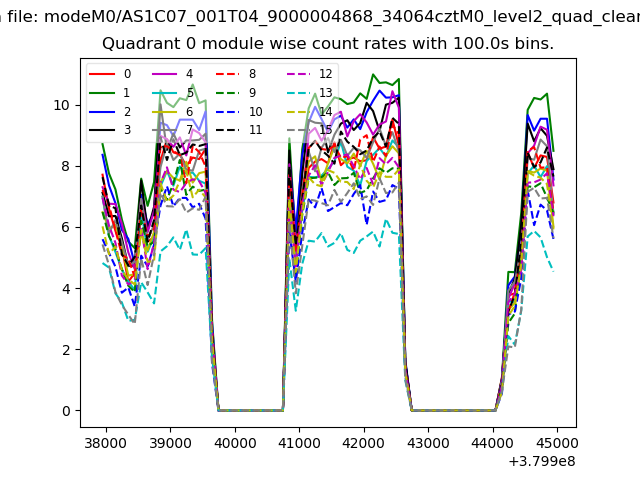 |
 |
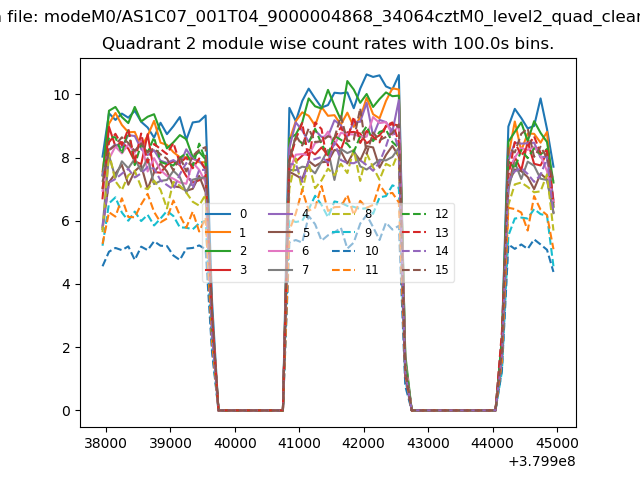
| Module-wise count rates for Quadrant B Data is divided into 100 sec bins |
 |
 |
| Module-wise count rates for Quadrant C Data is divided into 100 sec bins |
 |
 |
| Module-wise count rates for Quadrant D Data is divided into 100 sec bins |
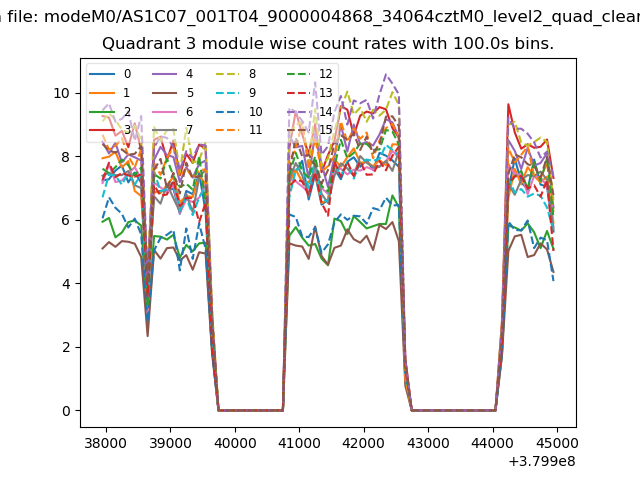 |
 |
| Parameter | Plot |
|---|---|
| CZT HV Monitor | 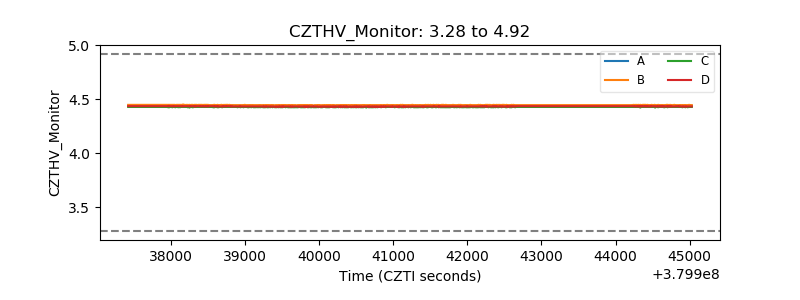 |
| D_VDD | 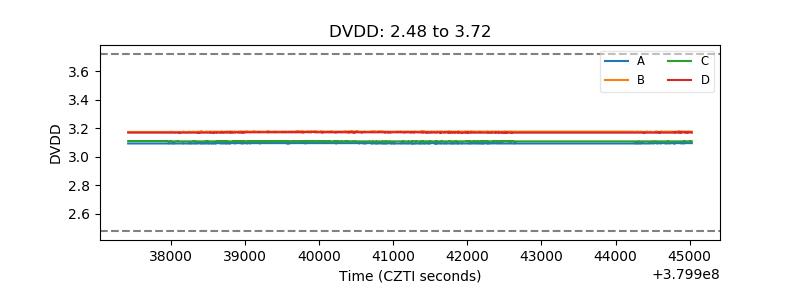 |
| Temperature 1 | 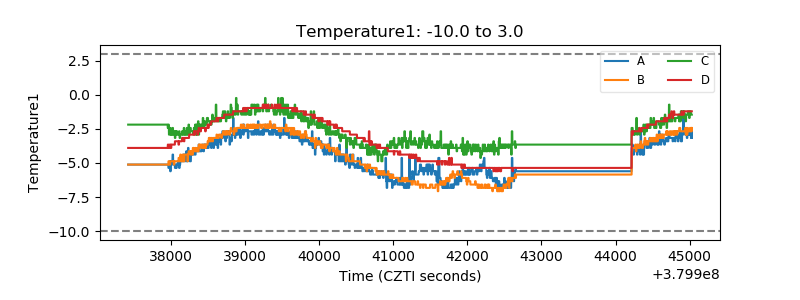 |
| Veto HV Monitor | 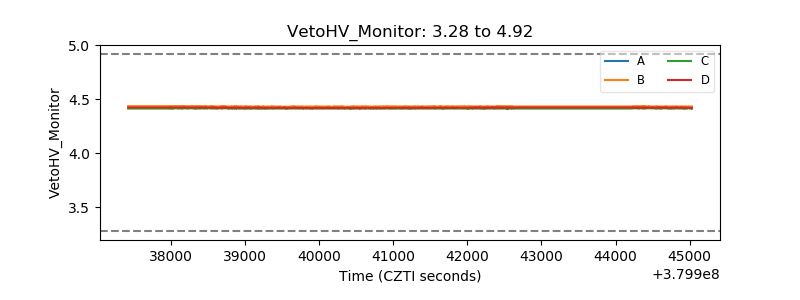 |
| Veto LLD | 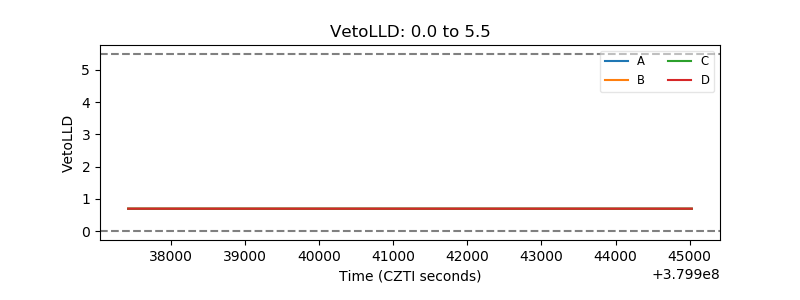 |
| Alpha Counter |  |
| _CPM_Rate | 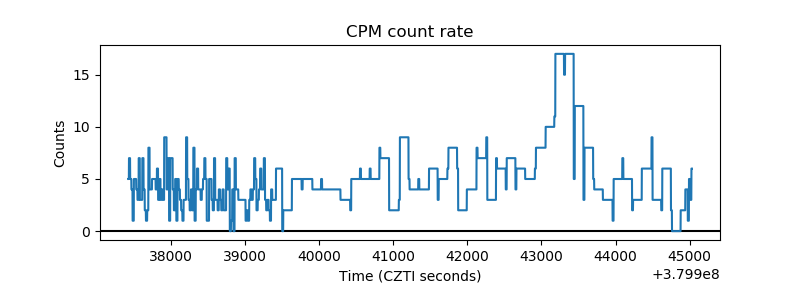 |
| CZT Counter | 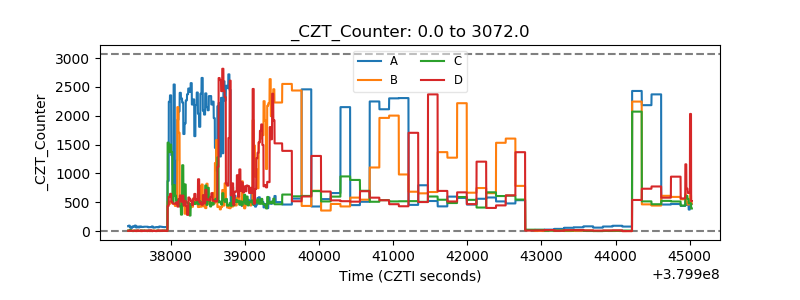 |
| +2.5 Volts monitor |  |
| +5 Volts monitor |  |
| _ROLL_ROT | 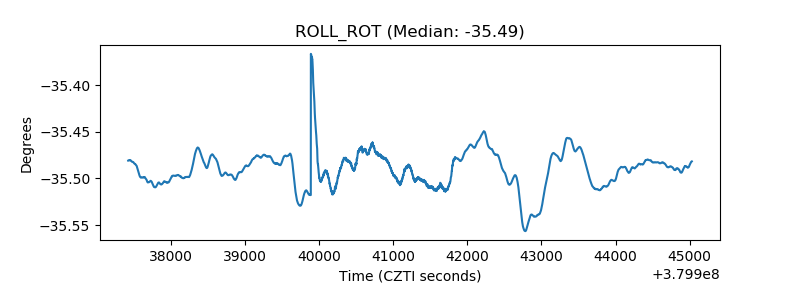 |
| _Roll_DEC | 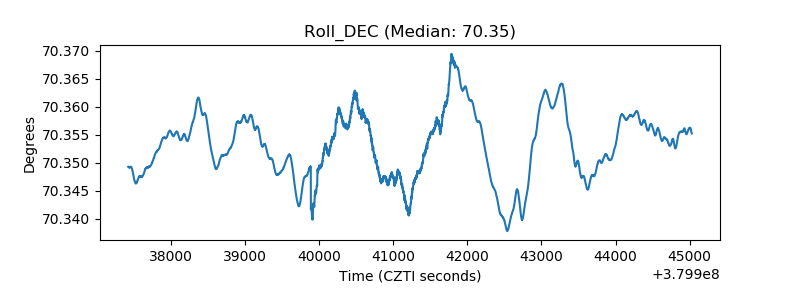 |
| _Roll_RA | 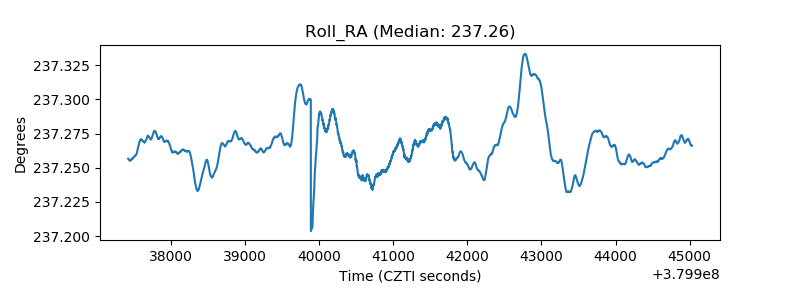 |
| Veto Counter | 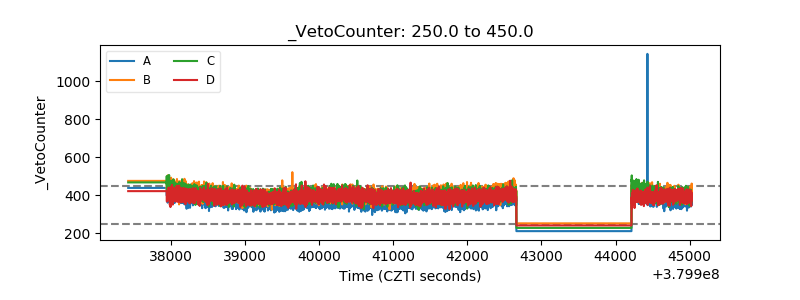 |