| Param | Original file | Final file |
|---|---|---|
| Filename | modeM0/AS1C07_001T04_9000004868_34065cztM0_level2.evt | modeM0/AS1C07_001T04_9000004868_34065cztM0_level2_quad_clean.evt |
| Size (bytes) | 587,917,440 | 87,693,120 |
| Size | 560.7 MB | 83.6 MB |
| Events in quadrant A | 4,962,866 | 558,083 |
| Events in quadrant B | 3,958,964 | 579,904 |
| Events in quadrant C | 3,353,313 | 573,664 |
| Events in quadrant D | 5,137,740 | 538,272 |
| Mode M9 | |||
|---|---|---|---|
| Quadrant | BADHDUFLAG | Total packets | Discarded packets |
| A | 0 | 19 | 0 |
| B | 0 | 19 | 0 |
| C | 0 | 19 | 0 |
| D | 0 | 20 | 0 |
| Mode SS | |||
|---|---|---|---|
| Quadrant | BADHDUFLAG | Total packets | Discarded packets |
| A | 0 | 120 | 0 |
| B | 0 | 120 | 0 |
| C | 0 | 120 | 0 |
| D | 0 | 120 | 0 |
| Mode M0 | |||
|---|---|---|---|
| Quadrant | BADHDUFLAG | Total packets | Discarded packets |
| A | 0 | 18639 | 3 |
| B | 0 | 15418 | 2 |
| C | 0 | 13249 | 2 |
| D | 0 | 19387 | 2 |
| Quadrant | Total seconds | Saturated seconds | Saturation percentage |
|---|---|---|---|
| A | 5791 | 647 | 11.172509% |
| B | 5791 | 374 | 6.458297% |
| C | 5791 | 76 | 1.312381% |
| D | 5791 | 387 | 6.682784% |
Noise dominated data is calculated using 1-second bins in cleaned event files. If a bin has >2000 counts, and if more than 50% of those come from <1% of pixels, then it is considered to be noise-dominated and hence unusable.
| Quadrant | # 1 sec bins | Bins with >0 counts | Bins with >2000 counts | High rate bins dominated by noise | Noise dominated (total time) | Noise dominated (detector-on time) | Marked lightcurve |
|---|---|---|---|---|---|---|---|
| A | 7134 | 5792 | 552 | 552 | 7.74% | 9.53% | 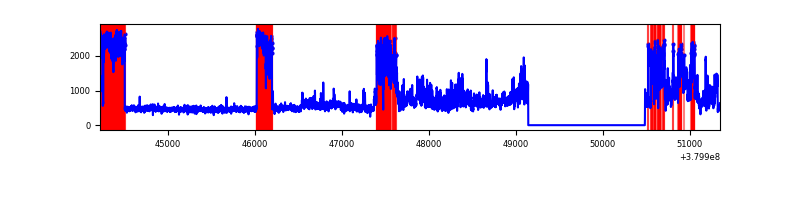 |
| B | 7133 | 5791 | 304 | 304 | 4.26% | 5.25% | 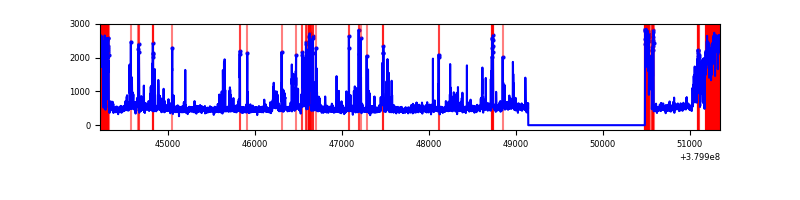 |
| C | 7134 | 5792 | 68 | 68 | 0.95% | 1.17% | 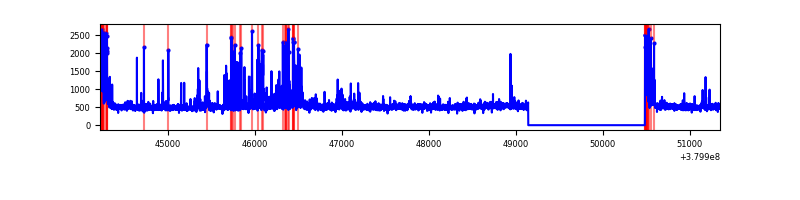 |
| D | 7134 | 5792 | 384 | 384 | 5.38% | 6.63% | 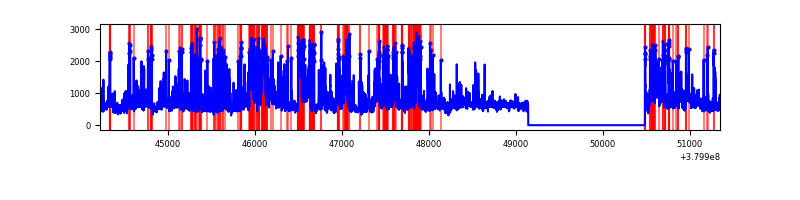 |
Top three noisy pixels from each quadrant. If the there are fewer than three noisy pixels in the level2.evt file, extra rows are filled as -1
| Pixel properties | Quadrant properties | ||||||
|---|---|---|---|---|---|---|---|
| Quadrant | DetID | PixID | Counts | Sigma | Mean | Median | Sigma |
| A | 15 | 169 | 2474235 | 19279.14 | 639 | 626 | 128.3 |
| A | 10 | 83 | 15246 | 113.95 | 639 | 626 | 128.3 |
| A | 13 | 254 | 9925 | 72.48 | 639 | 626 | 128.3 |
| B | 5 | 172 | 718833 | 5765.87 | 651 | 636 | 124.6 |
| B | 5 | 31 | 183408 | 1467.34 | 651 | 636 | 124.6 |
| B | 5 | 15 | 166798 | 1333.99 | 651 | 636 | 124.6 |
| C | 15 | 214 | 254150 | 1708.64 | 643 | 647 | 148.4 |
| C | 0 | 207 | 236931 | 1592.59 | 643 | 647 | 148.4 |
| C | 0 | 10 | 220424 | 1481.33 | 643 | 647 | 148.4 |
| D | 8 | 195 | 574832 | 3655.35 | 635 | 616 | 157.1 |
| D | 2 | 249 | 570831 | 3629.88 | 635 | 616 | 157.1 |
| D | 1 | 52 | 500686 | 3183.35 | 635 | 616 | 157.1 |
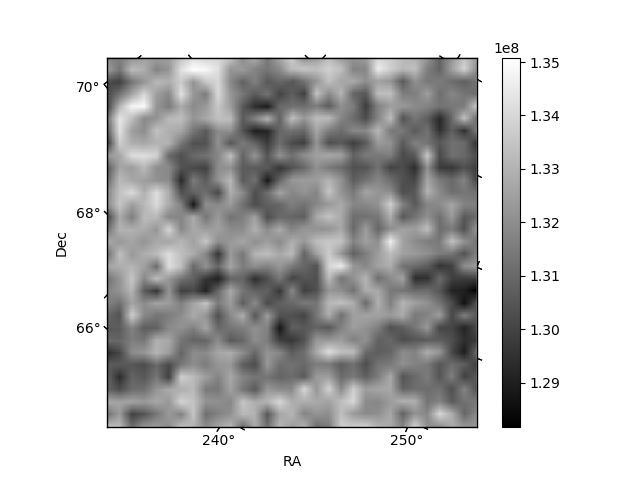
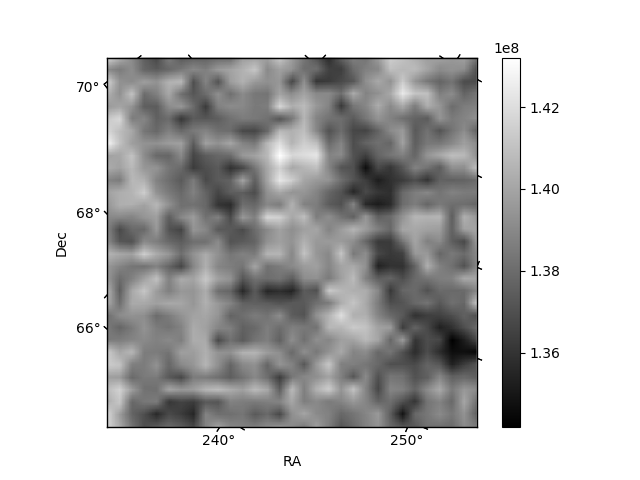
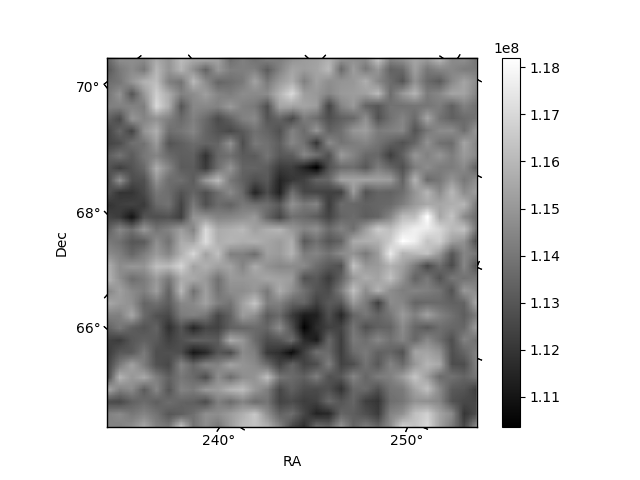
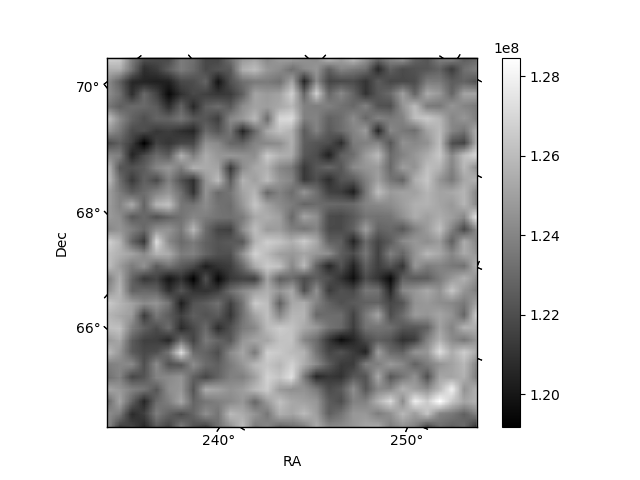
Histogram calculated using DETX and DETY for each event in the final _common_clean file
| Quadrant A | 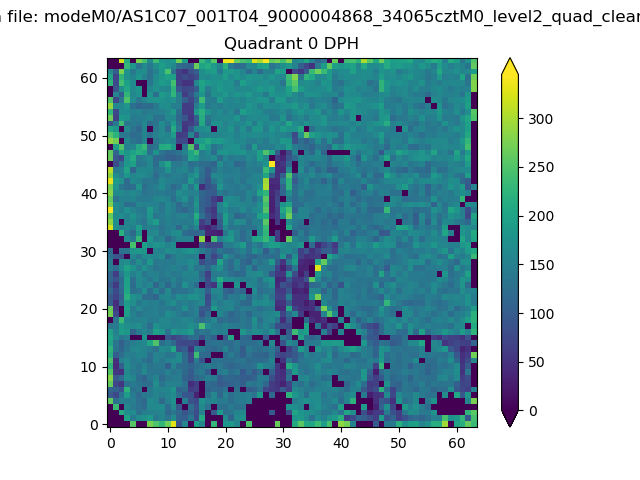 |
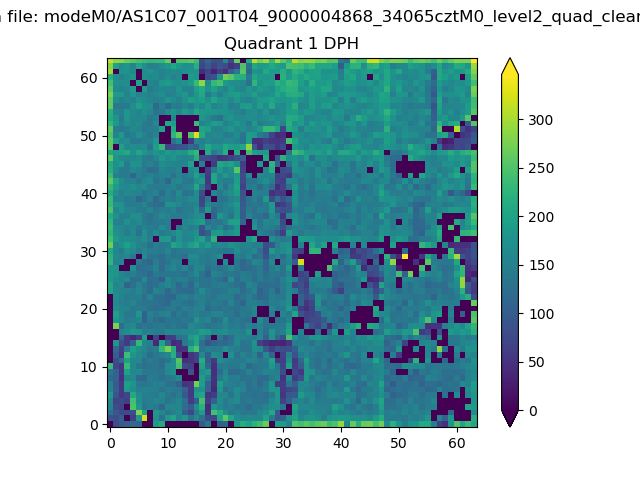 |
Quadrant B |
|---|---|---|---|
| Quadrant D | 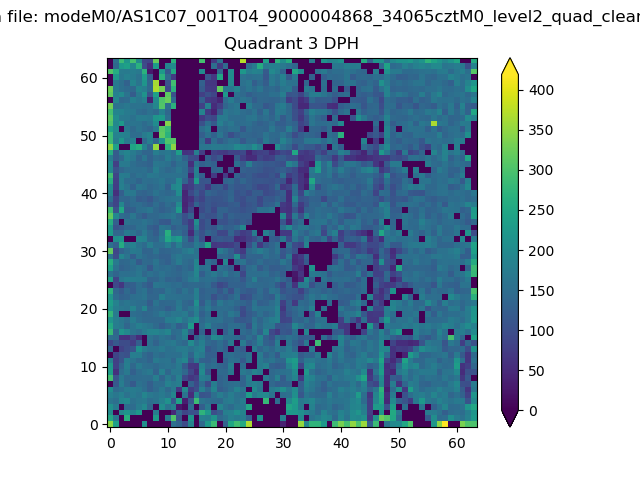 |
 |
Quadrant C |
| Plot type | Count rate plots | Images |
|---|---|---|
| Comparison with Poisson distribution Blue bars denote a histogram of data divided into 1 sec bins. Red curve is a Poisson curve with rate = median count rate of data. |
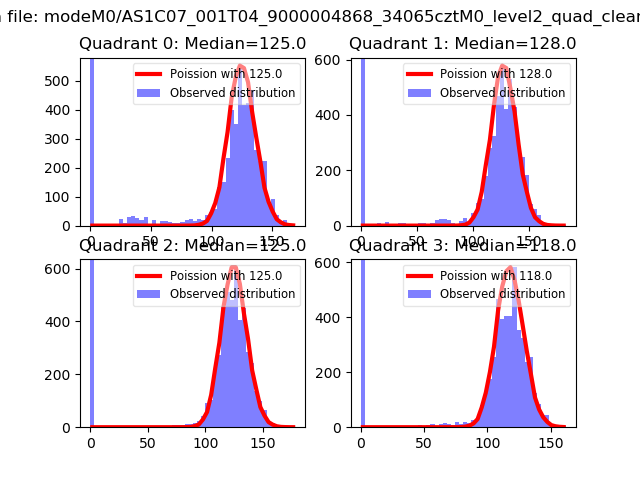 |
 |
| Quadrant-wise count rates Data is divided into 100 sec bins |
 |
|
| Module-wise count rates for Quadrant A Data is divided into 100 sec bins |
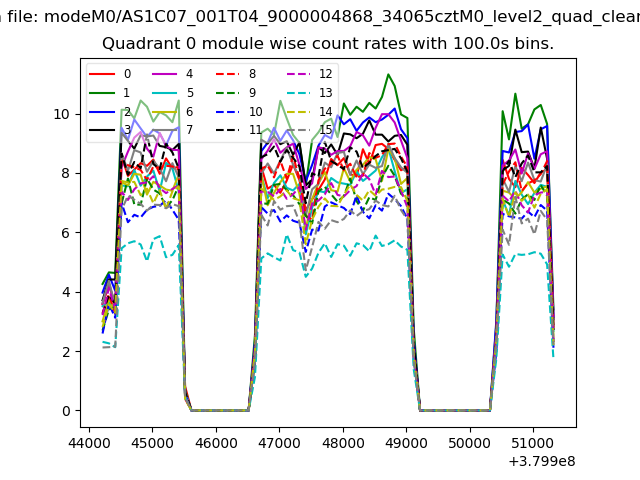 |
 |
| Module-wise count rates for Quadrant B Data is divided into 100 sec bins |
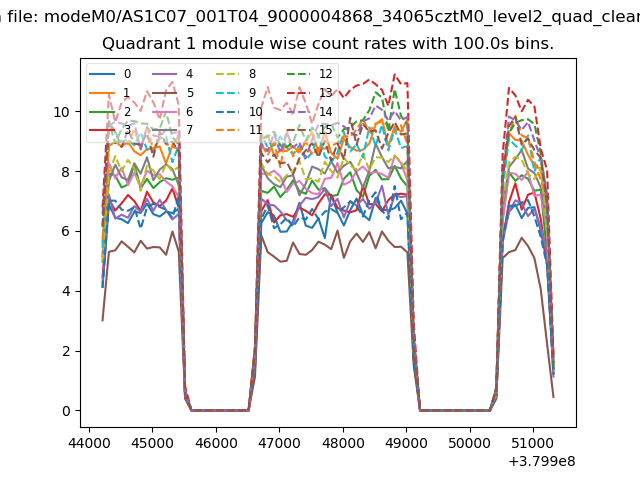 |
 |
| Module-wise count rates for Quadrant C Data is divided into 100 sec bins |
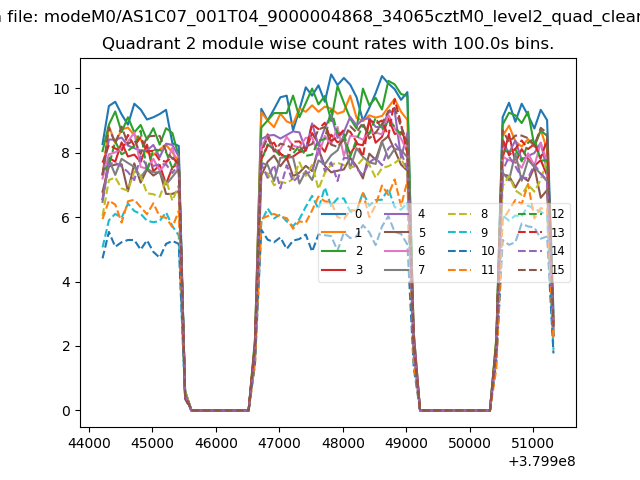 |
 |
| Module-wise count rates for Quadrant D Data is divided into 100 sec bins |
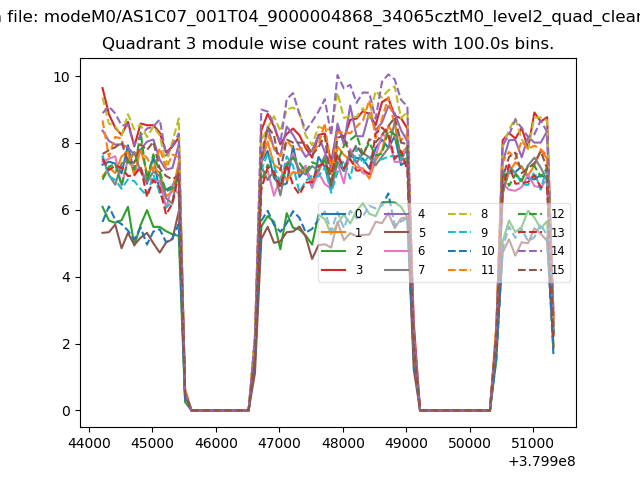 |
 |
| Parameter | Plot |
|---|---|
| CZT HV Monitor | 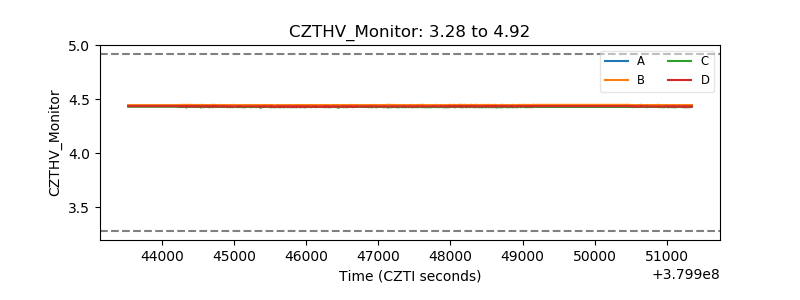 |
| D_VDD | 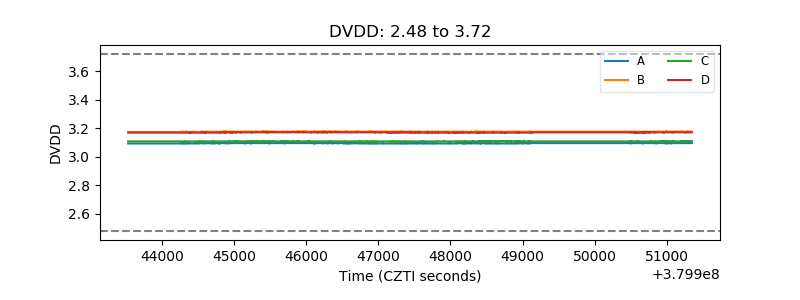 |
| Temperature 1 | 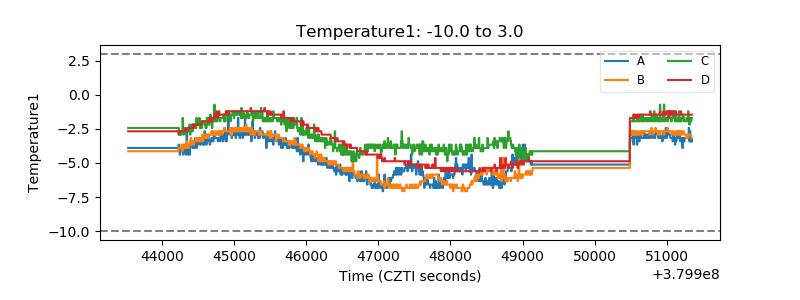 |
| Veto HV Monitor | 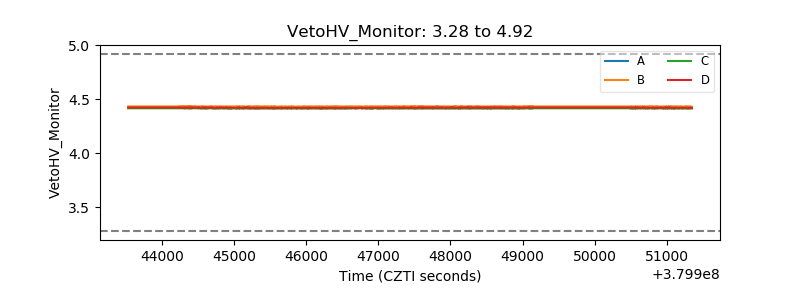 |
| Veto LLD | 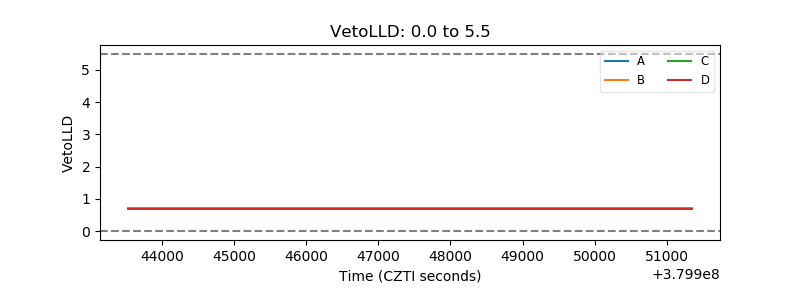 |
| Alpha Counter | 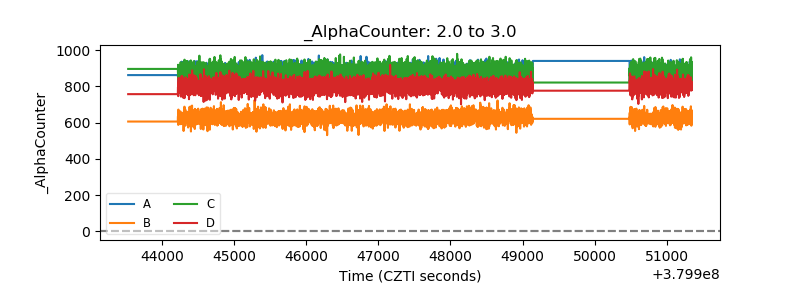 |
| _CPM_Rate |  |
| CZT Counter |  |
| +2.5 Volts monitor |  |
| +5 Volts monitor |  |
| _ROLL_ROT | 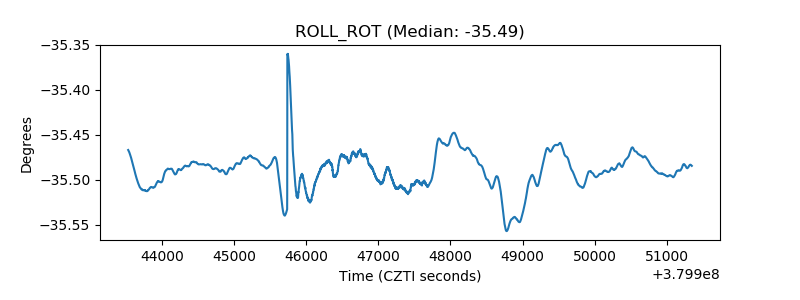 |
| _Roll_DEC | 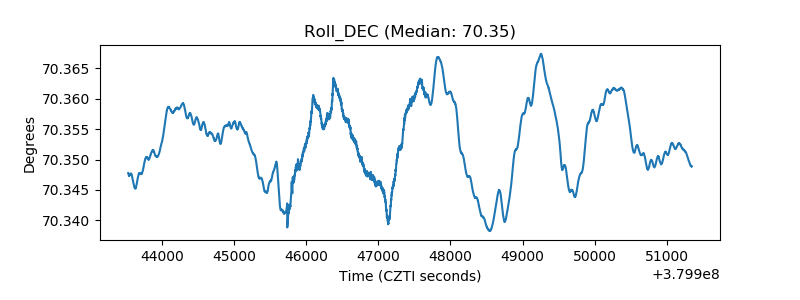 |
| _Roll_RA |  |
| Veto Counter | 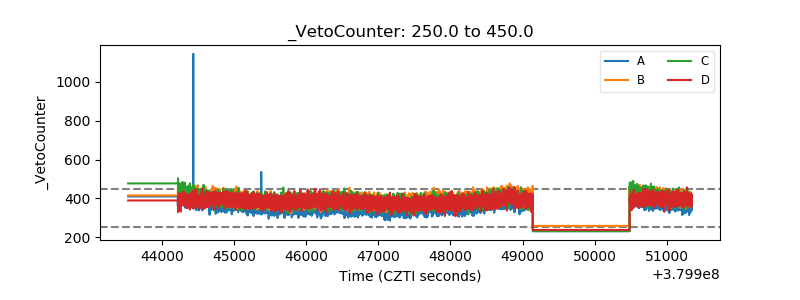 |