| Param | Original file | Final file |
|---|---|---|
| Filename | modeM0/AS1C07_001T04_9000004868_34070cztM0_level2.evt | modeM0/AS1C07_001T04_9000004868_34070cztM0_level2_quad_clean.evt |
| Size (bytes) | 479,638,080 | 100,186,560 |
| Size | 457.4 MB | 95.5 MB |
| Events in quadrant A | 2,719,580 | 672,439 |
| Events in quadrant B | 3,848,946 | 666,516 |
| Events in quadrant C | 3,320,084 | 670,338 |
| Events in quadrant D | 4,253,079 | 628,673 |
| Mode M9 | |||
|---|---|---|---|
| Quadrant | BADHDUFLAG | Total packets | Discarded packets |
| A | 0 | 24 | 0 |
| B | 0 | 24 | 0 |
| C | 0 | 24 | 0 |
| D | 0 | 25 | 0 |
| Mode SS | |||
|---|---|---|---|
| Quadrant | BADHDUFLAG | Total packets | Discarded packets |
| A | 0 | 116 | 0 |
| B | 0 | 116 | 0 |
| C | 0 | 116 | 0 |
| D | 0 | 116 | 0 |
| Mode M0 | |||
|---|---|---|---|
| Quadrant | BADHDUFLAG | Total packets | Discarded packets |
| A | 0 | 11973 | 3 |
| B | 0 | 15228 | 2 |
| C | 0 | 13295 | 2 |
| D | 0 | 16616 | 2 |
| Quadrant | Total seconds | Saturated seconds | Saturation percentage |
|---|---|---|---|
| A | 5660 | 11 | 0.194346% |
| B | 5660 | 343 | 6.060071% |
| C | 5660 | 105 | 1.855124% |
| D | 5660 | 211 | 3.727915% |
Noise dominated data is calculated using 1-second bins in cleaned event files. If a bin has >2000 counts, and if more than 50% of those come from <1% of pixels, then it is considered to be noise-dominated and hence unusable.
| Quadrant | # 1 sec bins | Bins with >0 counts | Bins with >2000 counts | High rate bins dominated by noise | Noise dominated (total time) | Noise dominated (detector-on time) | Marked lightcurve |
|---|---|---|---|---|---|---|---|
| A | 7362 | 5661 | 0 | 0 | 0.00% | 0.00% | 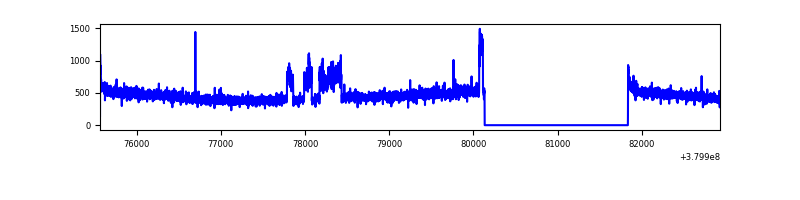 |
| B | 7362 | 5660 | 258 | 258 | 3.50% | 4.56% | 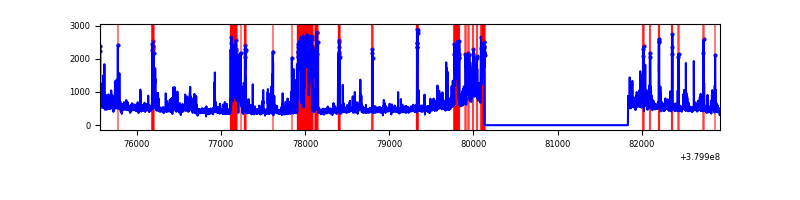 |
| C | 7362 | 5661 | 74 | 74 | 1.01% | 1.31% | 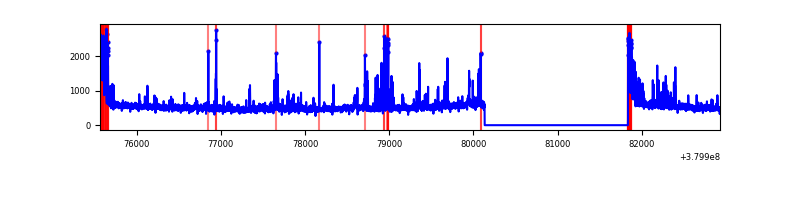 |
| D | 7362 | 5661 | 195 | 195 | 2.65% | 3.44% | 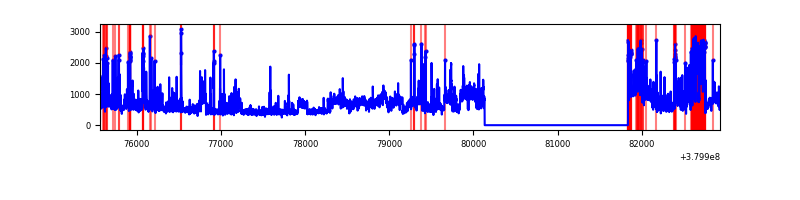 |
Top three noisy pixels from each quadrant. If the there are fewer than three noisy pixels in the level2.evt file, extra rows are filled as -1
| Pixel properties | Quadrant properties | ||||||
|---|---|---|---|---|---|---|---|
| Quadrant | DetID | PixID | Counts | Sigma | Mean | Median | Sigma |
| A | 15 | 169 | 185262 | 1430.53 | 647 | 634 | 129.1 |
| A | 10 | 83 | 19737 | 148.01 | 647 | 634 | 129.1 |
| A | 13 | 6 | 12672 | 93.27 | 647 | 634 | 129.1 |
| B | 5 | 172 | 689290 | 5718.05 | 636 | 619 | 120.4 |
| B | 5 | 31 | 205713 | 1702.9 | 636 | 619 | 120.4 |
| B | 0 | 189 | 141310 | 1168.16 | 636 | 619 | 120.4 |
| C | 0 | 10 | 346162 | 2383.41 | 629 | 634 | 145.0 |
| C | 15 | 214 | 244823 | 1684.39 | 629 | 634 | 145.0 |
| C | 0 | 207 | 129168 | 886.61 | 629 | 634 | 145.0 |
| D | 8 | 195 | 935484 | 6123.05 | 621 | 604 | 152.7 |
| D | 10 | 118 | 299974 | 1960.74 | 621 | 604 | 152.7 |
| D | 2 | 250 | 253145 | 1654.03 | 621 | 604 | 152.7 |
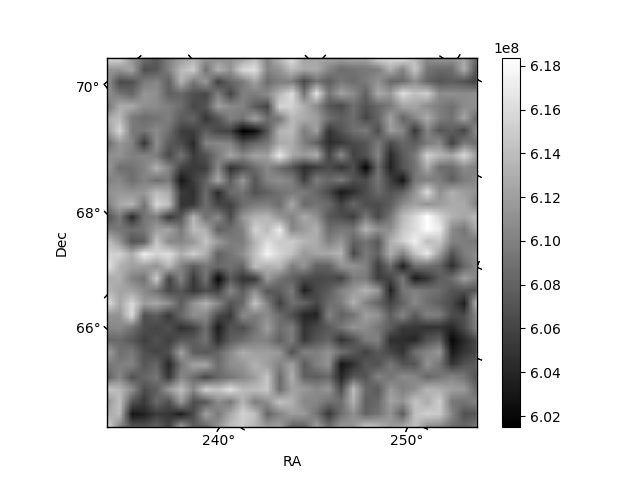
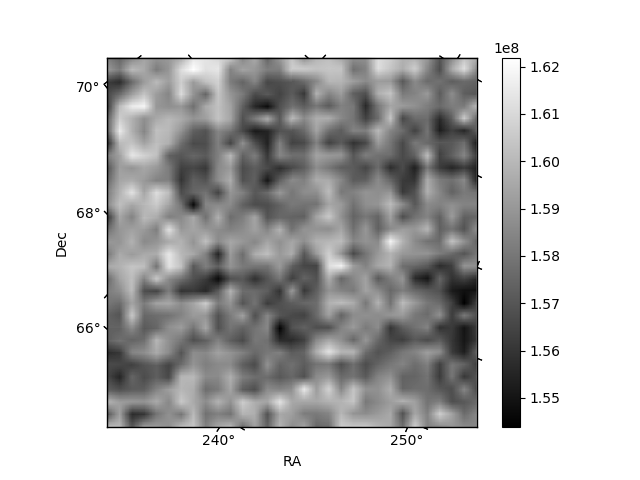
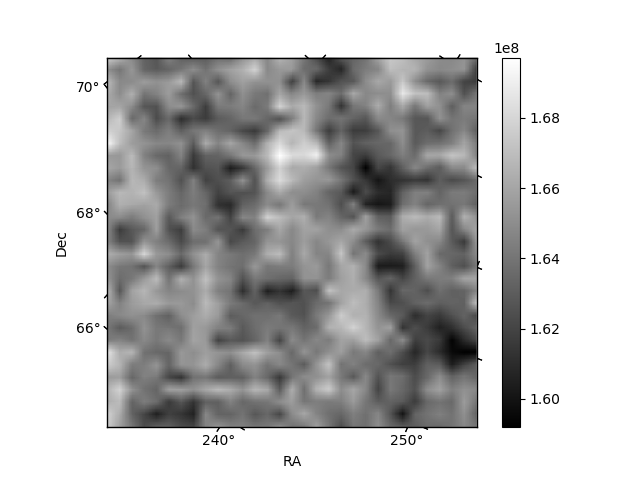
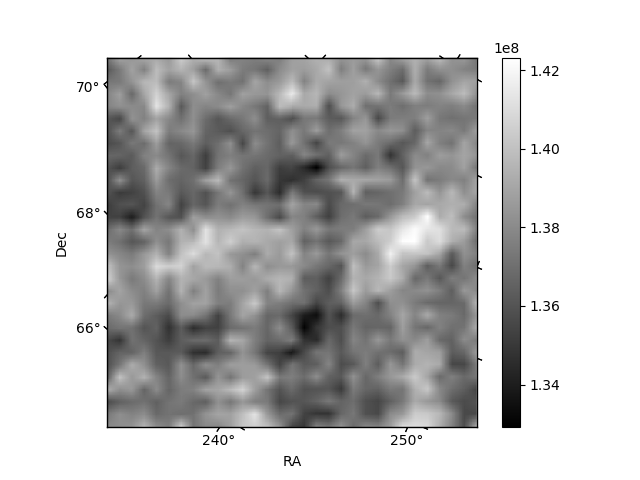
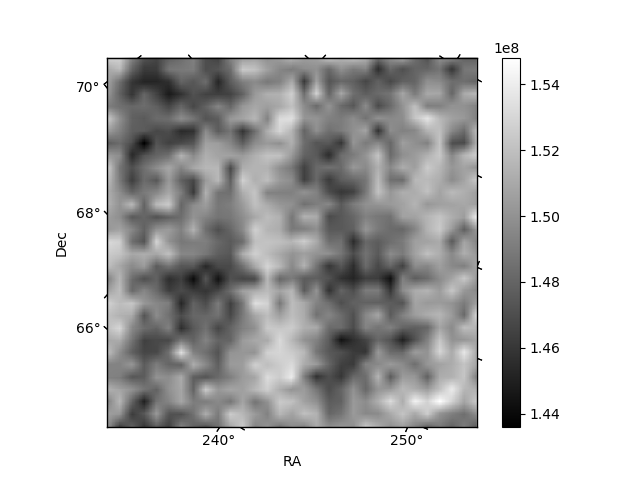
Histogram calculated using DETX and DETY for each event in the final _common_clean file
| Quadrant A |  |
 |
Quadrant B |
|---|---|---|---|
| Quadrant D |  |
 |
Quadrant C |
| Plot type | Count rate plots | Images |
|---|---|---|
| Comparison with Poisson distribution Blue bars denote a histogram of data divided into 1 sec bins. Red curve is a Poisson curve with rate = median count rate of data. |
 |
 |
| Quadrant-wise count rates Data is divided into 100 sec bins |
 |
|
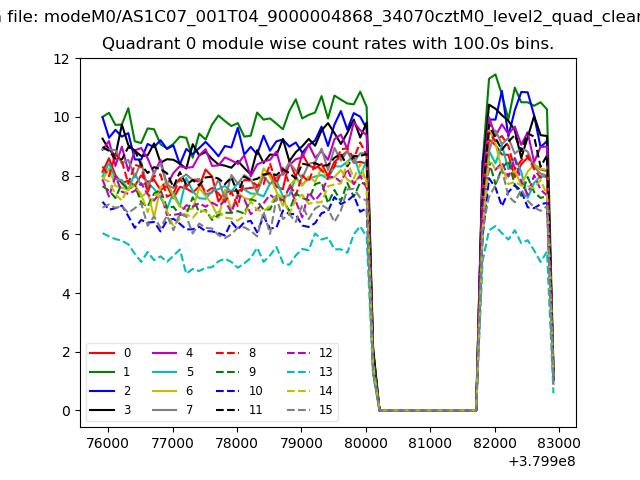
| Module-wise count rates for Quadrant A Data is divided into 100 sec bins |
 |
 |
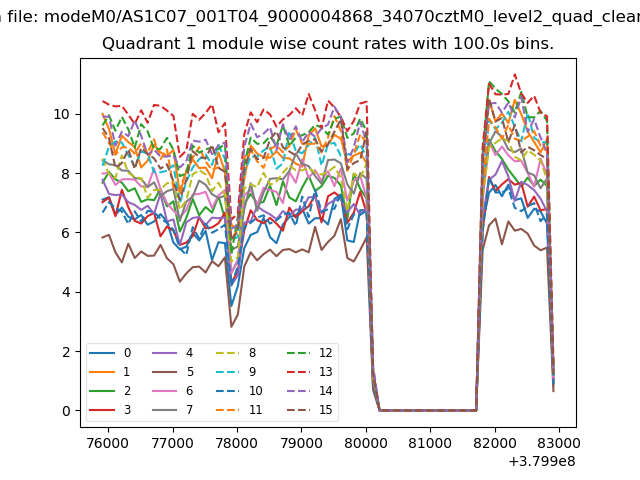
| Module-wise count rates for Quadrant B Data is divided into 100 sec bins |
 |
 |
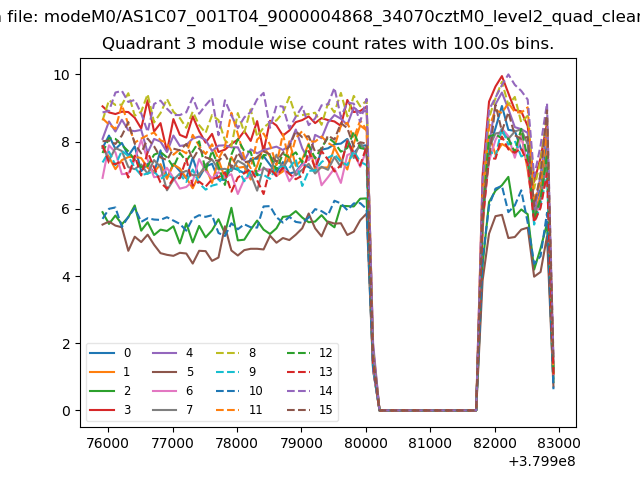
| Module-wise count rates for Quadrant C Data is divided into 100 sec bins |
 |
 |
| Module-wise count rates for Quadrant D Data is divided into 100 sec bins |
 |
 |
| Parameter | Plot |
|---|---|
| CZT HV Monitor | 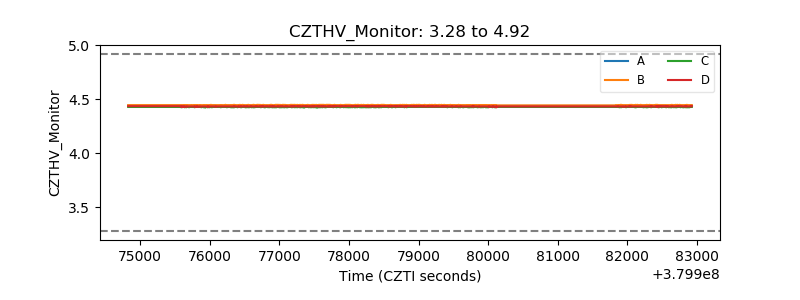 |
| D_VDD | 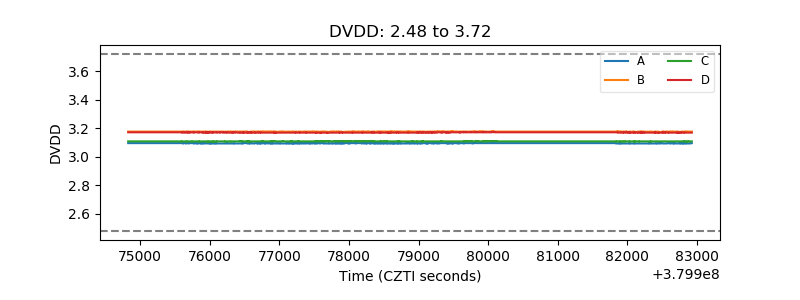 |
| Temperature 1 | 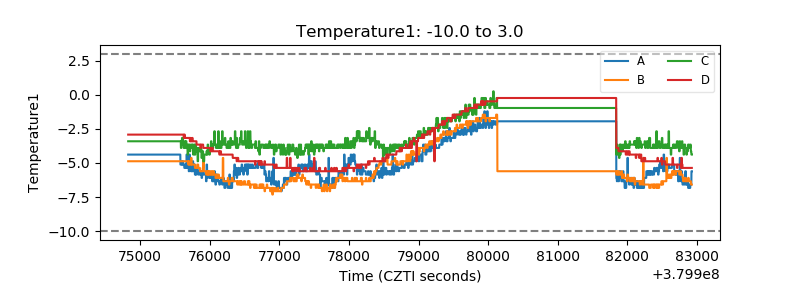 |
| Veto HV Monitor | 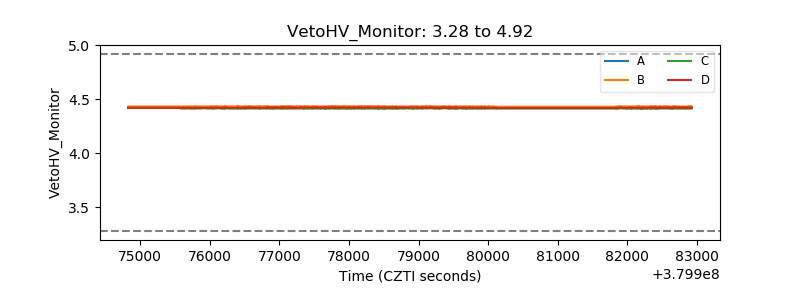 |
| Veto LLD | 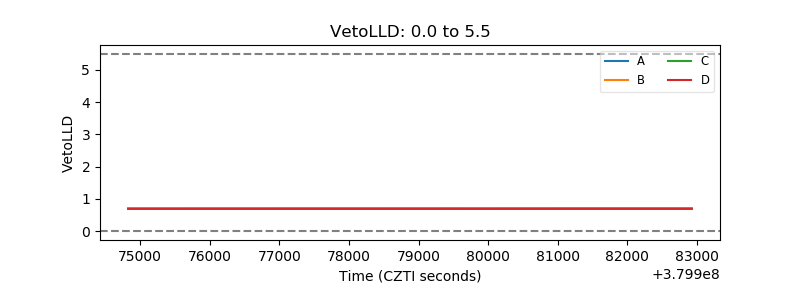 |
| Alpha Counter |  |
| _CPM_Rate | 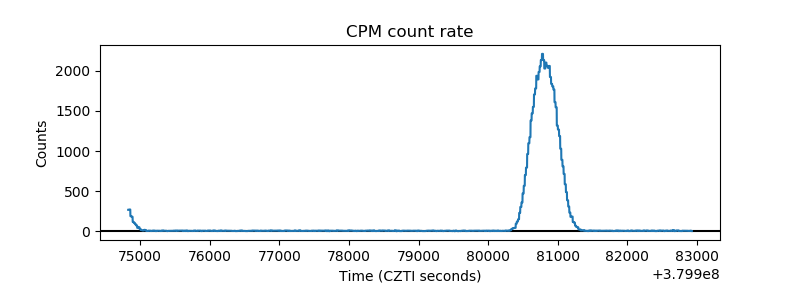 |
| CZT Counter |  |
| +2.5 Volts monitor |  |
| +5 Volts monitor |  |
| _ROLL_ROT | 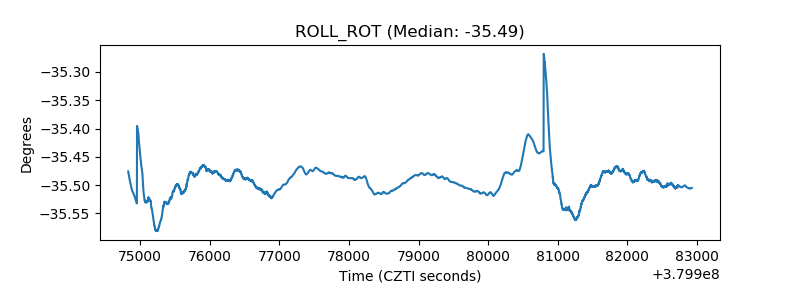 |
| _Roll_DEC | 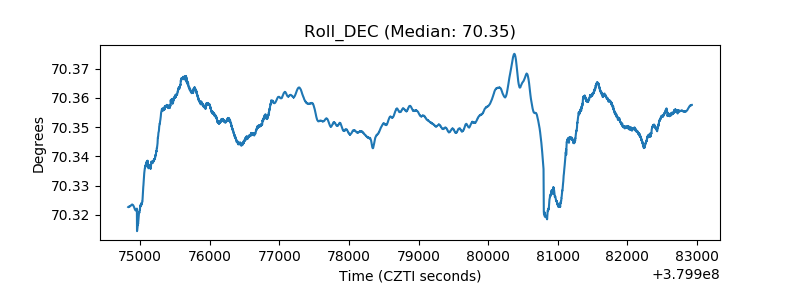 |
| _Roll_RA | 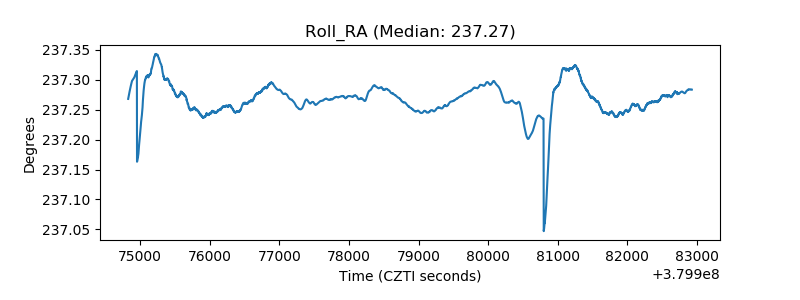 |
| Veto Counter | 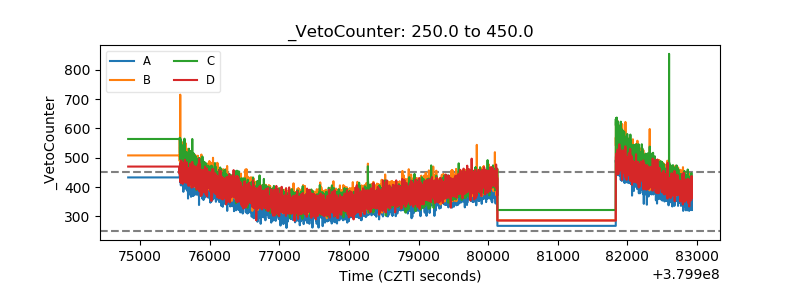 |