| Param | Original file | Final file |
|---|---|---|
| Filename | modeM0/AS1C07_001T04_9000004868_34072cztM0_level2.evt | modeM0/AS1C07_001T04_9000004868_34072cztM0_level2_quad_clean.evt |
| Size (bytes) | 492,629,760 | 105,517,440 |
| Size | 469.8 MB | 100.6 MB |
| Events in quadrant A | 2,481,105 | 722,347 |
| Events in quadrant B | 3,210,166 | 732,744 |
| Events in quadrant C | 4,184,204 | 700,406 |
| Events in quadrant D | 4,673,631 | 657,971 |
| Mode M9 | |||
|---|---|---|---|
| Quadrant | BADHDUFLAG | Total packets | Discarded packets |
| A | 0 | 21 | 0 |
| B | 0 | 21 | 0 |
| C | 0 | 21 | 0 |
| D | 0 | 22 | 0 |
| Mode SS | |||
|---|---|---|---|
| Quadrant | BADHDUFLAG | Total packets | Discarded packets |
| A | 0 | 110 | 0 |
| B | 0 | 110 | 0 |
| C | 0 | 110 | 0 |
| D | 0 | 110 | 0 |
| Mode M0 | |||
|---|---|---|---|
| Quadrant | BADHDUFLAG | Total packets | Discarded packets |
| A | 0 | 11050 | 3 |
| B | 0 | 13110 | 2 |
| C | 0 | 16055 | 2 |
| D | 0 | 17645 | 2 |
| Quadrant | Total seconds | Saturated seconds | Saturation percentage |
|---|---|---|---|
| A | 5462 | 6 | 0.109850% |
| B | 5462 | 93 | 1.702673% |
| C | 5462 | 300 | 5.492494% |
| D | 5462 | 339 | 6.206518% |
Noise dominated data is calculated using 1-second bins in cleaned event files. If a bin has >2000 counts, and if more than 50% of those come from <1% of pixels, then it is considered to be noise-dominated and hence unusable.
| Quadrant | # 1 sec bins | Bins with >0 counts | Bins with >2000 counts | High rate bins dominated by noise | Noise dominated (total time) | Noise dominated (detector-on time) | Marked lightcurve |
|---|---|---|---|---|---|---|---|
| A | 7286 | 5463 | 0 | 0 | 0.00% | 0.00% | 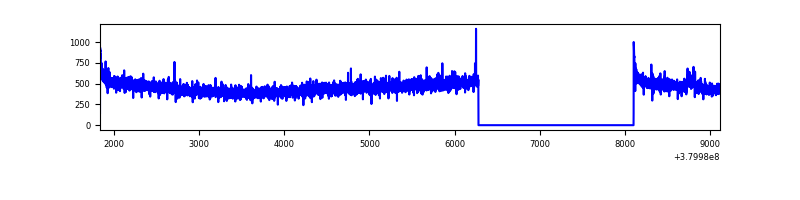 |
| B | 7286 | 5463 | 59 | 59 | 0.81% | 1.08% | 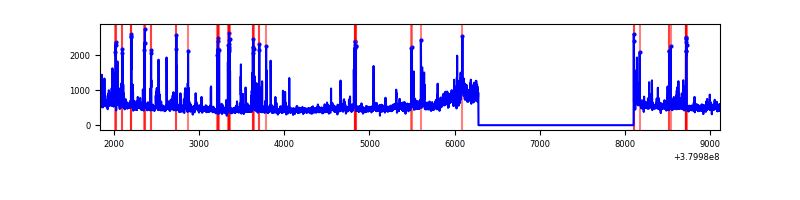 |
| C | 7286 | 5463 | 287 | 287 | 3.94% | 5.25% | 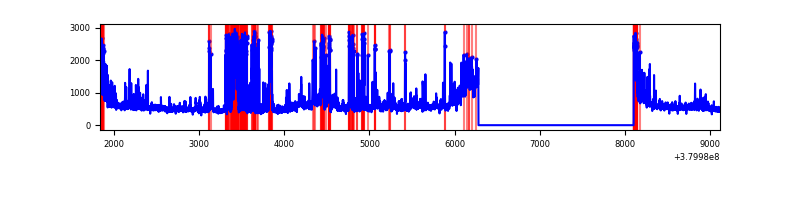 |
| D | 7286 | 5463 | 319 | 319 | 4.38% | 5.84% | 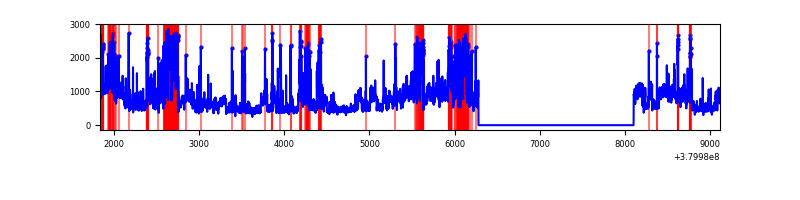 |
Top three noisy pixels from each quadrant. If the there are fewer than three noisy pixels in the level2.evt file, extra rows are filled as -1
| Pixel properties | Quadrant properties | ||||||
|---|---|---|---|---|---|---|---|
| Quadrant | DetID | PixID | Counts | Sigma | Mean | Median | Sigma |
| A | 10 | 83 | 19216 | 147.15 | 632 | 620 | 126.4 |
| A | 15 | 169 | 12359 | 92.89 | 632 | 620 | 126.4 |
| A | 13 | 254 | 9241 | 68.22 | 632 | 620 | 126.4 |
| B | 5 | 172 | 378102 | 3153.13 | 632 | 615 | 119.7 |
| B | 0 | 189 | 144276 | 1199.99 | 632 | 615 | 119.7 |
| B | 0 | 219 | 48205 | 397.52 | 632 | 615 | 119.7 |
| C | 0 | 207 | 772707 | 5603.44 | 604 | 609 | 137.8 |
| C | 0 | 10 | 399648 | 2896.0 | 604 | 609 | 137.8 |
| C | 15 | 214 | 234734 | 1699.14 | 604 | 609 | 137.8 |
| D | 8 | 195 | 1105543 | 7620.86 | 596 | 581 | 145.0 |
| D | 2 | 250 | 475262 | 3273.85 | 596 | 581 | 145.0 |
| D | 10 | 118 | 364411 | 2509.31 | 596 | 581 | 145.0 |
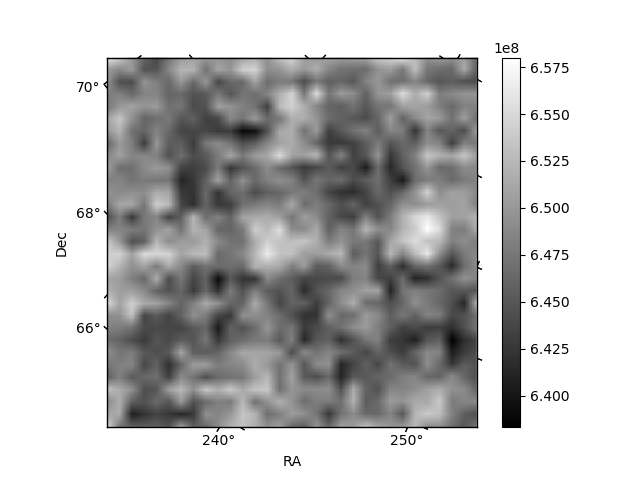
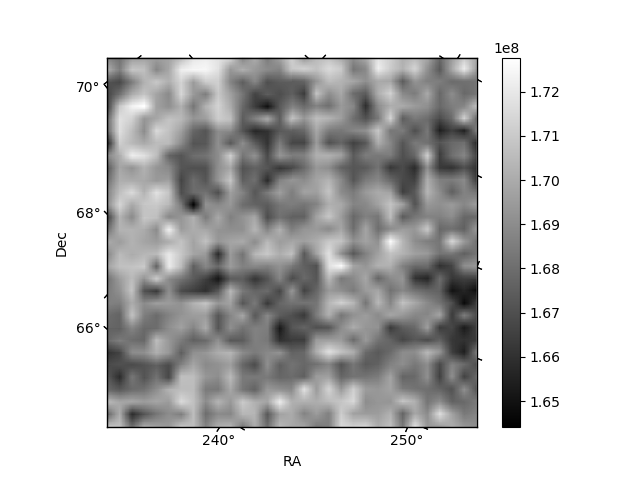
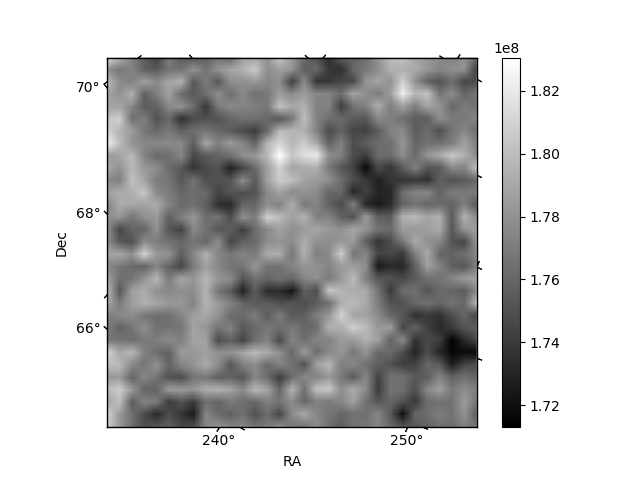
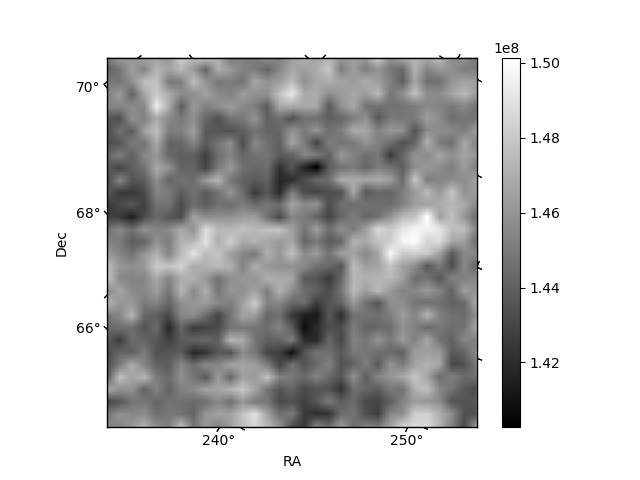
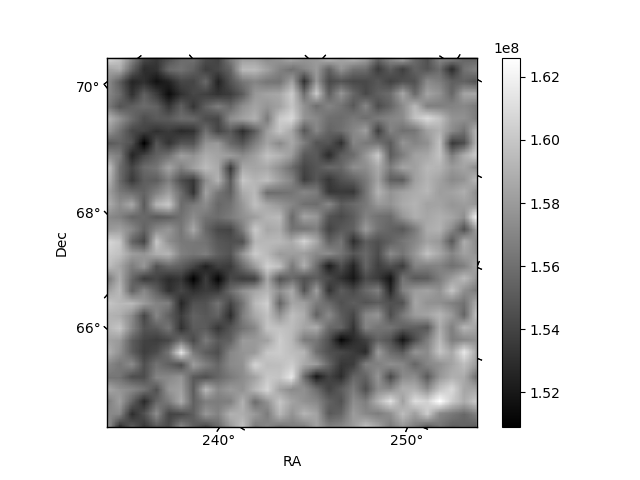
Histogram calculated using DETX and DETY for each event in the final _common_clean file
| Quadrant A | 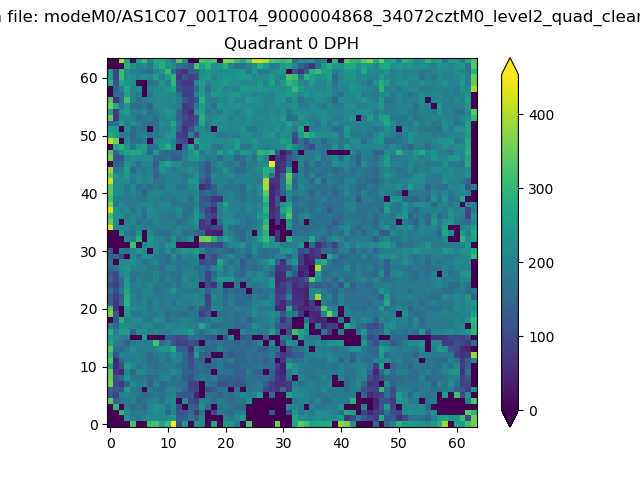 |
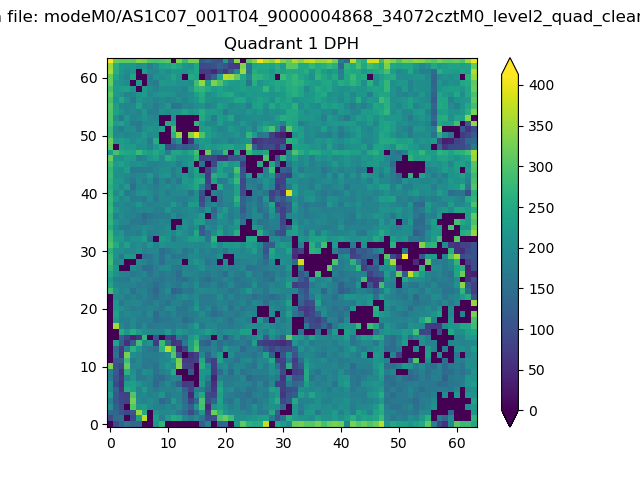 |
Quadrant B |
|---|---|---|---|
| Quadrant D |  |
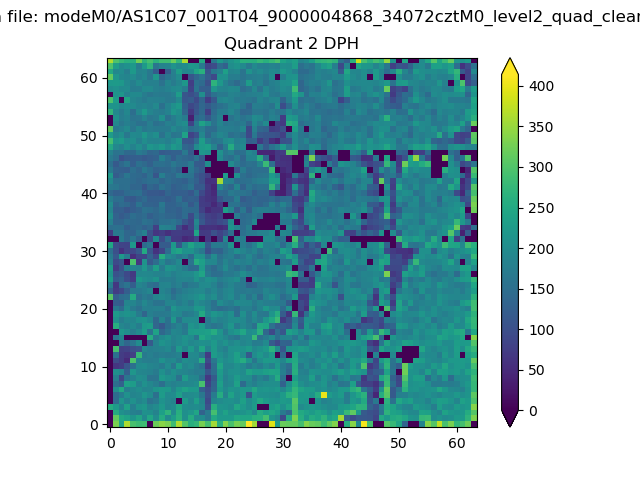 |
Quadrant C |
| Plot type | Count rate plots | Images |
|---|---|---|
| Comparison with Poisson distribution Blue bars denote a histogram of data divided into 1 sec bins. Red curve is a Poisson curve with rate = median count rate of data. |
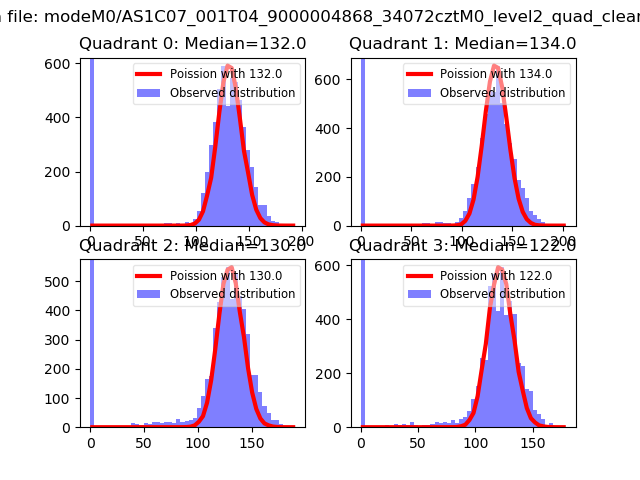 |
 |
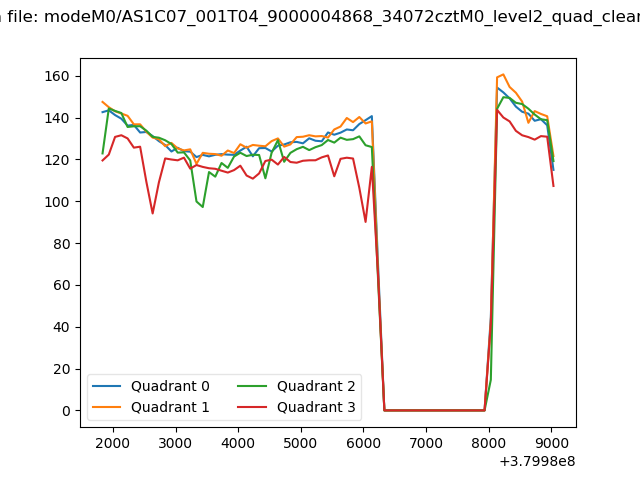
| Quadrant-wise count rates Data is divided into 100 sec bins |
 |
|
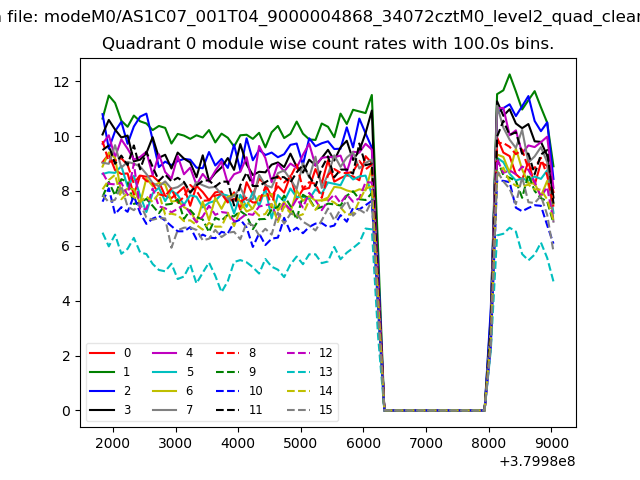
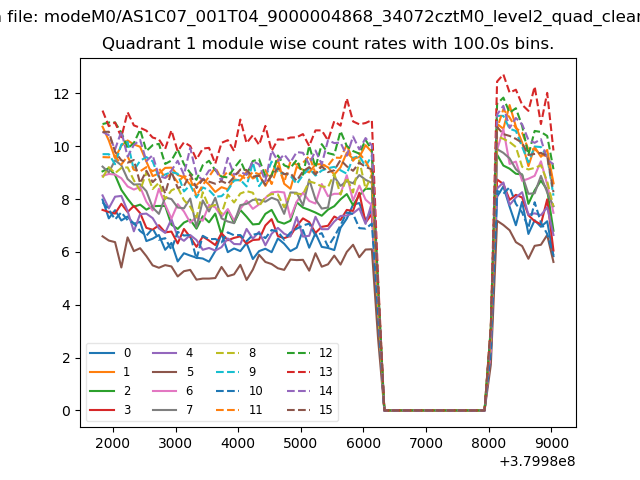
| Module-wise count rates for Quadrant A Data is divided into 100 sec bins |
 |
 |
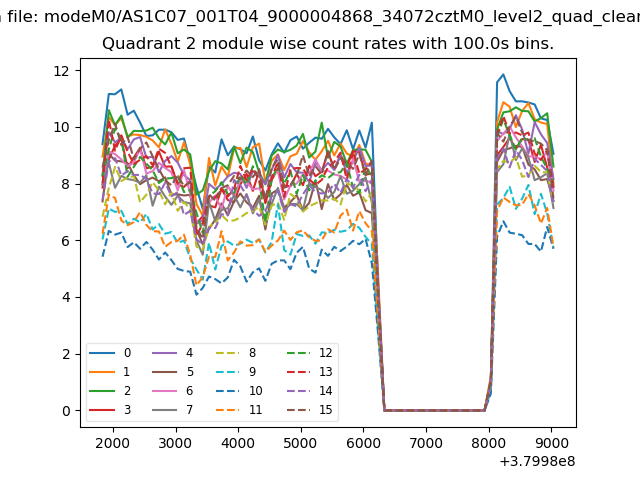
| Module-wise count rates for Quadrant B Data is divided into 100 sec bins |
 |
 |
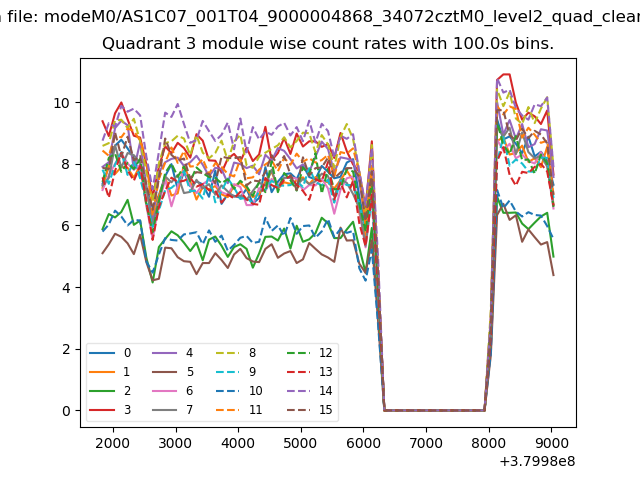
| Module-wise count rates for Quadrant C Data is divided into 100 sec bins |
 |
 |
| Module-wise count rates for Quadrant D Data is divided into 100 sec bins |
 |
 |
| Parameter | Plot |
|---|---|
| CZT HV Monitor | 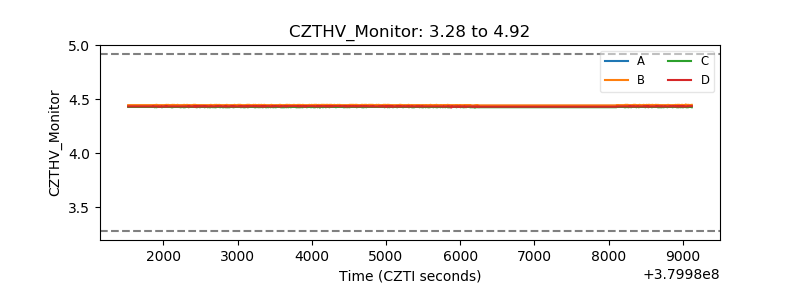 |
| D_VDD | 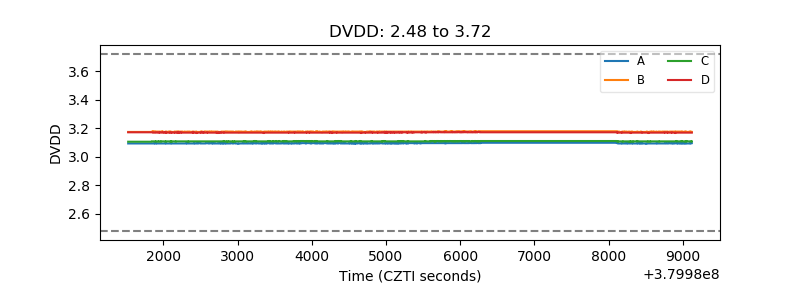 |
| Temperature 1 | 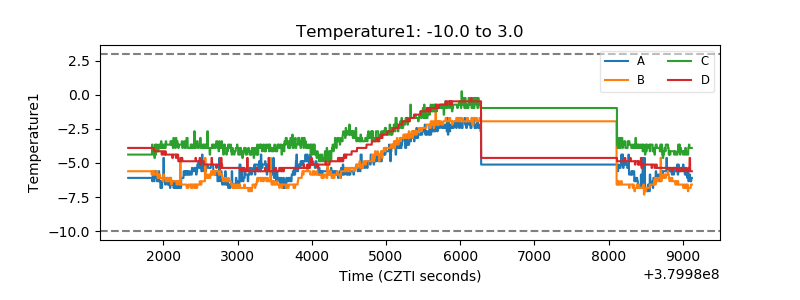 |
| Veto HV Monitor | 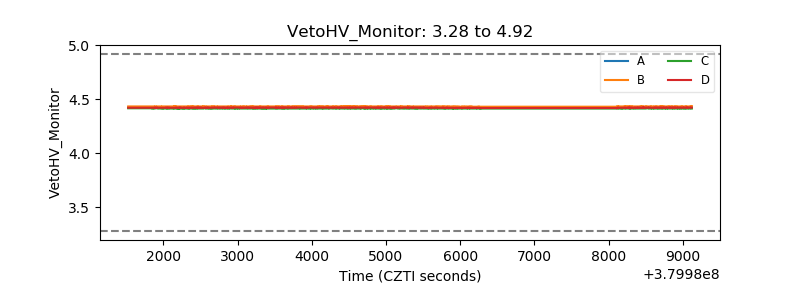 |
| Veto LLD | 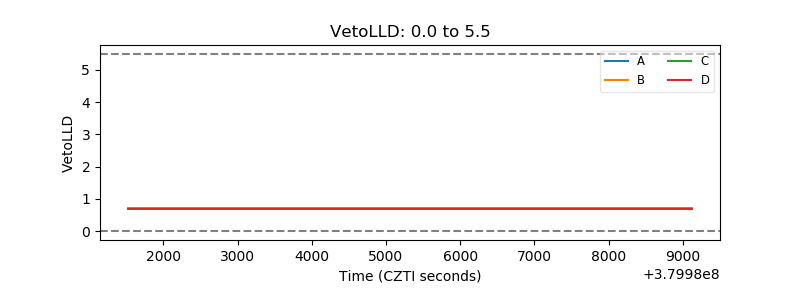 |
| Alpha Counter | 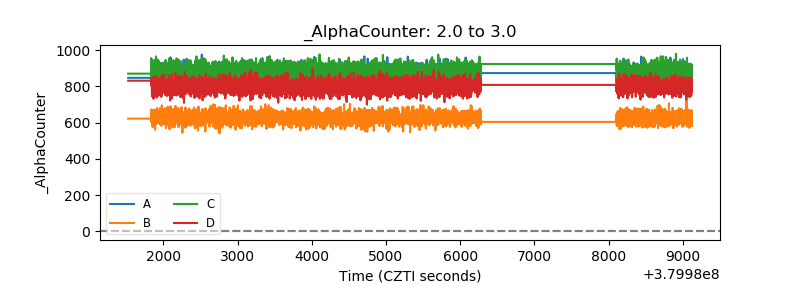 |
| _CPM_Rate | 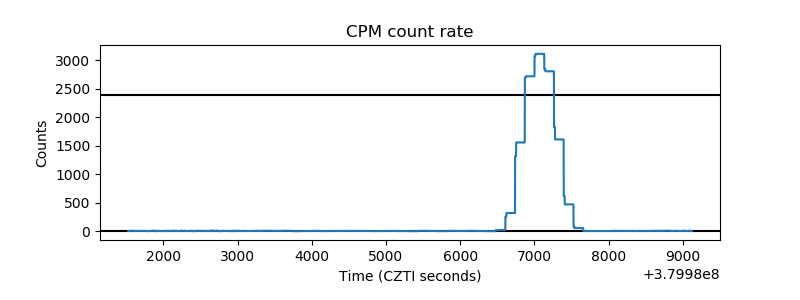 |
| CZT Counter | 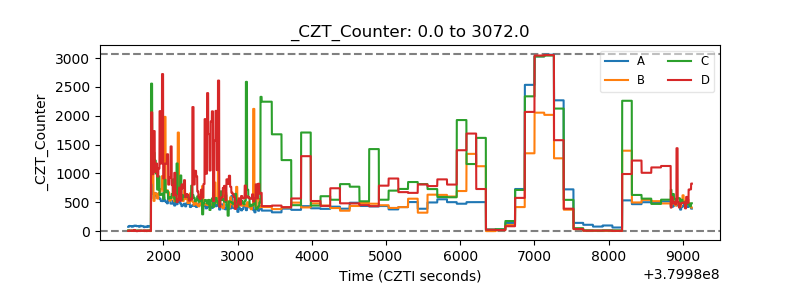 |
| +2.5 Volts monitor |  |
| +5 Volts monitor | 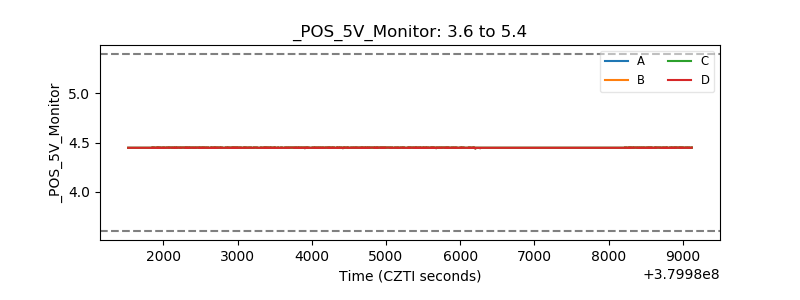 |
| _ROLL_ROT | 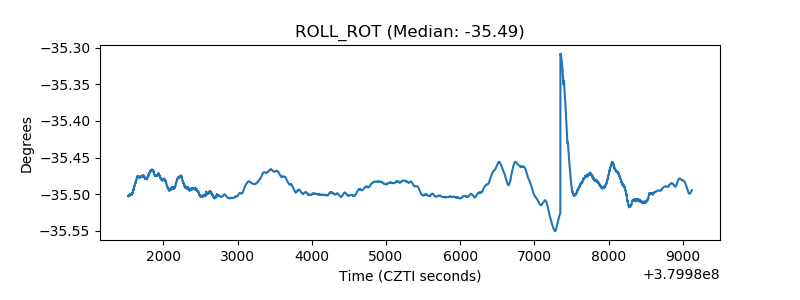 |
| _Roll_DEC | 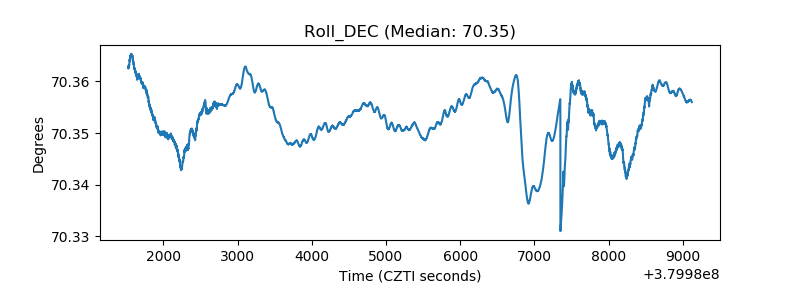 |
| _Roll_RA | 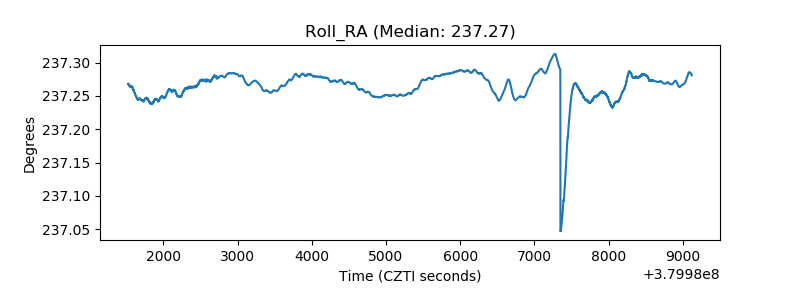 |
| Veto Counter | 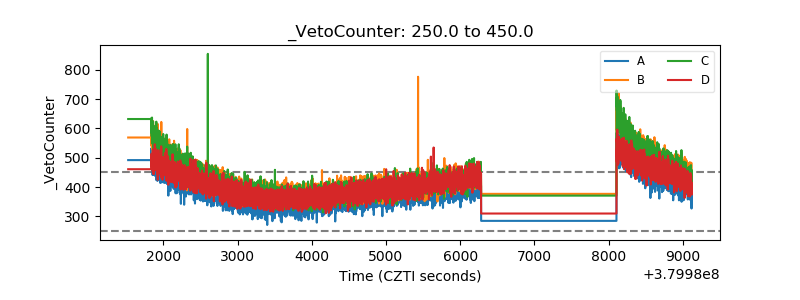 |