| Param | Original file | Final file |
|---|---|---|
| Filename | modeM0/AS1C07_001T04_9000004868_34075cztM0_level2.evt | modeM0/AS1C07_001T04_9000004868_34075cztM0_level2_quad_clean.evt |
| Size (bytes) | 359,547,840 | 66,116,160 |
| Size | 342.9 MB | 63.1 MB |
| Events in quadrant A | 1,800,047 | 469,625 |
| Events in quadrant B | 3,179,532 | 436,654 |
| Events in quadrant C | 2,817,517 | 429,314 |
| Events in quadrant D | 2,835,801 | 400,405 |
| Mode M9 | |||
|---|---|---|---|
| Quadrant | BADHDUFLAG | Total packets | Discarded packets |
| A | 0 | 21 | 2 |
| B | 0 | 22 | 4 |
| C | 0 | 21 | 4 |
| D | 0 | 22 | 6 |
| Mode SS | |||
|---|---|---|---|
| Quadrant | BADHDUFLAG | Total packets | Discarded packets |
| A | 0 | 131 | 48 |
| B | 0 | 132 | 50 |
| C | 0 | 132 | 58 |
| D | 0 | 133 | 49 |
| Mode M0 | |||
|---|---|---|---|
| Quadrant | BADHDUFLAG | Total packets | Discarded packets |
| A | 0 | 13045 | 5201 |
| B | 0 | 23406 | 11426 |
| C | 0 | 19681 | 8921 |
| D | 0 | 20434 | 9382 |
| Quadrant | Total seconds | Saturated seconds | Saturation percentage |
|---|---|---|---|
| A | 3898 | 2 | 0.051308% |
| B | 3660 | 183 | 5.000000% |
| C | 3731 | 185 | 4.958456% |
| D | 3701 | 84 | 2.269657% |
Noise dominated data is calculated using 1-second bins in cleaned event files. If a bin has >2000 counts, and if more than 50% of those come from <1% of pixels, then it is considered to be noise-dominated and hence unusable.
| Quadrant | # 1 sec bins | Bins with >0 counts | Bins with >2000 counts | High rate bins dominated by noise | Noise dominated (total time) | Noise dominated (detector-on time) | Marked lightcurve |
|---|---|---|---|---|---|---|---|
| A | 8517 | 4160 | 0 | 0 | 0.00% | 0.00% | 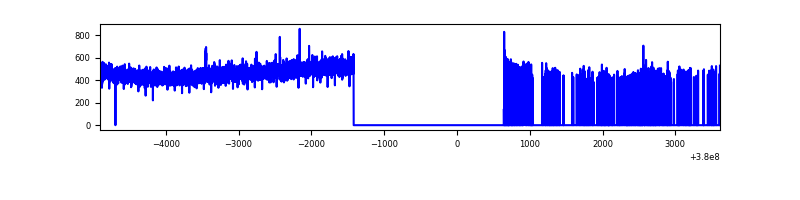 |
| B | 8088 | 3804 | 123 | 123 | 1.52% | 3.23% | 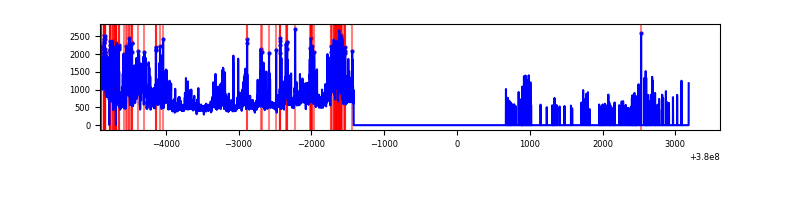 |
| C | 8413 | 3909 | 166 | 166 | 1.97% | 4.25% | 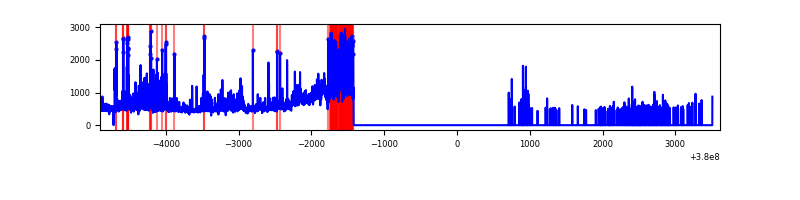 |
| D | 8390 | 3863 | 57 | 57 | 0.68% | 1.48% | 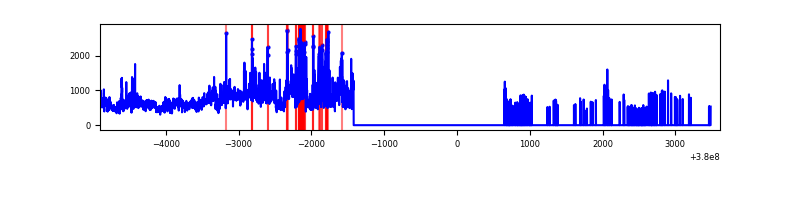 |
Top three noisy pixels from each quadrant. If the there are fewer than three noisy pixels in the level2.evt file, extra rows are filled as -1
| Pixel properties | Quadrant properties | ||||||
|---|---|---|---|---|---|---|---|
| Quadrant | DetID | PixID | Counts | Sigma | Mean | Median | Sigma |
| A | 13 | 254 | 7703 | 76.91 | 463 | 455 | 94.2 |
| A | 13 | 6 | 5384 | 52.3 | 463 | 455 | 94.2 |
| A | 3 | 137 | 4407 | 41.93 | 463 | 455 | 94.2 |
| B | 5 | 31 | 876242 | 10783.08 | 427 | 416 | 81.2 |
| B | 5 | 15 | 207310 | 2547.26 | 427 | 416 | 81.2 |
| B | 5 | 172 | 178848 | 2196.84 | 427 | 416 | 81.2 |
| C | 0 | 10 | 404835 | 4332.45 | 409 | 412 | 93.3 |
| C | 0 | 207 | 372713 | 3988.34 | 409 | 412 | 93.3 |
| C | 3 | 233 | 270282 | 2891.03 | 409 | 412 | 93.3 |
| D | 8 | 195 | 776378 | 7590.6 | 415 | 402 | 102.2 |
| D | 13 | 249 | 160427 | 1565.36 | 415 | 402 | 102.2 |
| D | 2 | 250 | 132036 | 1287.64 | 415 | 402 | 102.2 |
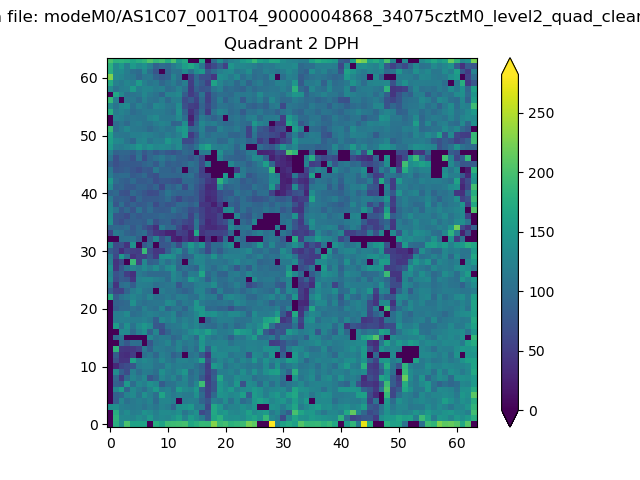
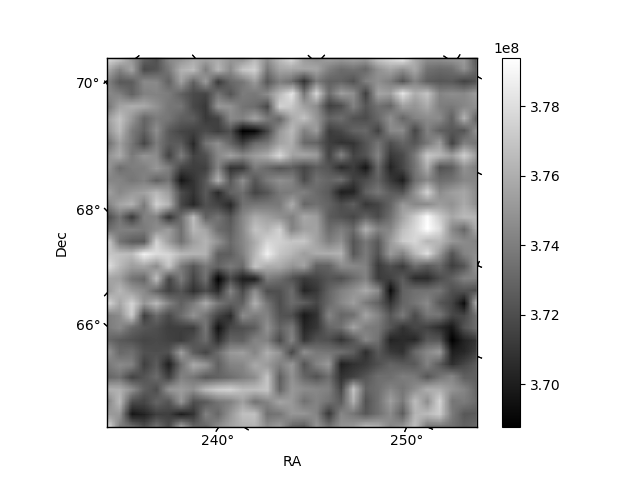
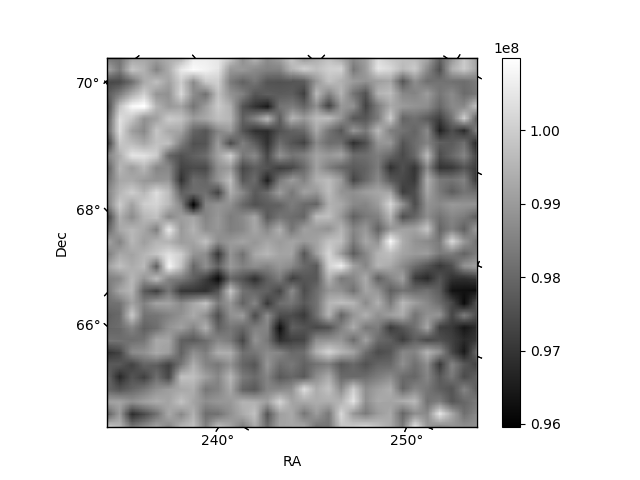
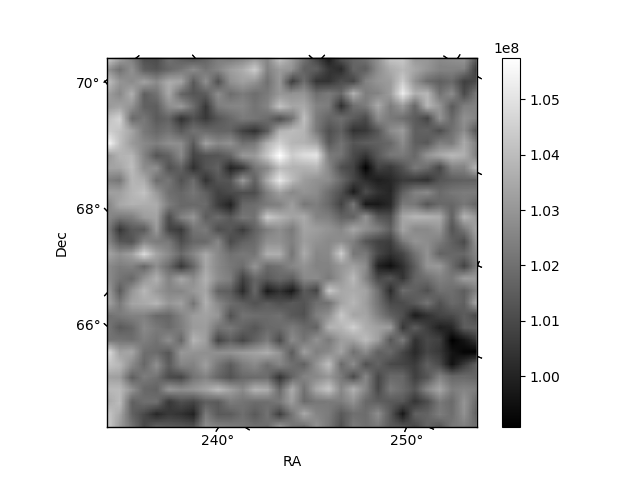
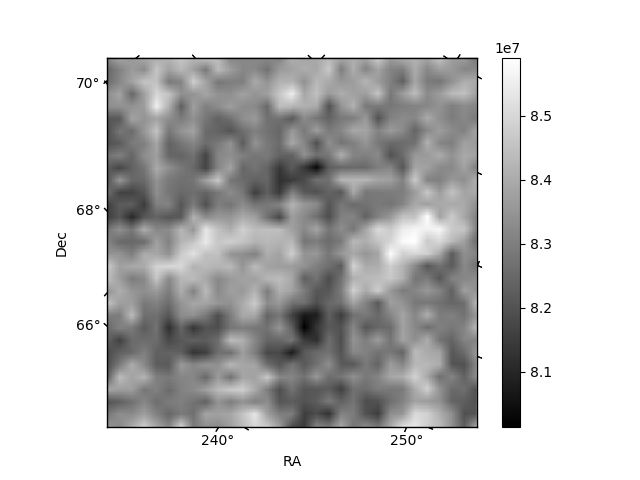
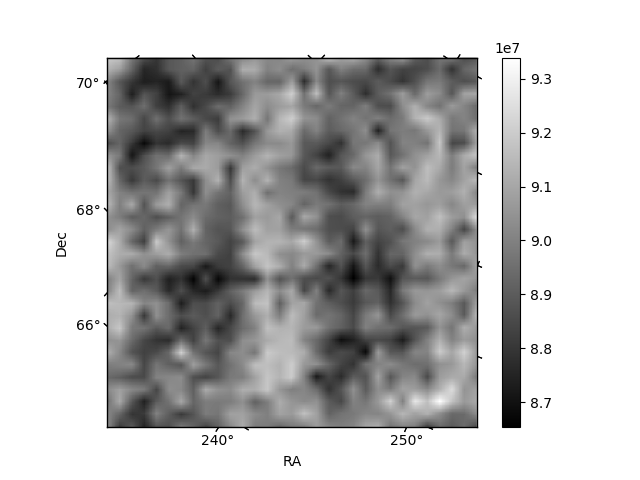
Histogram calculated using DETX and DETY for each event in the final _common_clean file
| Quadrant A | 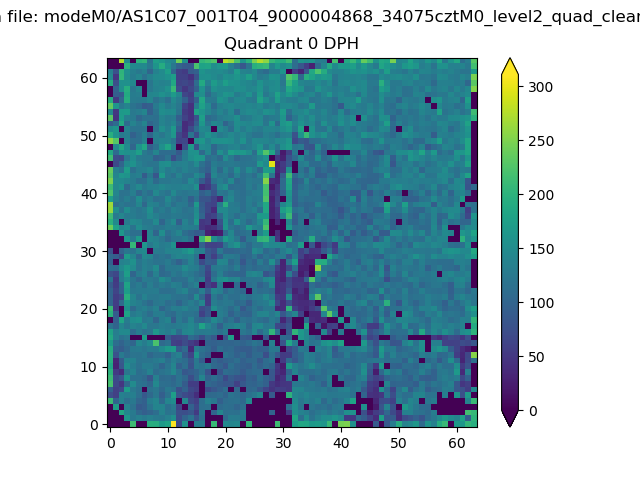 |
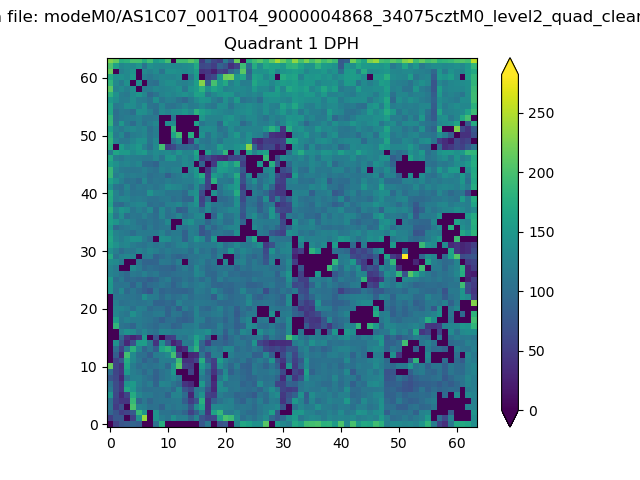 |
Quadrant B |
|---|---|---|---|
| Quadrant D | 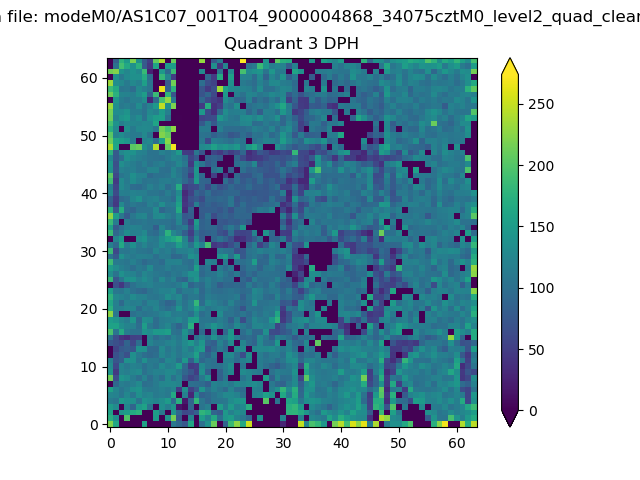 |
 |
Quadrant C |
| Plot type | Count rate plots | Images |
|---|---|---|
| Comparison with Poisson distribution Blue bars denote a histogram of data divided into 1 sec bins. Red curve is a Poisson curve with rate = median count rate of data. |
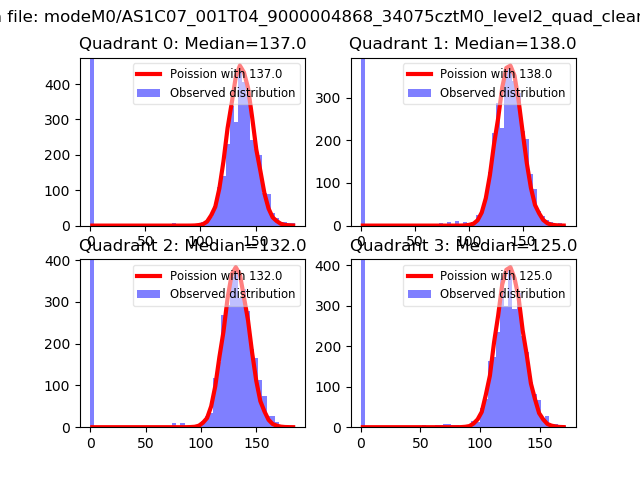 |
 |
| Quadrant-wise count rates Data is divided into 100 sec bins |
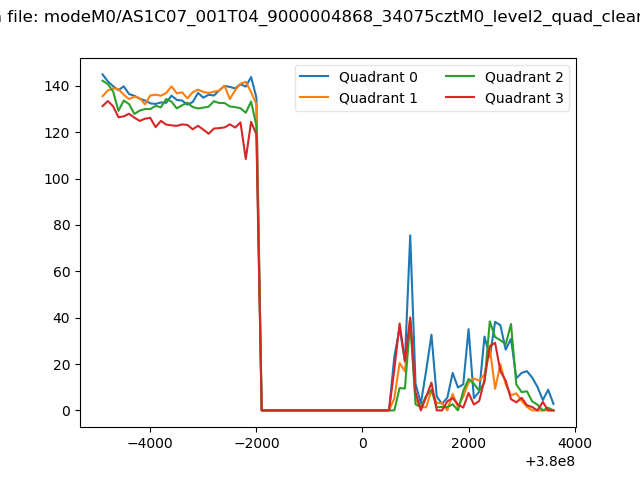 |
|
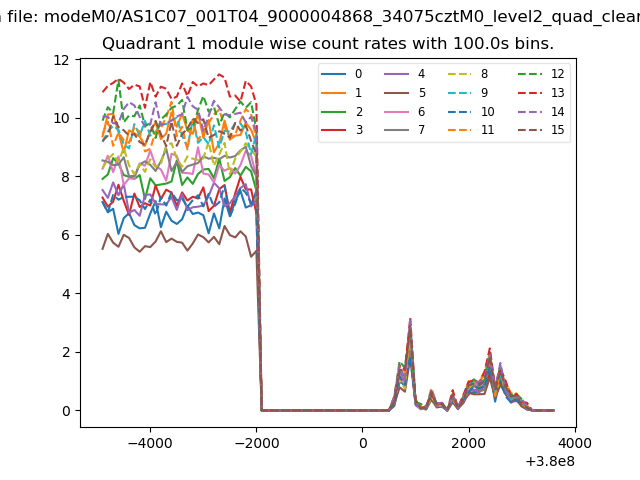
| Module-wise count rates for Quadrant A Data is divided into 100 sec bins |
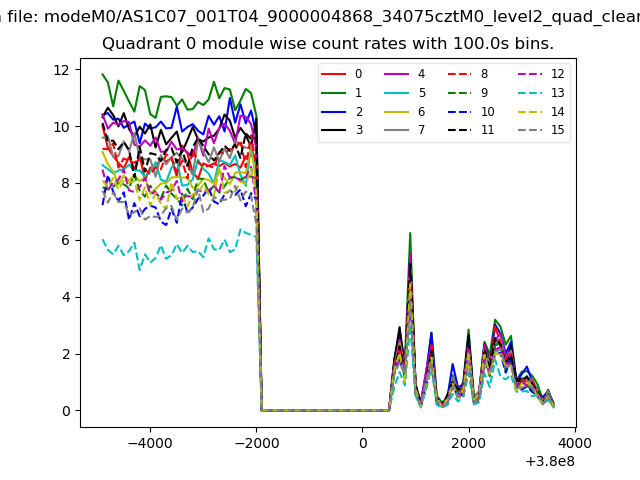 |
 |
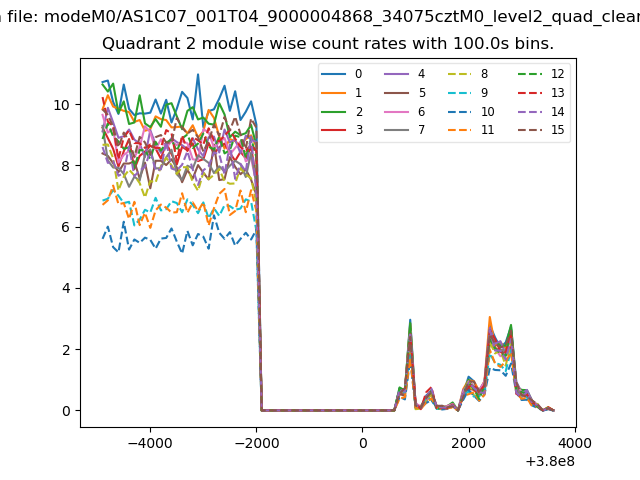
| Module-wise count rates for Quadrant B Data is divided into 100 sec bins |
 |
 |
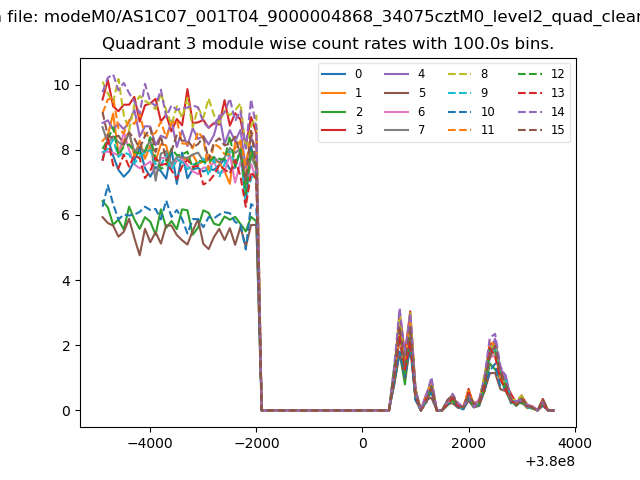
| Module-wise count rates for Quadrant C Data is divided into 100 sec bins |
 |
 |
| Module-wise count rates for Quadrant D Data is divided into 100 sec bins |
 |
 |
| Parameter | Plot |
|---|---|
| CZT HV Monitor | 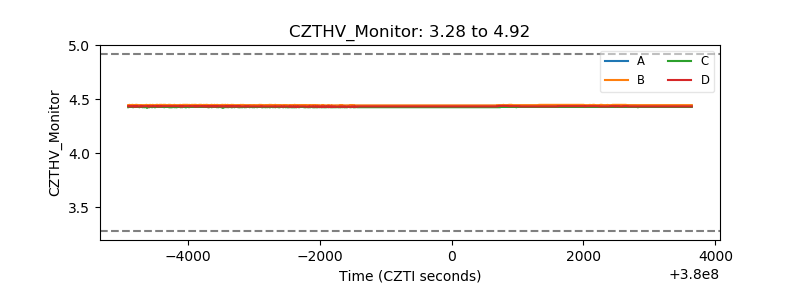 |
| D_VDD | 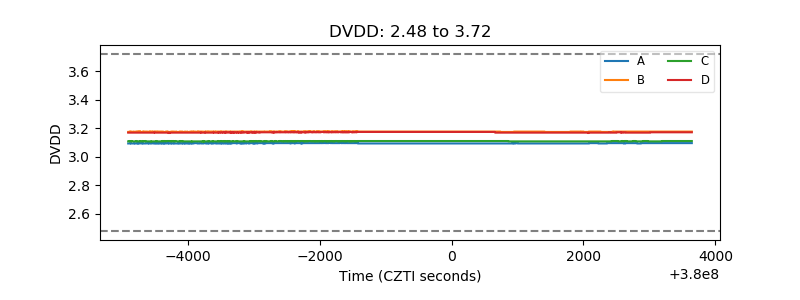 |
| Temperature 1 | 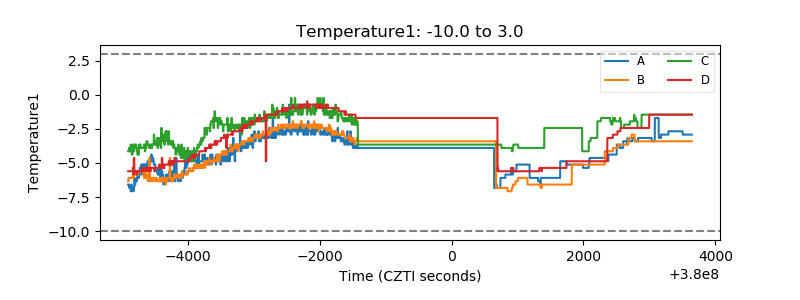 |
| Veto HV Monitor | 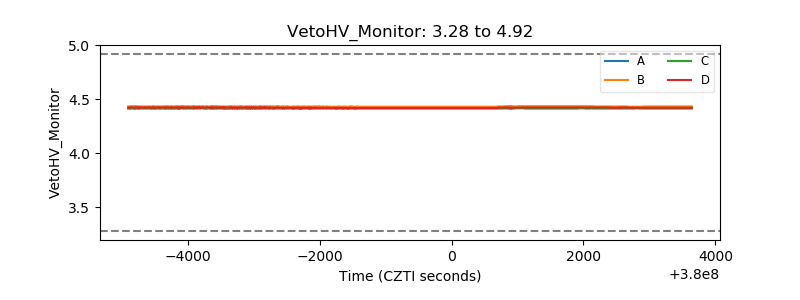 |
| Veto LLD | 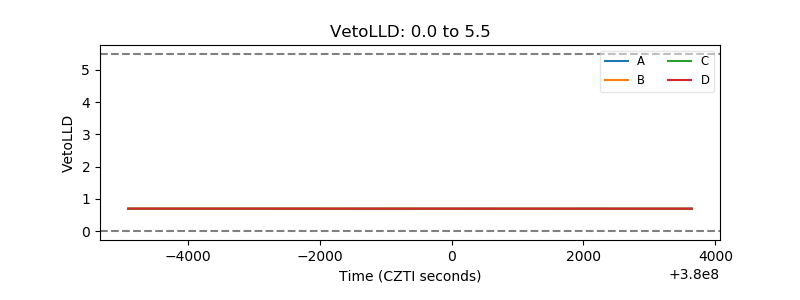 |
| Alpha Counter | 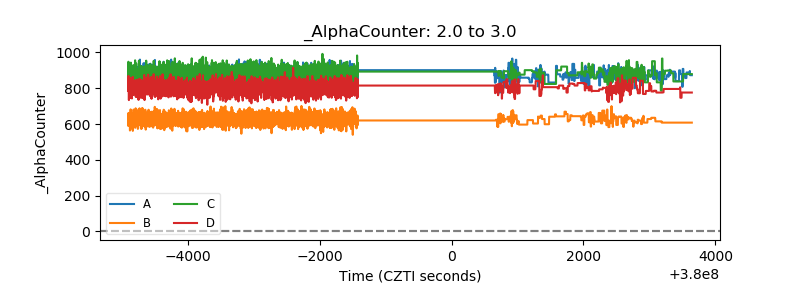 |
| _CPM_Rate | 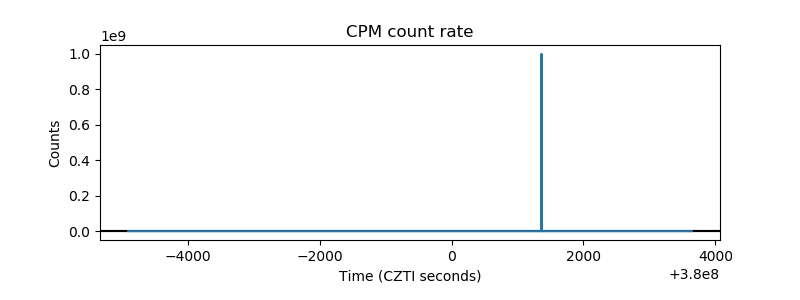 |
| CZT Counter | 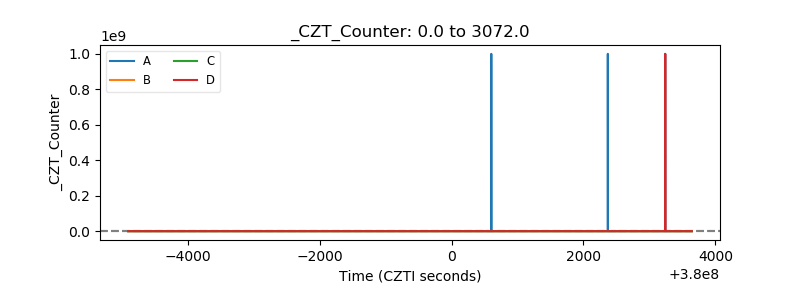 |
| +2.5 Volts monitor | 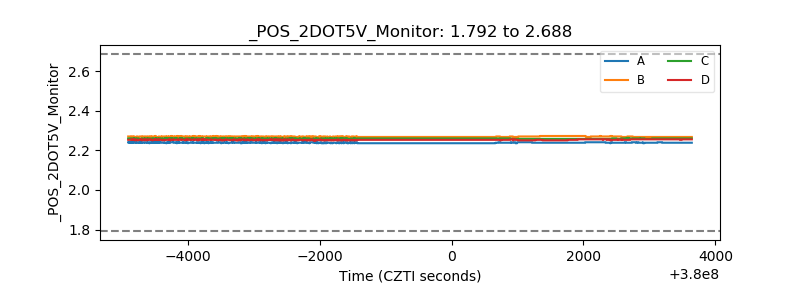 |
| +5 Volts monitor |  |
| _ROLL_ROT | 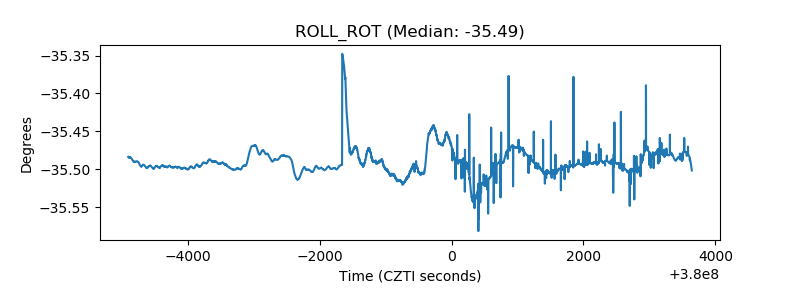 |
| _Roll_DEC | 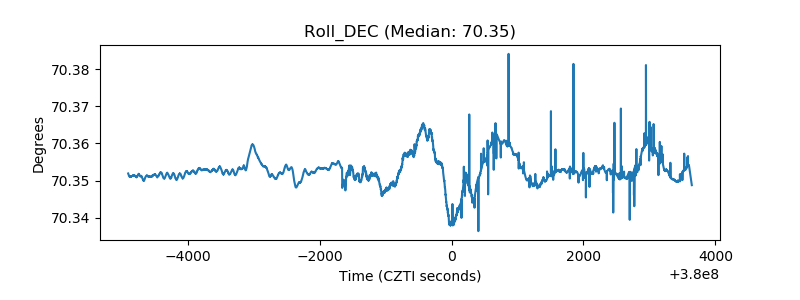 |
| _Roll_RA | 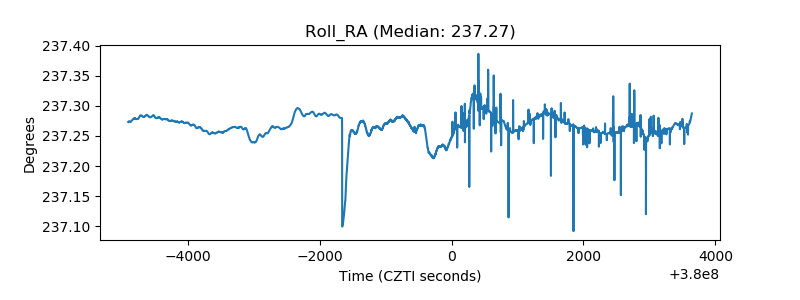 |
| Veto Counter | 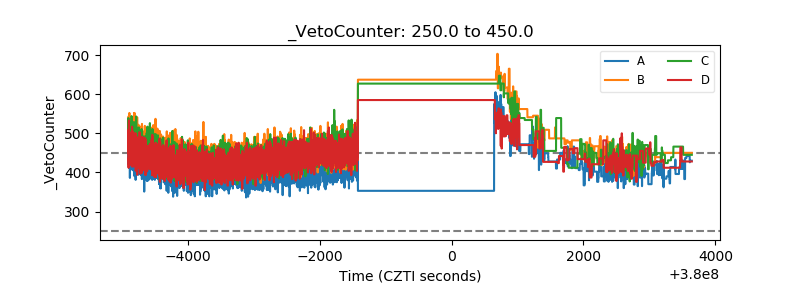 |