| Param | Original file | Final file |
|---|---|---|
| Filename | modeM0/AS1C07_001T04_9000004868_34077cztM0_level2.evt | modeM0/AS1C07_001T04_9000004868_34077cztM0_level2_quad_clean.evt |
| Size (bytes) | 1,765,681,920 | 265,098,240 |
| Size | 1.6 GB | 252.8 MB |
| Events in quadrant A | 7,868,564 | 1,814,074 |
| Events in quadrant B | 18,005,345 | 1,724,814 |
| Events in quadrant C | 11,717,729 | 1,720,367 |
| Events in quadrant D | 14,747,305 | 1,604,632 |
| Mode M9 | |||
|---|---|---|---|
| Quadrant | BADHDUFLAG | Total packets | Discarded packets |
| A | 0 | 84 | 0 |
| B | 0 | 84 | 0 |
| C | 0 | 84 | 0 |
| D | 0 | 84 | 0 |
| Mode SS | |||
|---|---|---|---|
| Quadrant | BADHDUFLAG | Total packets | Discarded packets |
| A | 0 | 346 | 0 |
| B | 0 | 346 | 0 |
| C | 0 | 346 | 0 |
| D | 0 | 346 | 0 |
| Mode M0 | |||
|---|---|---|---|
| Quadrant | BADHDUFLAG | Total packets | Discarded packets |
| A | 0 | 34010 | 5 |
| B | 0 | 64989 | 4 |
| C | 0 | 45276 | 4 |
| D | 0 | 55624 | 4 |
| Quadrant | Total seconds | Saturated seconds | Saturation percentage |
|---|---|---|---|
| A | 16890 | 19 | 0.112493% |
| B | 16890 | 2643 | 15.648313% |
| C | 16890 | 552 | 3.268206% |
| D | 16890 | 960 | 5.683837% |
Noise dominated data is calculated using 1-second bins in cleaned event files. If a bin has >2000 counts, and if more than 50% of those come from <1% of pixels, then it is considered to be noise-dominated and hence unusable.
| Quadrant | # 1 sec bins | Bins with >0 counts | Bins with >2000 counts | High rate bins dominated by noise | Noise dominated (total time) | Noise dominated (detector-on time) | Marked lightcurve |
|---|---|---|---|---|---|---|---|
| A | 25263 | 16893 | 0 | 0 | 0.00% | 0.00% | 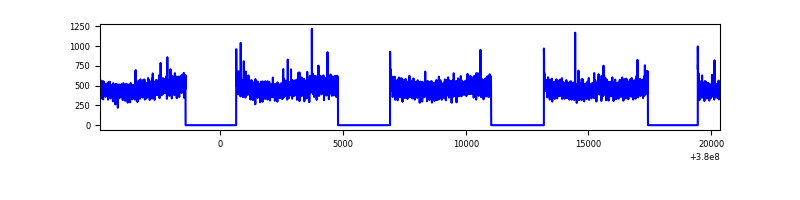 |
| B | 25262 | 16893 | 2326 | 2326 | 9.21% | 13.77% | 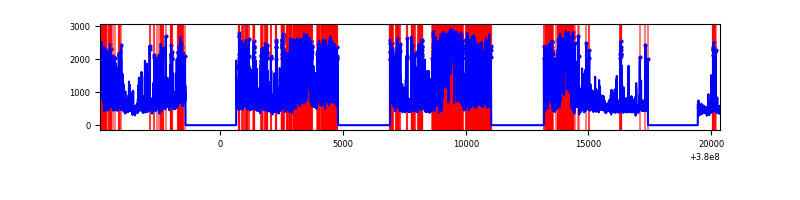 |
| C | 25262 | 16893 | 554 | 554 | 2.19% | 3.28% | 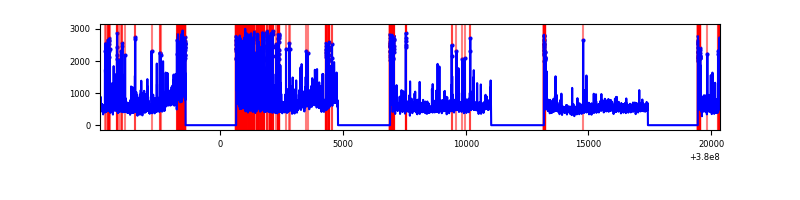 |
| D | 25263 | 16894 | 874 | 874 | 3.46% | 5.17% | 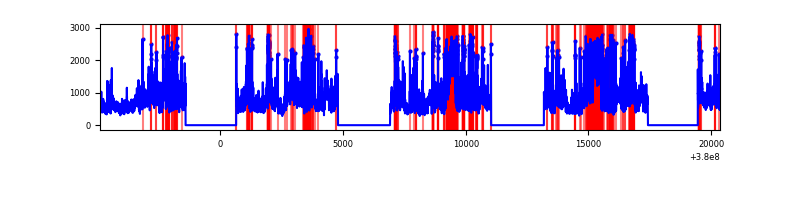 |
Top three noisy pixels from each quadrant. If the there are fewer than three noisy pixels in the level2.evt file, extra rows are filled as -1
| Pixel properties | Quadrant properties | ||||||
|---|---|---|---|---|---|---|---|
| Quadrant | DetID | PixID | Counts | Sigma | Mean | Median | Sigma |
| A | 10 | 83 | 42028 | 100.53 | 2019 | 1985 | 398.3 |
| A | 13 | 254 | 31195 | 73.33 | 2019 | 1985 | 398.3 |
| A | 13 | 6 | 27660 | 64.46 | 2019 | 1985 | 398.3 |
| B | 5 | 31 | 6376427 | 18086.63 | 1904 | 1857 | 352.4 |
| B | 5 | 15 | 1672516 | 4740.18 | 1904 | 1857 | 352.4 |
| B | 5 | 172 | 1217086 | 3447.98 | 1904 | 1857 | 352.4 |
| C | 0 | 10 | 1514385 | 3576.79 | 1885 | 1899 | 422.9 |
| C | 0 | 207 | 1188623 | 2806.41 | 1885 | 1899 | 422.9 |
| C | 3 | 233 | 871022 | 2055.34 | 1885 | 1899 | 422.9 |
| D | 8 | 195 | 3535656 | 7843.68 | 1889 | 1845 | 450.5 |
| D | 10 | 118 | 1612221 | 3574.41 | 1889 | 1845 | 450.5 |
| D | 13 | 249 | 750186 | 1661.03 | 1889 | 1845 | 450.5 |
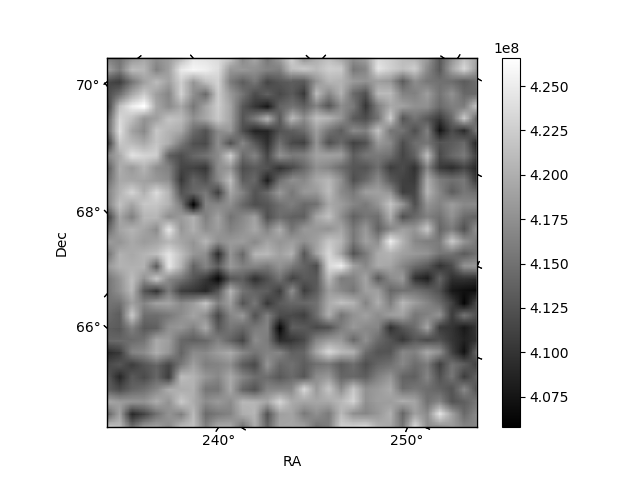
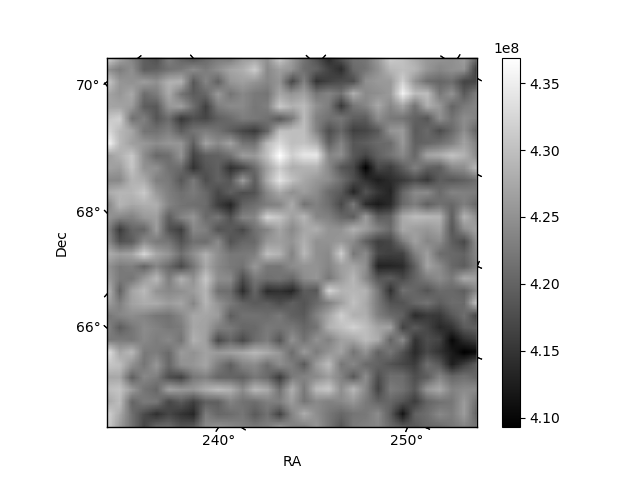
Histogram calculated using DETX and DETY for each event in the final _common_clean file
| Quadrant A | 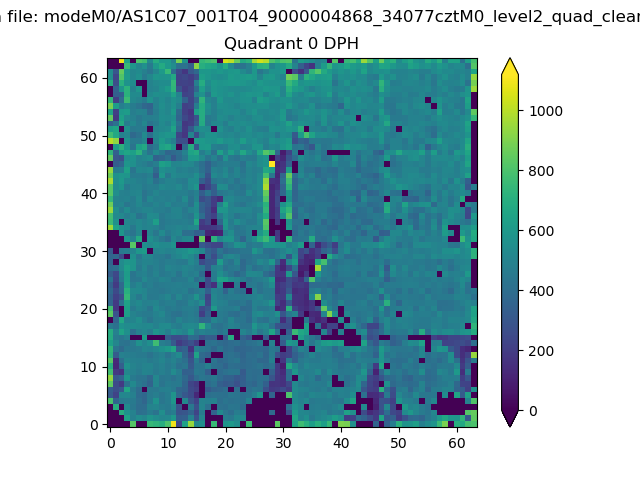 |
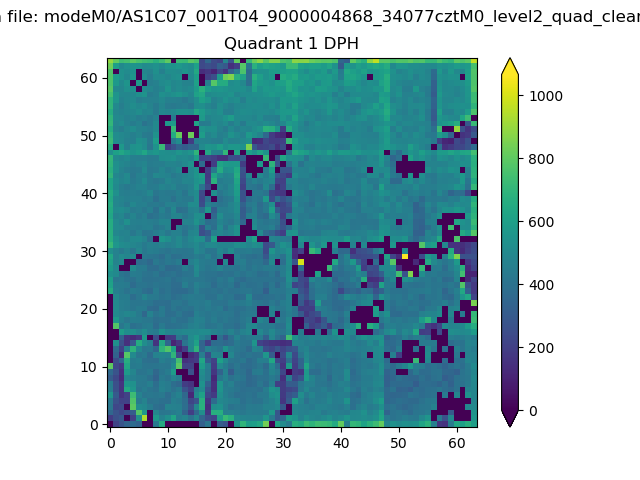 |
Quadrant B |
|---|---|---|---|
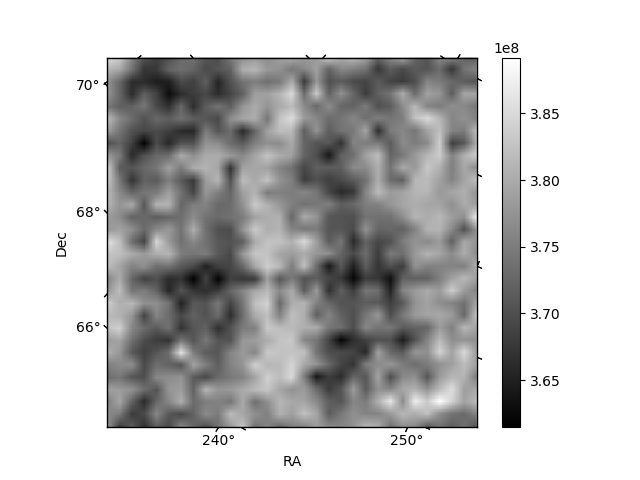
| Quadrant D |  |
 |
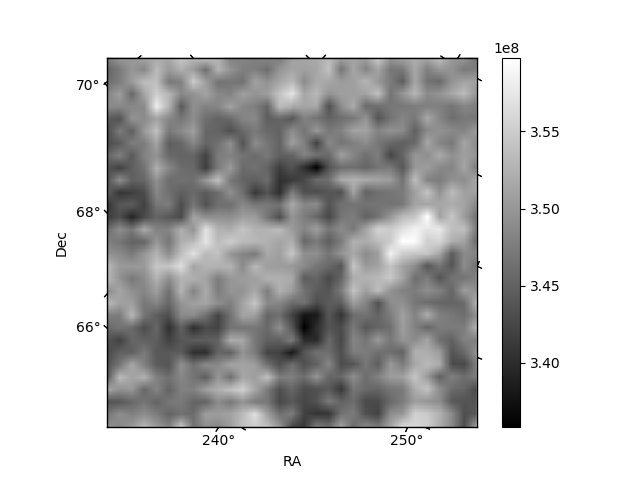
Quadrant C |
| Plot type | Count rate plots | Images |
|---|---|---|
| Comparison with Poisson distribution Blue bars denote a histogram of data divided into 1 sec bins. Red curve is a Poisson curve with rate = median count rate of data. |
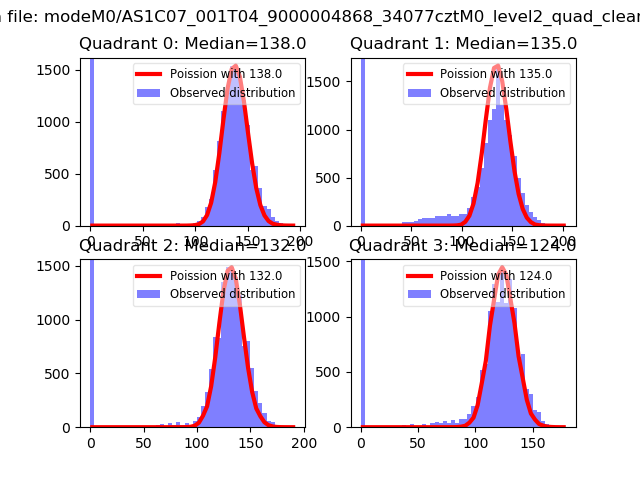 |
 |
| Quadrant-wise count rates Data is divided into 100 sec bins |
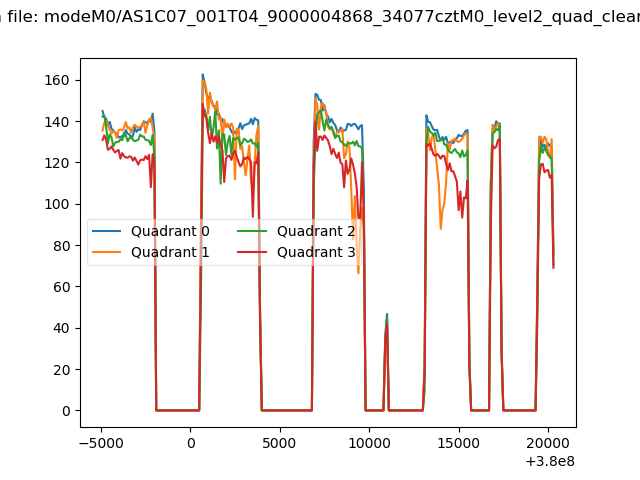 |
|
| Module-wise count rates for Quadrant A Data is divided into 100 sec bins |
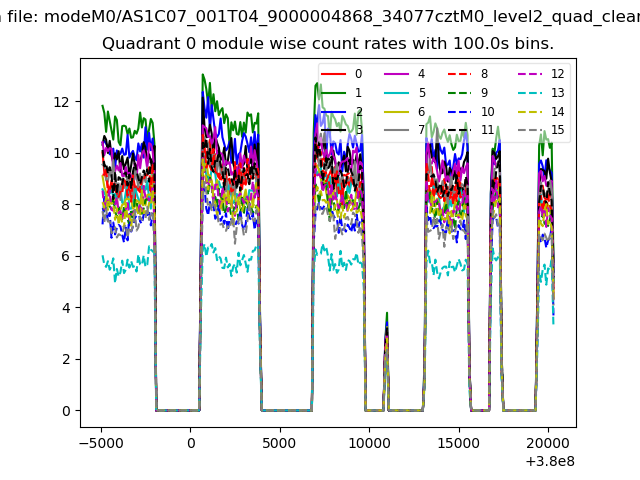 |
 |
| Module-wise count rates for Quadrant B Data is divided into 100 sec bins |
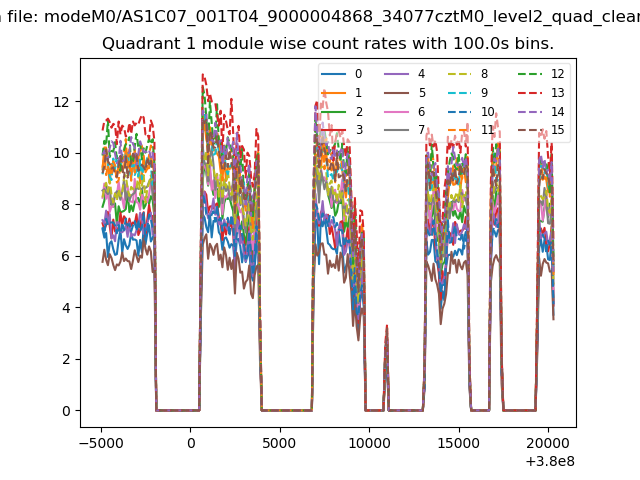 |
 |
| Module-wise count rates for Quadrant C Data is divided into 100 sec bins |
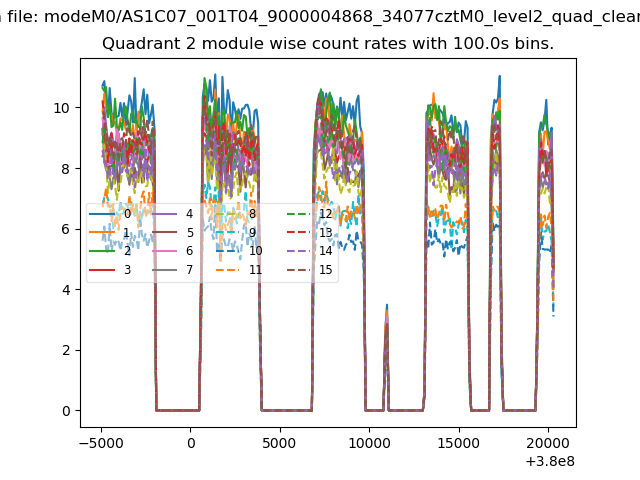 |
 |
| Module-wise count rates for Quadrant D Data is divided into 100 sec bins |
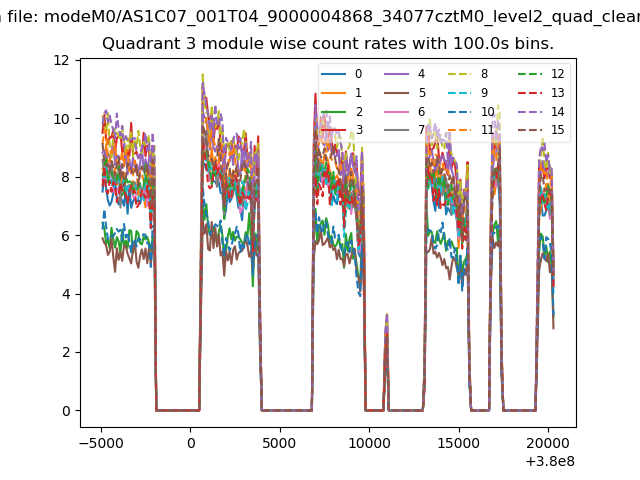 |
 |
| Parameter | Plot |
|---|---|
| CZT HV Monitor | 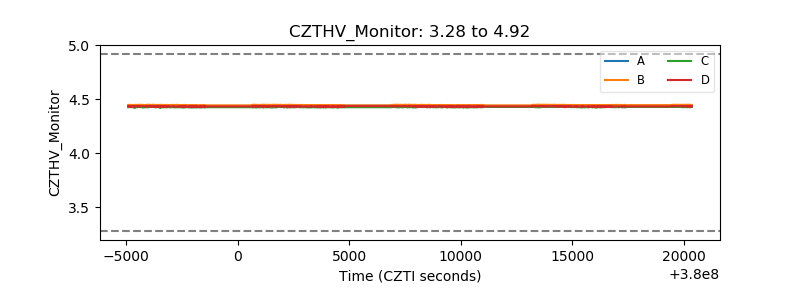 |
| D_VDD | 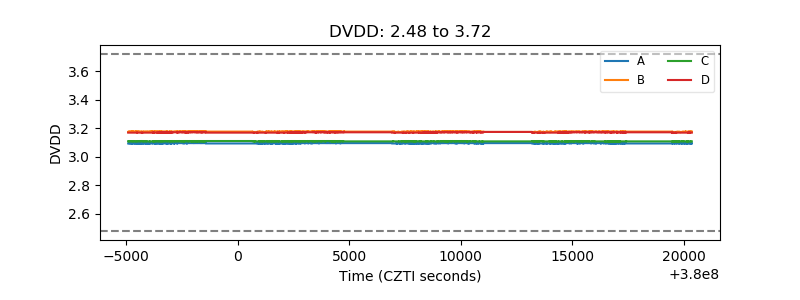 |
| Temperature 1 | 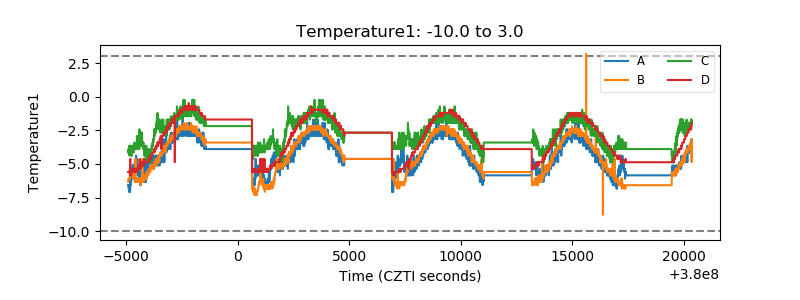 |
| Veto HV Monitor | 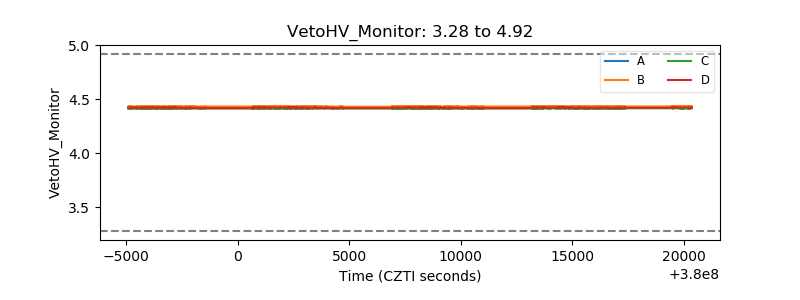 |
| Veto LLD | 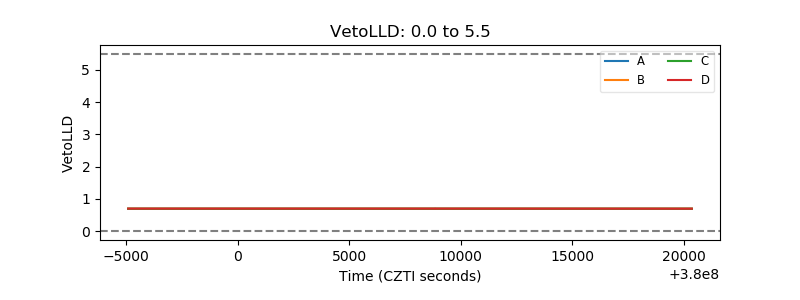 |
| Alpha Counter | 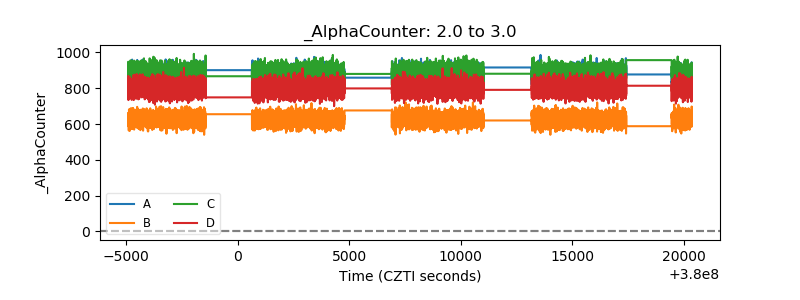 |
| _CPM_Rate | 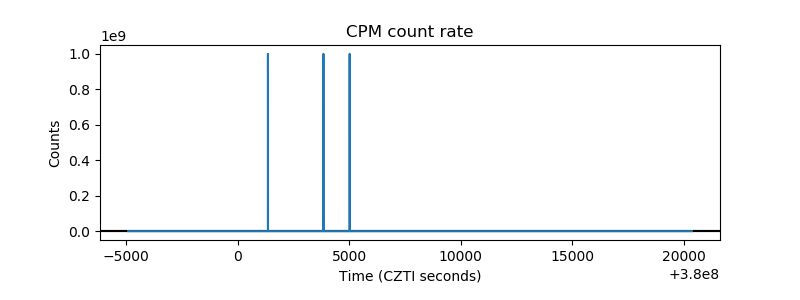 |
| CZT Counter |  |
| +2.5 Volts monitor | 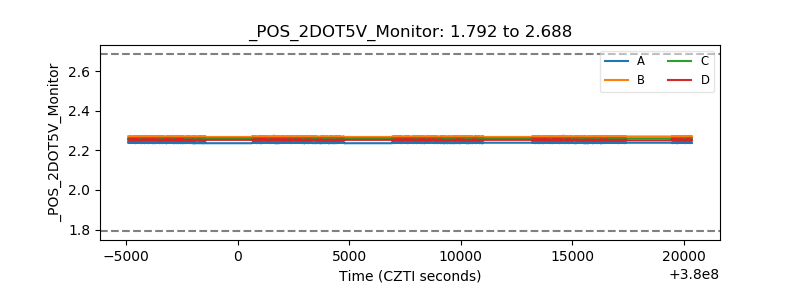 |
| +5 Volts monitor |  |
| _ROLL_ROT | 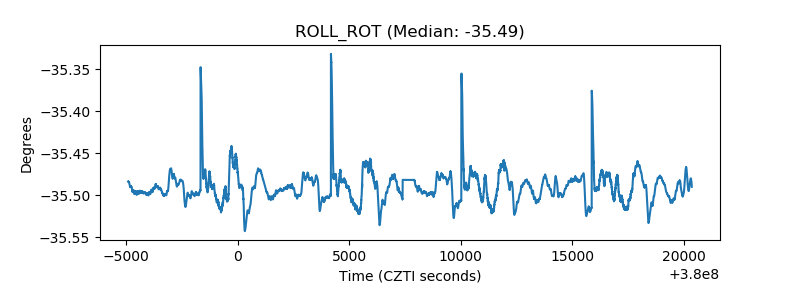 |
| _Roll_DEC | 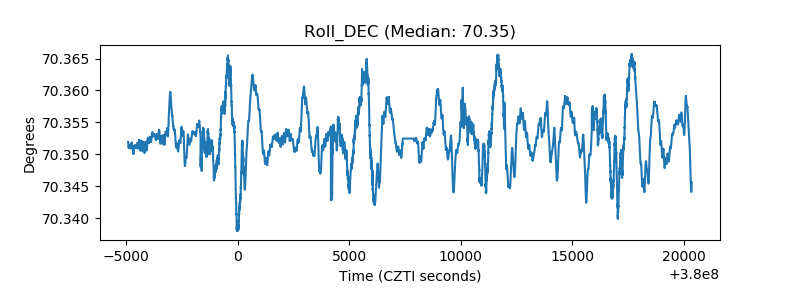 |
| _Roll_RA |  |
| Veto Counter | 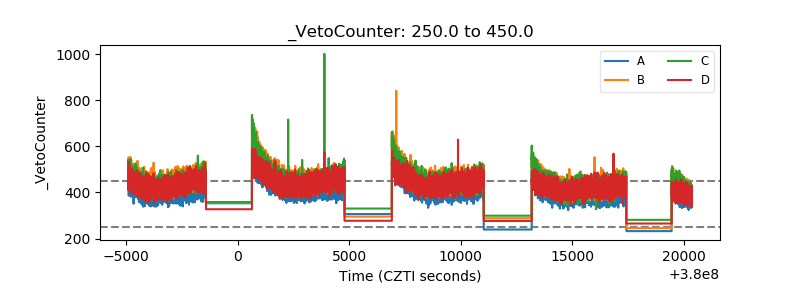 |