| Param | Original file | Final file |
|---|---|---|
| Filename | modeM0/AS1C07_001T04_9000004868_34078cztM0_level2.evt | modeM0/AS1C07_001T04_9000004868_34078cztM0_level2_quad_clean.evt |
| Size (bytes) | 595,408,320 | 79,594,560 |
| Size | 567.8 MB | 75.9 MB |
| Events in quadrant A | 2,451,249 | 534,767 |
| Events in quadrant B | 6,236,293 | 503,028 |
| Events in quadrant C | 3,351,050 | 514,430 |
| Events in quadrant D | 5,629,281 | 480,714 |
| Mode M9 | |||
|---|---|---|---|
| Quadrant | BADHDUFLAG | Total packets | Discarded packets |
| A | 0 | 23 | 0 |
| B | 0 | 23 | 0 |
| C | 0 | 23 | 0 |
| D | 0 | 24 | 0 |
| Mode SS | |||
|---|---|---|---|
| Quadrant | BADHDUFLAG | Total packets | Discarded packets |
| A | 0 | 110 | 0 |
| B | 0 | 110 | 0 |
| C | 0 | 110 | 0 |
| D | 0 | 110 | 0 |
| Mode M0 | |||
|---|---|---|---|
| Quadrant | BADHDUFLAG | Total packets | Discarded packets |
| A | 0 | 10825 | 3 |
| B | 0 | 22158 | 2 |
| C | 0 | 13266 | 2 |
| D | 0 | 20454 | 2 |
| Quadrant | Total seconds | Saturated seconds | Saturation percentage |
|---|---|---|---|
| A | 5383 | 9 | 0.167193% |
| B | 5383 | 1181 | 21.939439% |
| C | 5383 | 76 | 1.411852% |
| D | 5383 | 493 | 9.158462% |
Noise dominated data is calculated using 1-second bins in cleaned event files. If a bin has >2000 counts, and if more than 50% of those come from <1% of pixels, then it is considered to be noise-dominated and hence unusable.
| Quadrant | # 1 sec bins | Bins with >0 counts | Bins with >2000 counts | High rate bins dominated by noise | Noise dominated (total time) | Noise dominated (detector-on time) | Marked lightcurve |
|---|---|---|---|---|---|---|---|
| A | 7115 | 5383 | 0 | 0 | 0.00% | 0.00% | 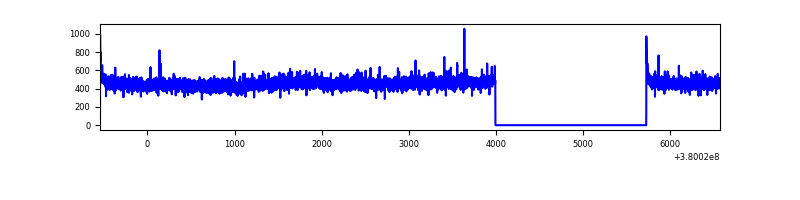 |
| B | 7114 | 5383 | 1026 | 1026 | 14.42% | 19.06% | 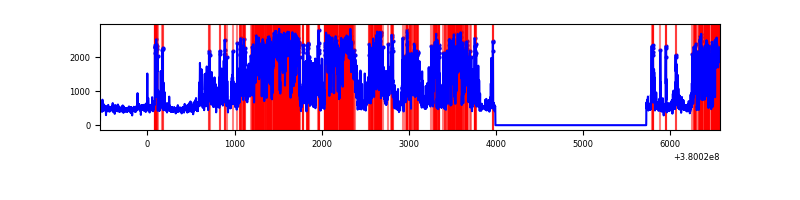 |
| C | 7114 | 5383 | 71 | 71 | 1.00% | 1.32% | 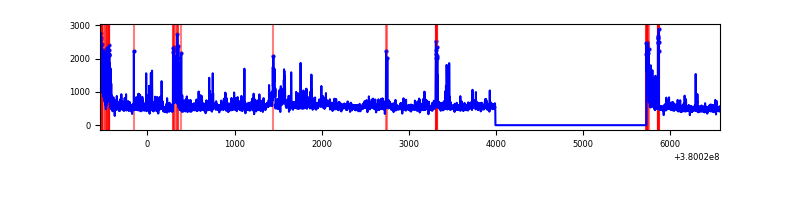 |
| D | 7115 | 5384 | 505 | 505 | 7.10% | 9.38% | 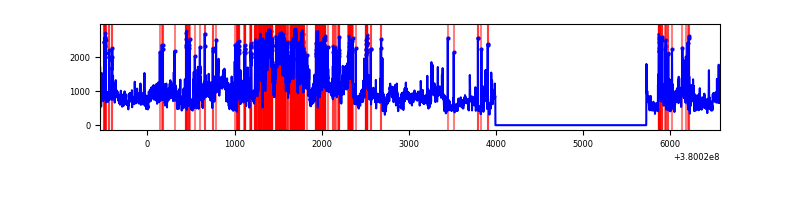 |
Top three noisy pixels from each quadrant. If the there are fewer than three noisy pixels in the level2.evt file, extra rows are filled as -1
| Pixel properties | Quadrant properties | ||||||
|---|---|---|---|---|---|---|---|
| Quadrant | DetID | PixID | Counts | Sigma | Mean | Median | Sigma |
| A | 15 | 169 | 38475 | 309.05 | 617 | 606 | 122.5 |
| A | 10 | 83 | 19115 | 151.05 | 617 | 606 | 122.5 |
| A | 13 | 254 | 10068 | 77.22 | 617 | 606 | 122.5 |
| B | 5 | 31 | 1923786 | 17646.03 | 567 | 553 | 109.0 |
| B | 5 | 172 | 1115108 | 10226.25 | 567 | 553 | 109.0 |
| B | 5 | 15 | 668085 | 6124.73 | 567 | 553 | 109.0 |
| C | 0 | 10 | 523503 | 3842.69 | 591 | 595 | 136.1 |
| C | 15 | 214 | 234608 | 1719.69 | 591 | 595 | 136.1 |
| C | 3 | 233 | 189847 | 1390.75 | 591 | 595 | 136.1 |
| D | 8 | 195 | 1529669 | 10750.94 | 582 | 565 | 142.2 |
| D | 1 | 52 | 1292457 | 9083.13 | 582 | 565 | 142.2 |
| D | 2 | 250 | 243715 | 1709.56 | 582 | 565 | 142.2 |
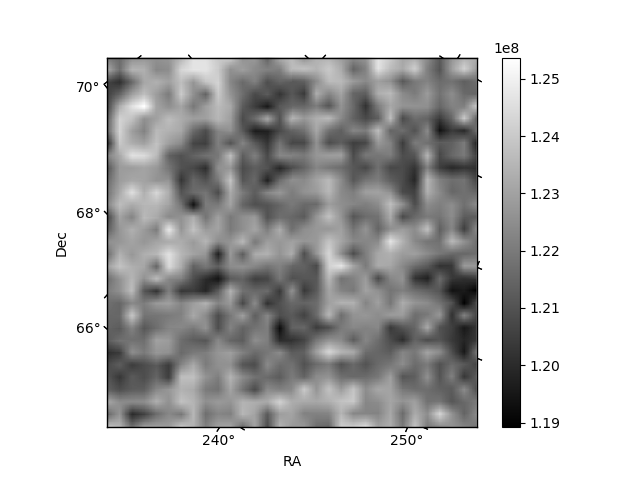
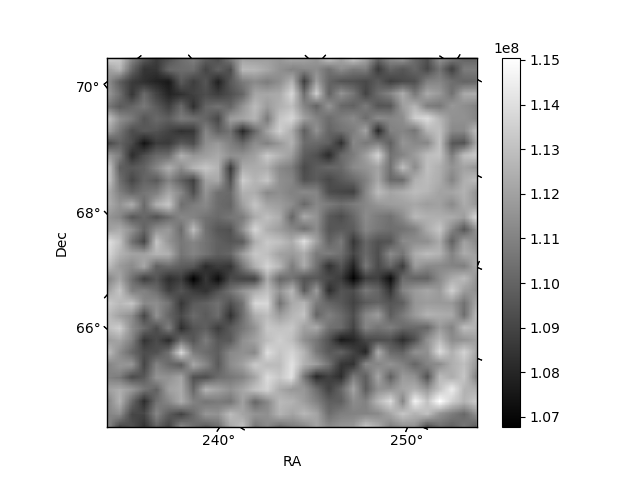
Histogram calculated using DETX and DETY for each event in the final _common_clean file
| Quadrant A | 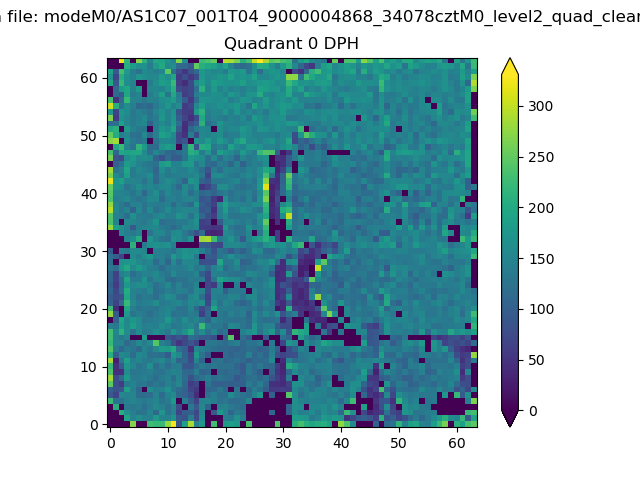 |
 |
Quadrant B |
|---|---|---|---|
| Quadrant D | 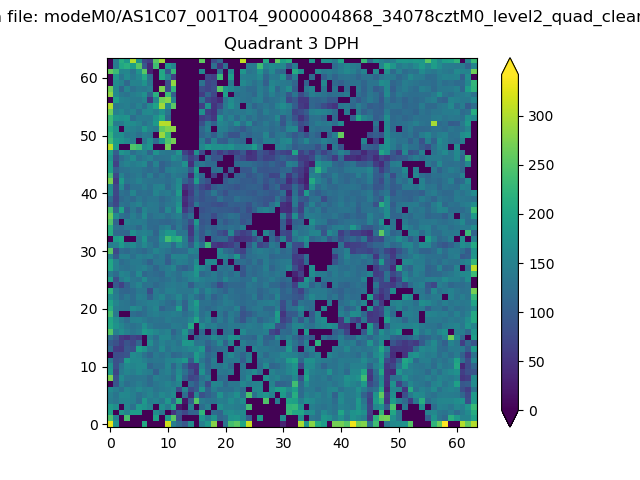 |
 |
Quadrant C |
| Plot type | Count rate plots | Images |
|---|---|---|
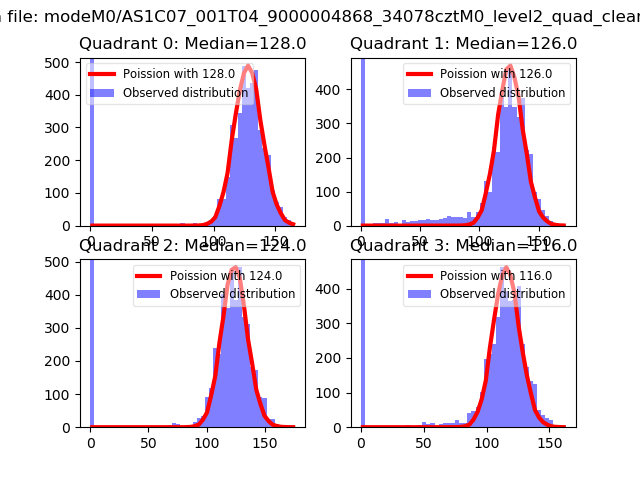
| Comparison with Poisson distribution Blue bars denote a histogram of data divided into 1 sec bins. Red curve is a Poisson curve with rate = median count rate of data. |
 |
 |
| Quadrant-wise count rates Data is divided into 100 sec bins |
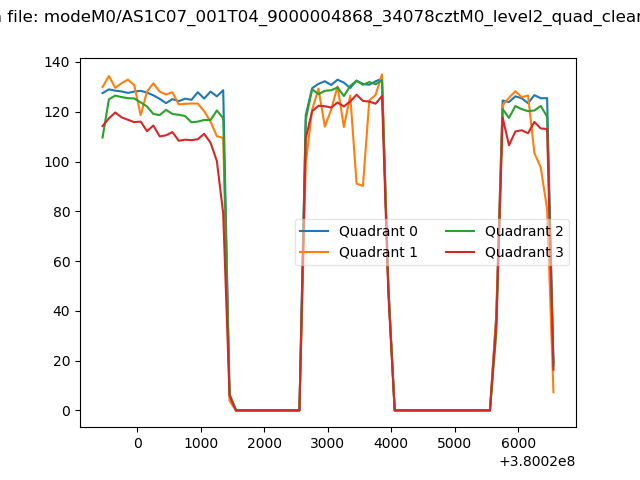 |
|
| Module-wise count rates for Quadrant A Data is divided into 100 sec bins |
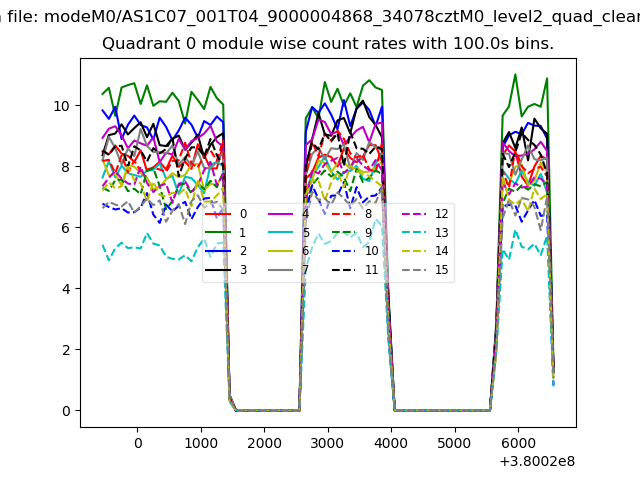 |
 |
| Module-wise count rates for Quadrant B Data is divided into 100 sec bins |
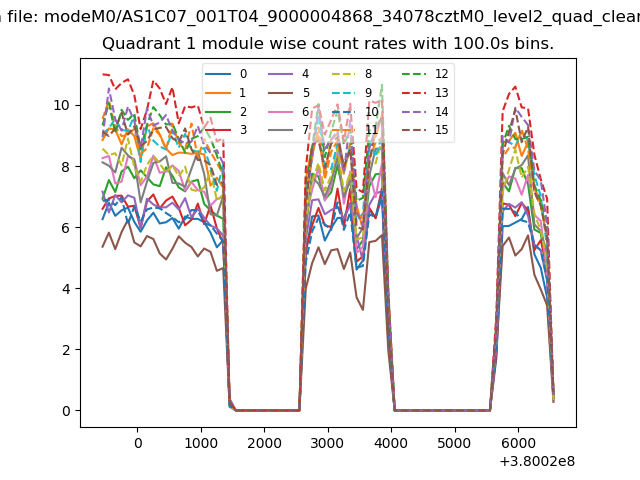 |
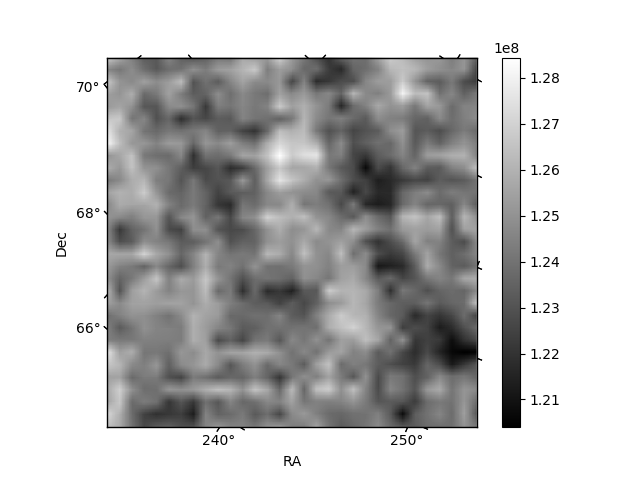 |
| Module-wise count rates for Quadrant C Data is divided into 100 sec bins |
 |
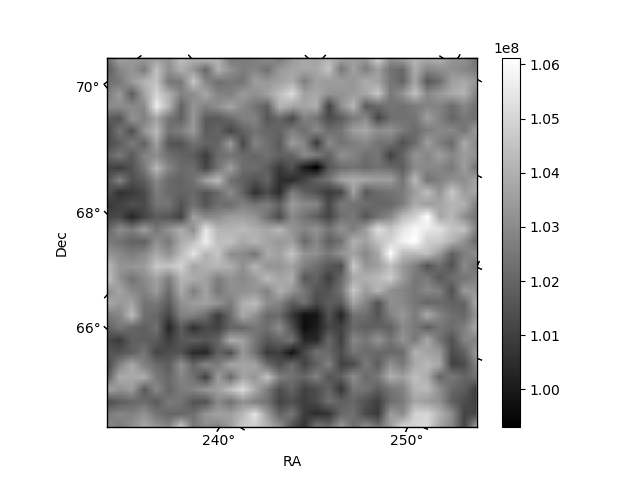 |
| Module-wise count rates for Quadrant D Data is divided into 100 sec bins |
 |
 |
| Parameter | Plot |
|---|---|
| CZT HV Monitor | 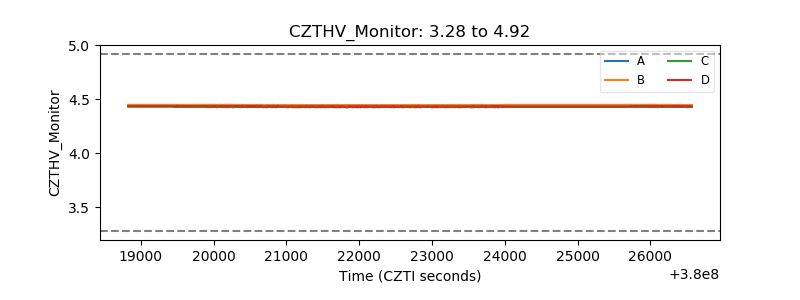 |
| D_VDD | 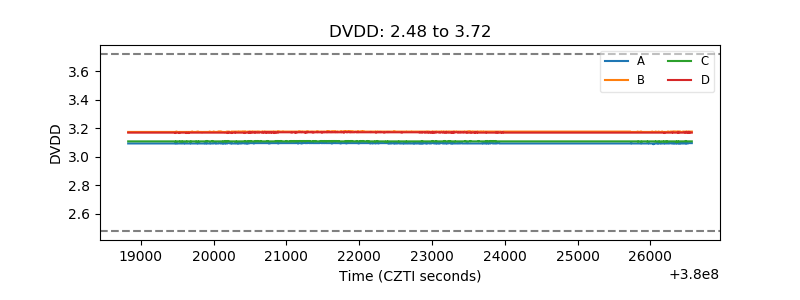 |
| Temperature 1 | 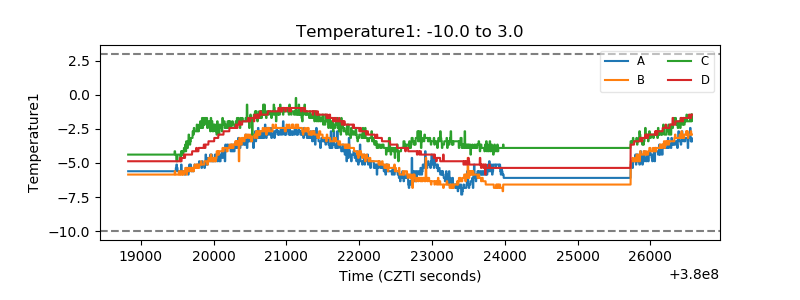 |
| Veto HV Monitor | 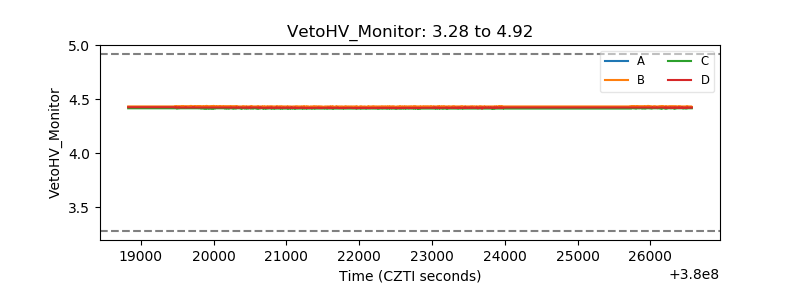 |
| Veto LLD |  |
| Alpha Counter | 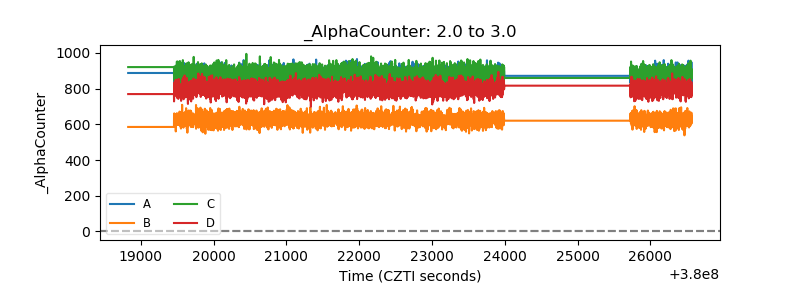 |
| _CPM_Rate | 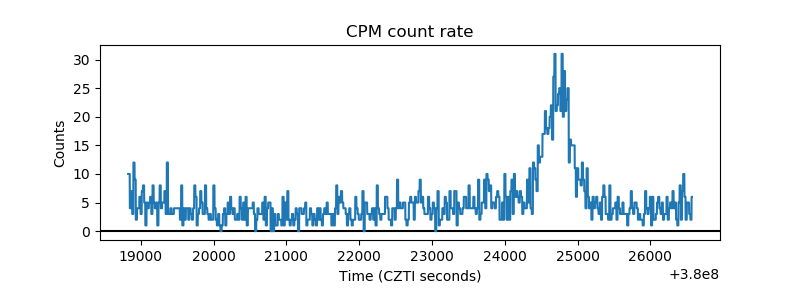 |
| CZT Counter | 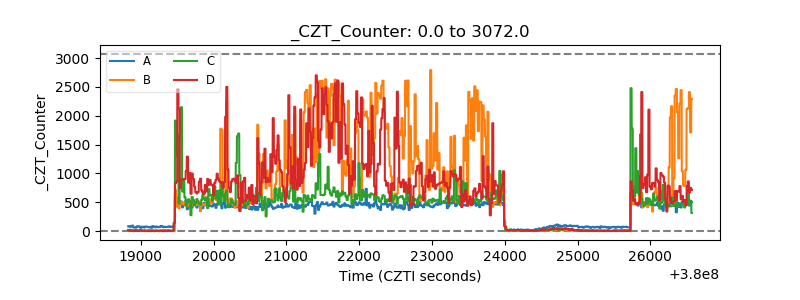 |
| +2.5 Volts monitor |  |
| +5 Volts monitor |  |
| _ROLL_ROT | 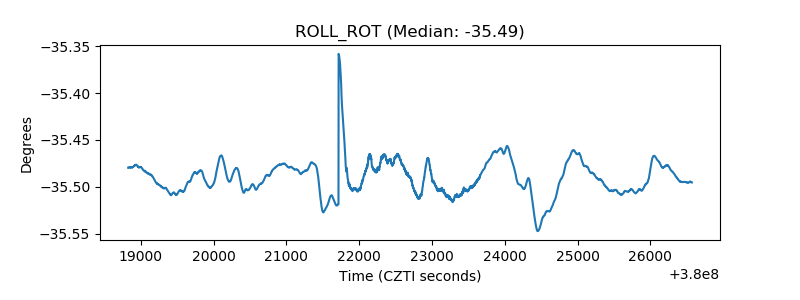 |
| _Roll_DEC | 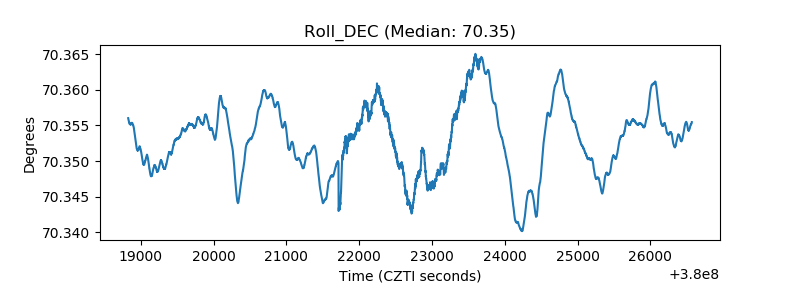 |
| _Roll_RA | 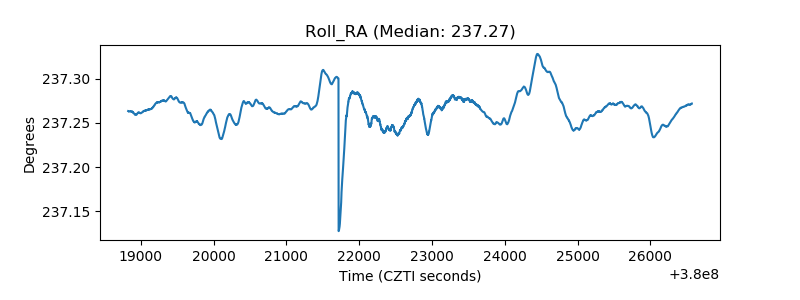 |
| Veto Counter | 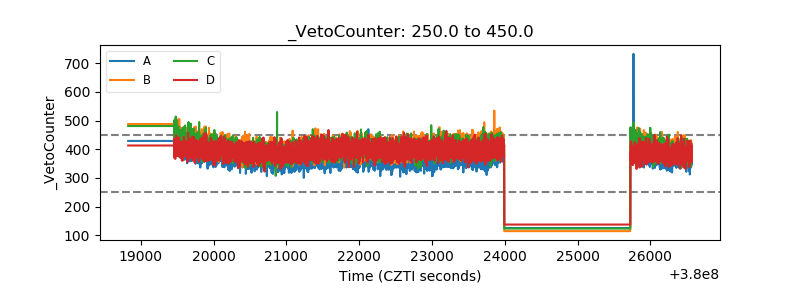 |