| Param | Original file | Final file |
|---|---|---|
| Filename | modeM0/AS1C07_001T04_9000004868_34083cztM0_level2.evt | modeM0/AS1C07_001T04_9000004868_34083cztM0_level2_quad_clean.evt |
| Size (bytes) | 76,671,360 | 13,642,560 |
| Size | 73.1 MB | 13.0 MB |
| Events in quadrant A | 402,527 | 92,524 |
| Events in quadrant B | 707,366 | 90,611 |
| Events in quadrant C | 494,823 | 86,588 |
| Events in quadrant D | 663,896 | 83,512 |
| Mode SS | |||
|---|---|---|---|
| Quadrant | BADHDUFLAG | Total packets | Discarded packets |
| A | 0 | 14 | 0 |
| B | 0 | 14 | 0 |
| C | 0 | 14 | 0 |
| D | 0 | 14 | 0 |
| Mode M0 | |||
|---|---|---|---|
| Quadrant | BADHDUFLAG | Total packets | Discarded packets |
| A | 0 | 1660 | 2 |
| B | 0 | 2633 | 1 |
| C | 0 | 1890 | 1 |
| D | 0 | 2470 | 1 |
| Quadrant | Total seconds | Saturated seconds | Saturation percentage |
|---|---|---|---|
| A | 744 | 1 | 0.134409% |
| B | 744 | 84 | 11.290323% |
| C | 744 | 31 | 4.166667% |
| D | 744 | 21 | 2.822581% |
Noise dominated data is calculated using 1-second bins in cleaned event files. If a bin has >2000 counts, and if more than 50% of those come from <1% of pixels, then it is considered to be noise-dominated and hence unusable.
| Quadrant | # 1 sec bins | Bins with >0 counts | Bins with >2000 counts | High rate bins dominated by noise | Noise dominated (total time) | Noise dominated (detector-on time) | Marked lightcurve |
|---|---|---|---|---|---|---|---|
| A | 743 | 743 | 0 | 0 | 0.00% | 0.00% | 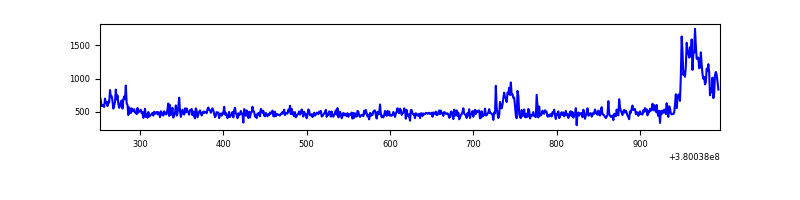 |
| B | 744 | 744 | 60 | 60 | 8.06% | 8.06% | 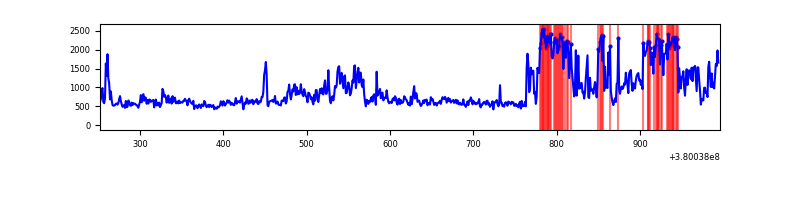 |
| C | 744 | 744 | 26 | 26 | 3.49% | 3.49% | 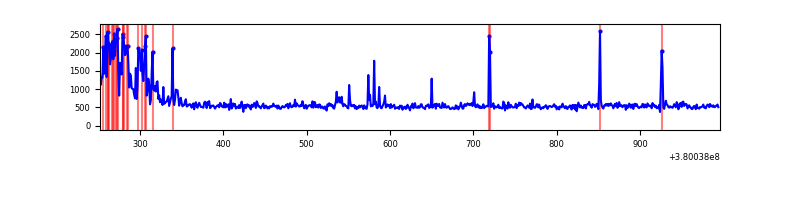 |
| D | 743 | 743 | 13 | 13 | 1.75% | 1.75% | 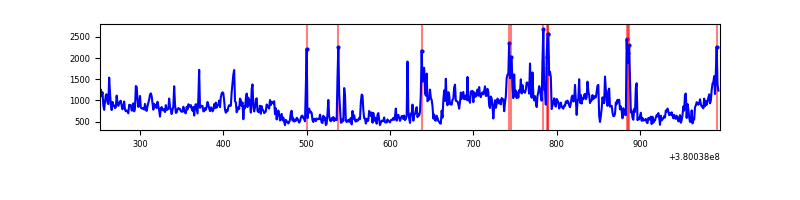 |
Top three noisy pixels from each quadrant. If the there are fewer than three noisy pixels in the level2.evt file, extra rows are filled as -1
| Pixel properties | Quadrant properties | ||||||
|---|---|---|---|---|---|---|---|
| Quadrant | DetID | PixID | Counts | Sigma | Mean | Median | Sigma |
| A | 15 | 169 | 48344 | 2350.14 | 90 | 88 | 20.5 |
| A | 10 | 83 | 5800 | 278.18 | 90 | 88 | 20.5 |
| A | 13 | 254 | 1457 | 66.67 | 90 | 88 | 20.5 |
| B | 5 | 31 | 134701 | 7011.87 | 86 | 84 | 19.2 |
| B | 0 | 219 | 53442 | 2779.29 | 86 | 84 | 19.2 |
| B | 5 | 15 | 49722 | 2585.52 | 86 | 84 | 19.2 |
| C | 0 | 10 | 111454 | 5265.56 | 83 | 84 | 21.2 |
| C | 15 | 214 | 36514 | 1722.41 | 83 | 84 | 21.2 |
| C | 3 | 233 | 10212 | 478.85 | 83 | 84 | 21.2 |
| D | 8 | 195 | 188124 | 8257.75 | 85 | 82 | 22.8 |
| D | 12 | 233 | 29947 | 1311.5 | 85 | 82 | 22.8 |
| D | 13 | 249 | 27275 | 1194.16 | 85 | 82 | 22.8 |
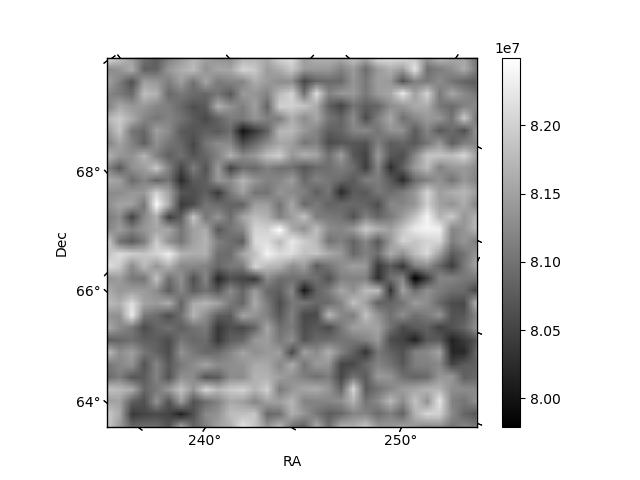
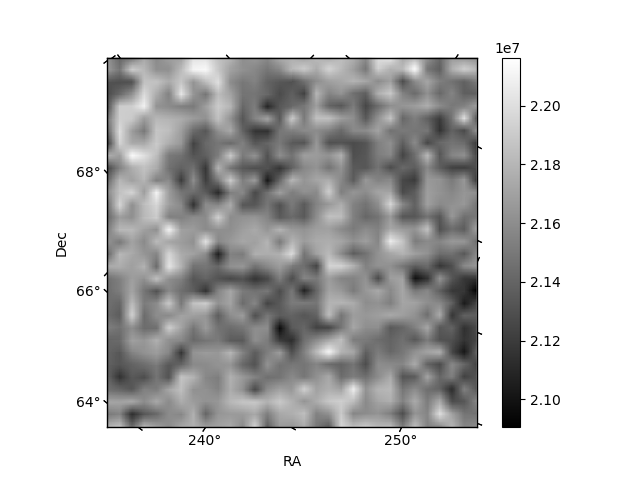
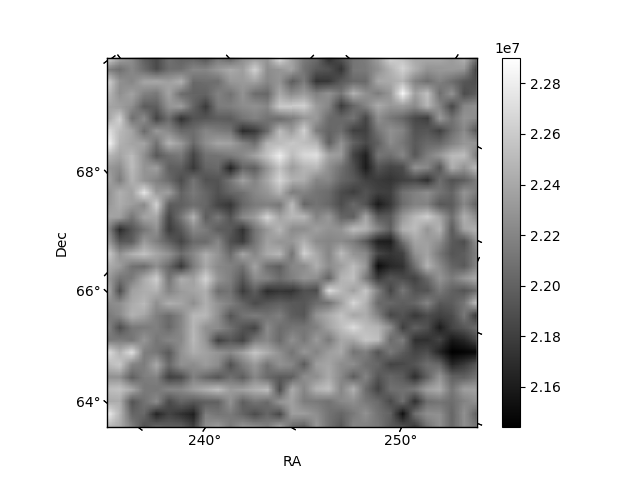
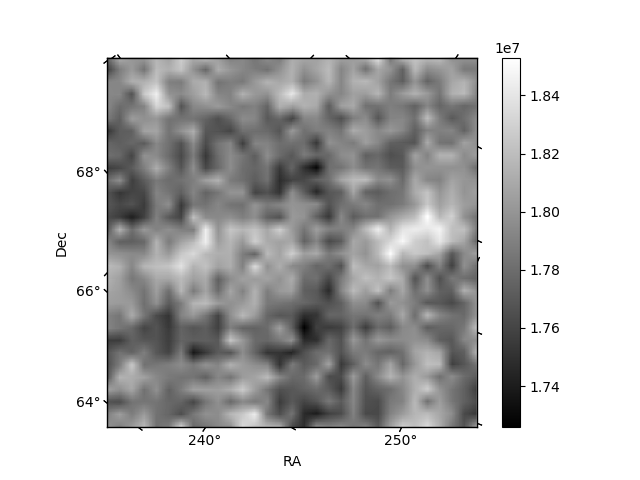
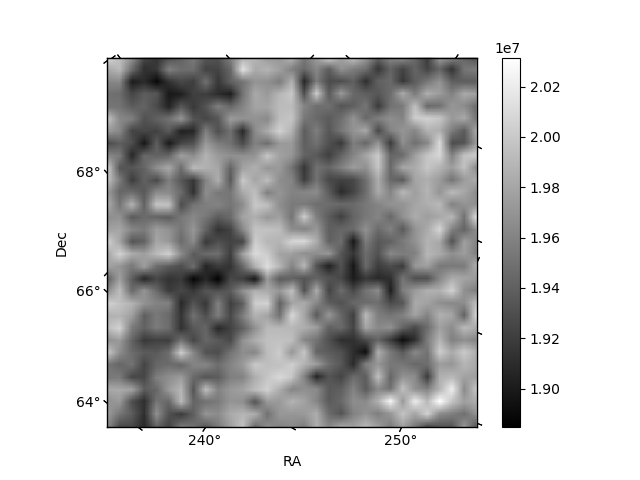
Histogram calculated using DETX and DETY for each event in the final _common_clean file
| Quadrant A | 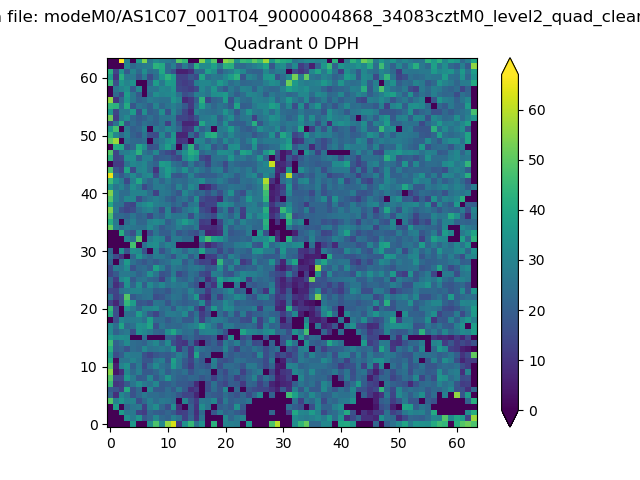 |
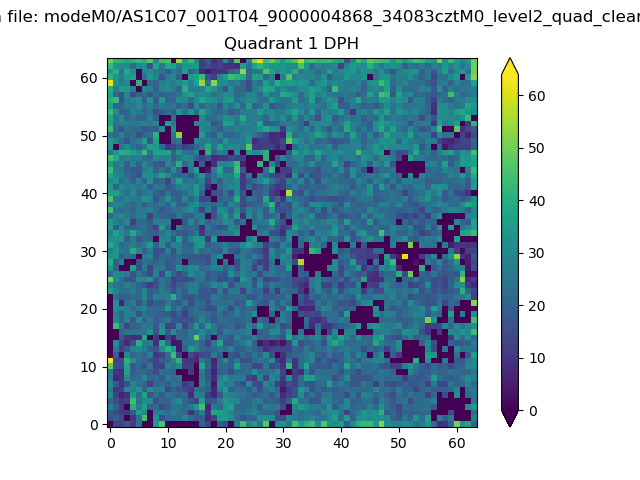 |
Quadrant B |
|---|---|---|---|
| Quadrant D | 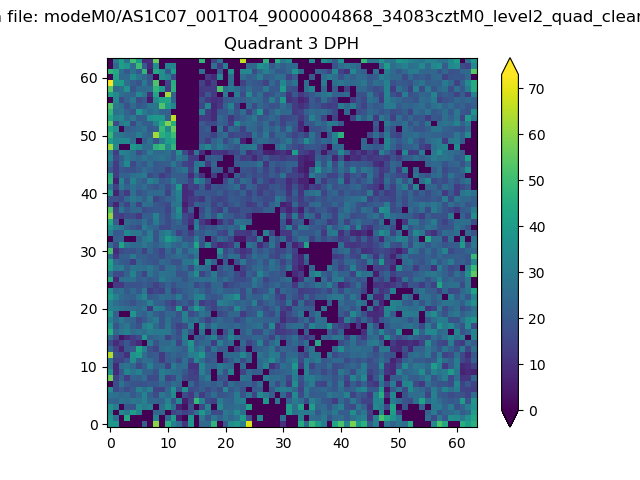 |
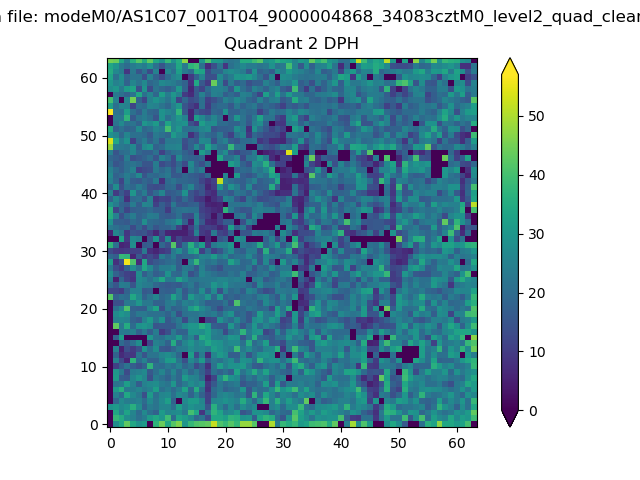 |
Quadrant C |
| Plot type | Count rate plots | Images |
|---|---|---|
| Comparison with Poisson distribution Blue bars denote a histogram of data divided into 1 sec bins. Red curve is a Poisson curve with rate = median count rate of data. |
 |
 |
| Quadrant-wise count rates Data is divided into 100 sec bins |
 |
|
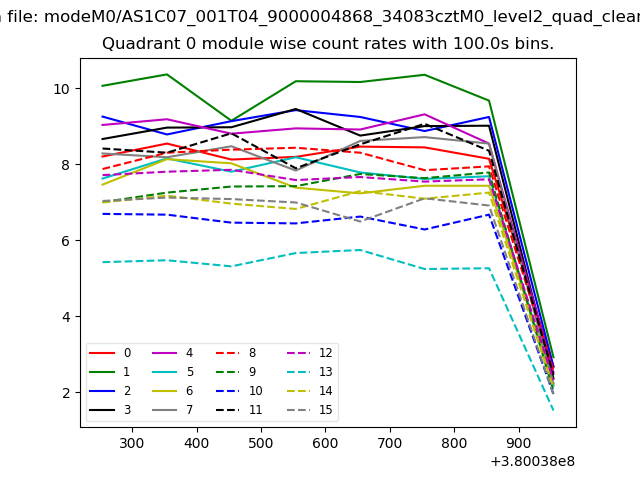
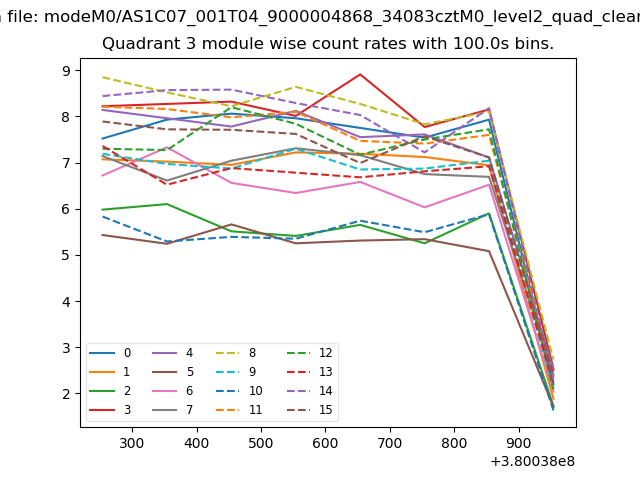
| Module-wise count rates for Quadrant A Data is divided into 100 sec bins |
 |
 |
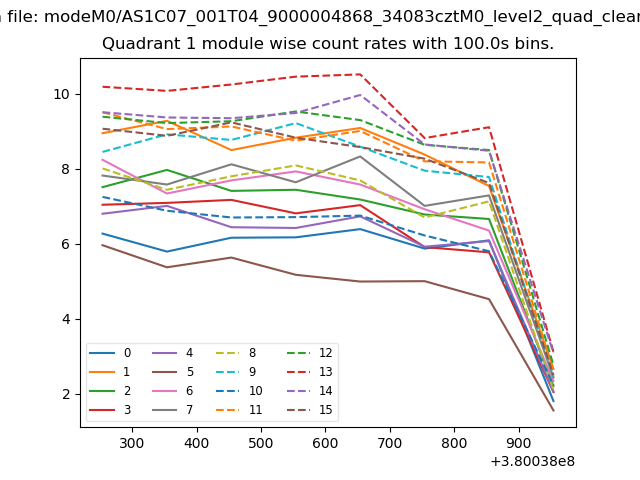
| Module-wise count rates for Quadrant B Data is divided into 100 sec bins |
 |
 |
| Module-wise count rates for Quadrant C Data is divided into 100 sec bins |
 |
 |
| Module-wise count rates for Quadrant D Data is divided into 100 sec bins |
 |
 |
| Parameter | Plot |
|---|---|
| CZT HV Monitor |  |
| D_VDD | 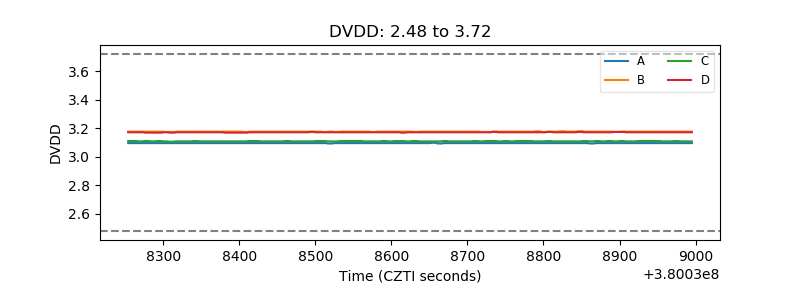 |
| Temperature 1 | 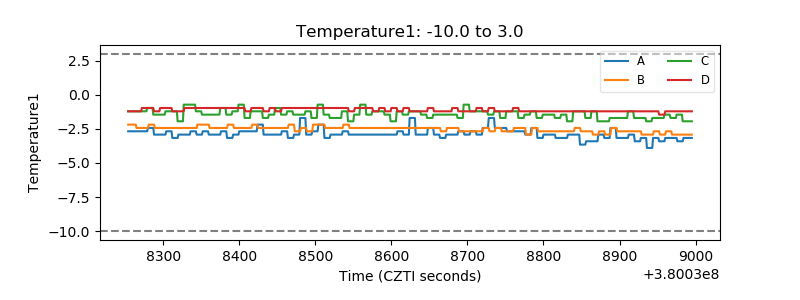 |
| Veto HV Monitor | 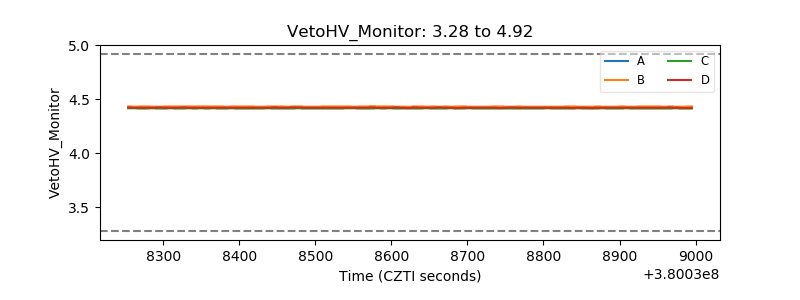 |
| Veto LLD | 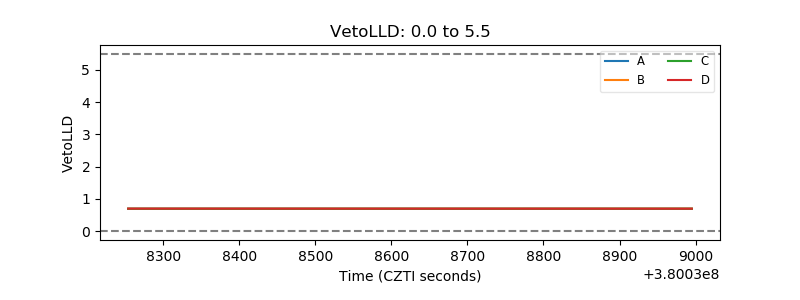 |
| Alpha Counter | 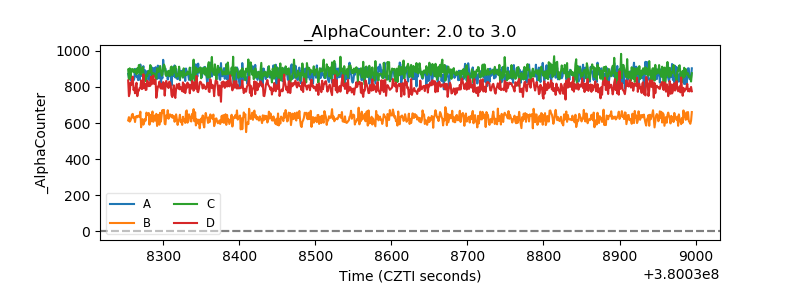 |
| _CPM_Rate | 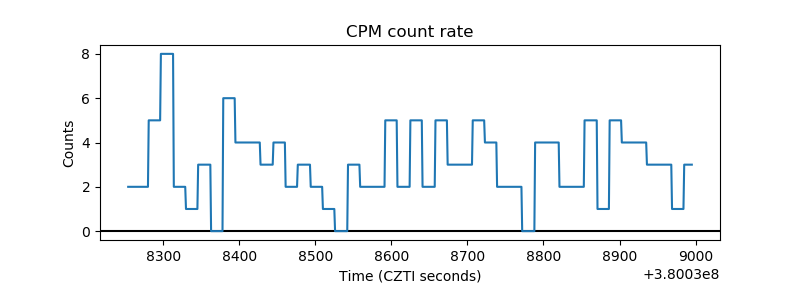 |
| CZT Counter | 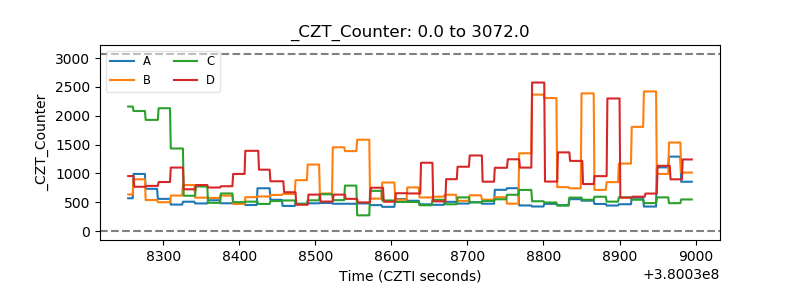 |
| +2.5 Volts monitor |  |
| +5 Volts monitor |  |
| _ROLL_ROT | 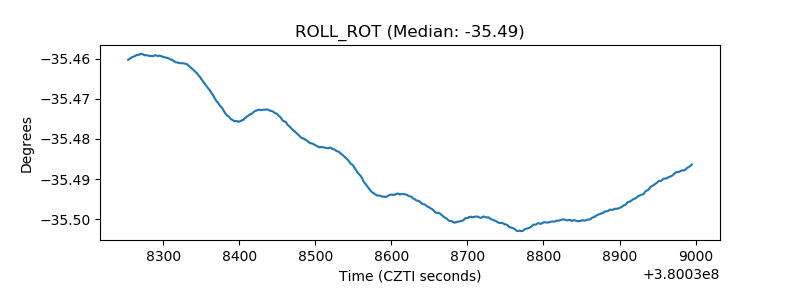 |
| _Roll_DEC | 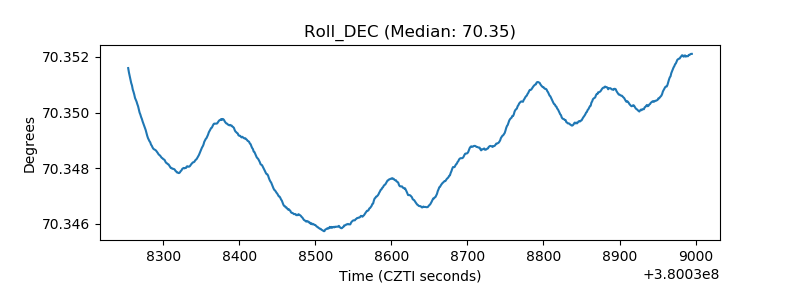 |
| _Roll_RA | 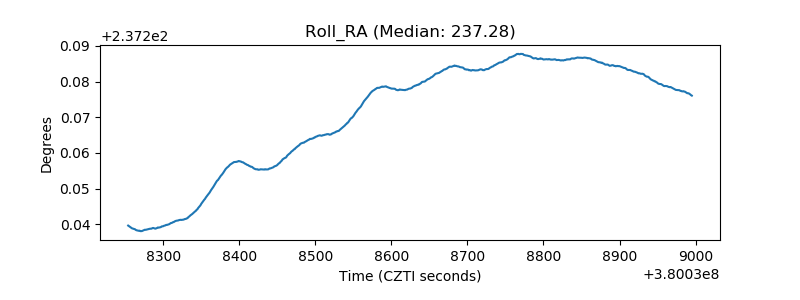 |
| Veto Counter | 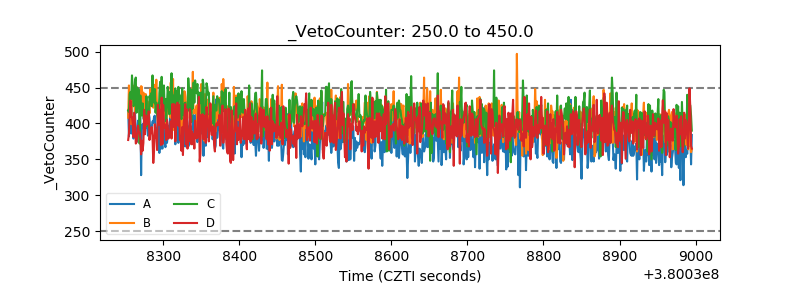 |