| Param | Original file | Final file |
|---|---|---|
| Filename | modeM0/AS1C07_001T04_9000004868_34084cztM0_level2.evt | modeM0/AS1C07_001T04_9000004868_34084cztM0_level2_quad_clean.evt |
| Size (bytes) | 320,080,320 | 39,602,880 |
| Size | 305.3 MB | 37.8 MB |
| Events in quadrant A | 1,417,131 | 247,054 |
| Events in quadrant B | 3,690,584 | 241,292 |
| Events in quadrant C | 1,750,338 | 245,829 |
| Events in quadrant D | 2,615,042 | 234,803 |
| Mode SS | |||
|---|---|---|---|
| Quadrant | BADHDUFLAG | Total packets | Discarded packets |
| A | 0 | 64 | 0 |
| B | 0 | 64 | 0 |
| C | 0 | 64 | 0 |
| D | 0 | 64 | 0 |
| Mode M0 | |||
|---|---|---|---|
| Quadrant | BADHDUFLAG | Total packets | Discarded packets |
| A | 0 | 6577 | 0 |
| B | 0 | 13209 | 0 |
| C | 0 | 7068 | 0 |
| D | 0 | 9975 | 0 |
| Quadrant | Total seconds | Saturated seconds | Saturation percentage |
|---|---|---|---|
| A | 3237 | 2 | 0.061786% |
| B | 3237 | 564 | 17.423540% |
| C | 3237 | 16 | 0.494285% |
| D | 3237 | 164 | 5.066420% |
Noise dominated data is calculated using 1-second bins in cleaned event files. If a bin has >2000 counts, and if more than 50% of those come from <1% of pixels, then it is considered to be noise-dominated and hence unusable.
| Quadrant | # 1 sec bins | Bins with >0 counts | Bins with >2000 counts | High rate bins dominated by noise | Noise dominated (total time) | Noise dominated (detector-on time) | Marked lightcurve |
|---|---|---|---|---|---|---|---|
| A | 3237 | 3237 | 0 | 0 | 0.00% | 0.00% | 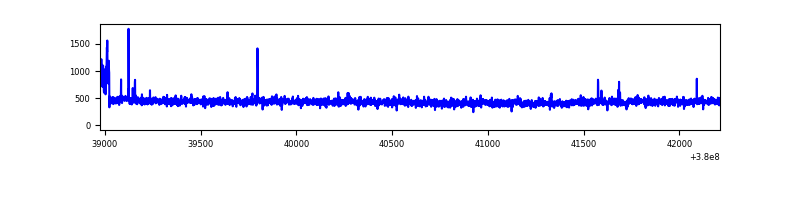 |
| B | 3236 | 3236 | 481 | 481 | 14.86% | 14.86% | 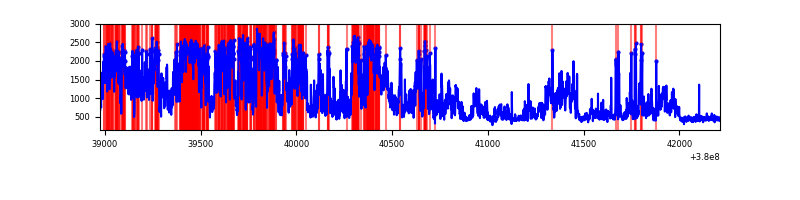 |
| C | 3236 | 3236 | 15 | 15 | 0.46% | 0.46% | 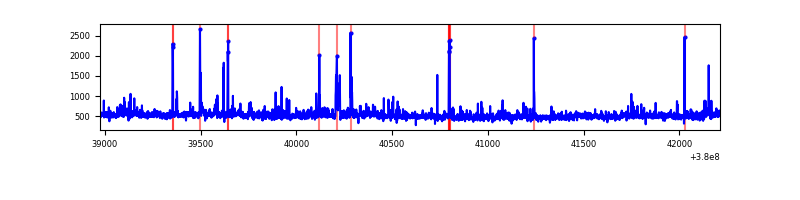 |
| D | 3237 | 3237 | 164 | 164 | 5.07% | 5.07% | 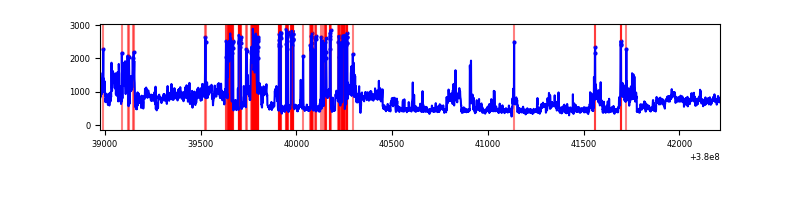 |
Top three noisy pixels from each quadrant. If the there are fewer than three noisy pixels in the level2.evt file, extra rows are filled as -1
| Pixel properties | Quadrant properties | ||||||
|---|---|---|---|---|---|---|---|
| Quadrant | DetID | PixID | Counts | Sigma | Mean | Median | Sigma |
| A | 15 | 169 | 35158 | 481.48 | 354 | 346 | 72.3 |
| A | 10 | 130 | 6654 | 87.24 | 354 | 346 | 72.3 |
| A | 13 | 254 | 6123 | 79.9 | 354 | 346 | 72.3 |
| B | 5 | 31 | 1358704 | 20358.91 | 340 | 331 | 66.7 |
| B | 5 | 15 | 530107 | 7940.13 | 340 | 331 | 66.7 |
| B | 5 | 172 | 267118 | 3998.53 | 340 | 331 | 66.7 |
| C | 0 | 10 | 138287 | 1687.27 | 348 | 351 | 81.8 |
| C | 15 | 214 | 135182 | 1649.29 | 348 | 351 | 81.8 |
| C | 3 | 233 | 63114 | 767.73 | 348 | 351 | 81.8 |
| D | 8 | 195 | 677735 | 8051.54 | 339 | 328 | 84.1 |
| D | 7 | 223 | 332297 | 3945.72 | 339 | 328 | 84.1 |
| D | 13 | 249 | 66231 | 783.31 | 339 | 328 | 84.1 |
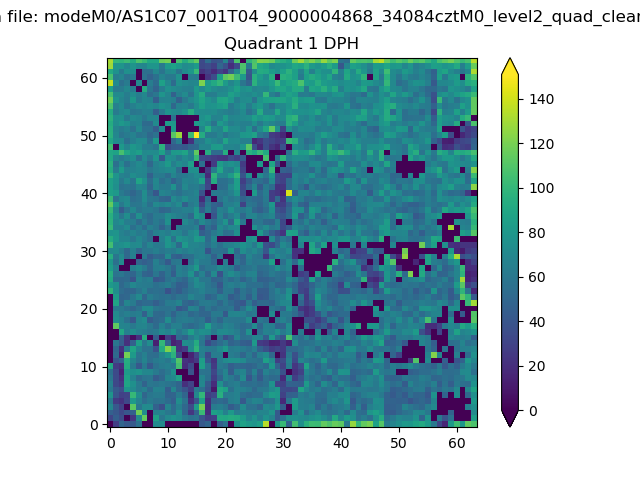
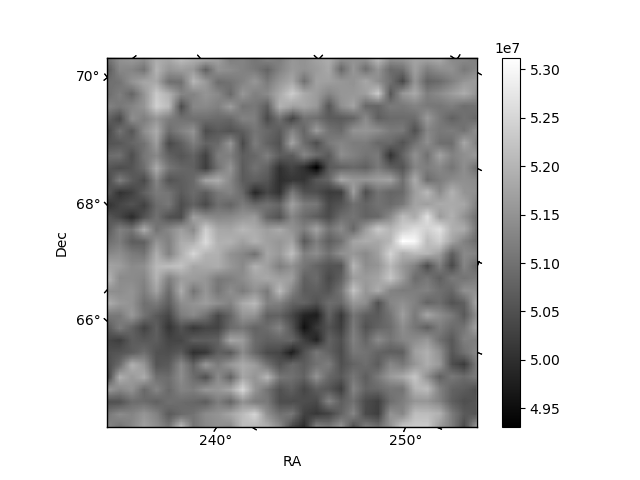
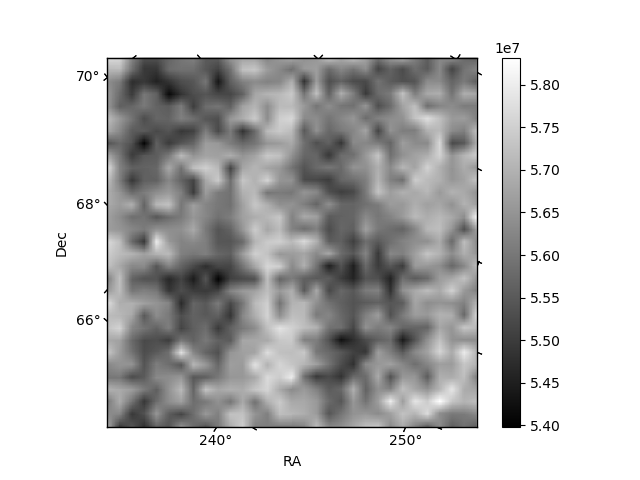
Histogram calculated using DETX and DETY for each event in the final _common_clean file
| Quadrant A |  |
 |
Quadrant B |
|---|---|---|---|
| Quadrant D | 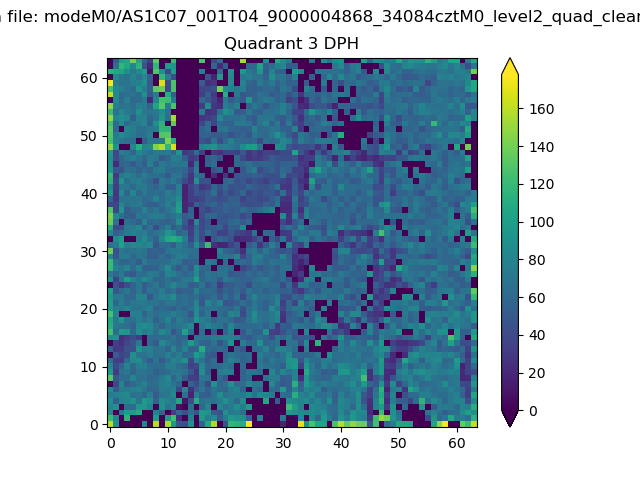 |
 |
Quadrant C |
| Plot type | Count rate plots | Images |
|---|---|---|
| Comparison with Poisson distribution Blue bars denote a histogram of data divided into 1 sec bins. Red curve is a Poisson curve with rate = median count rate of data. |
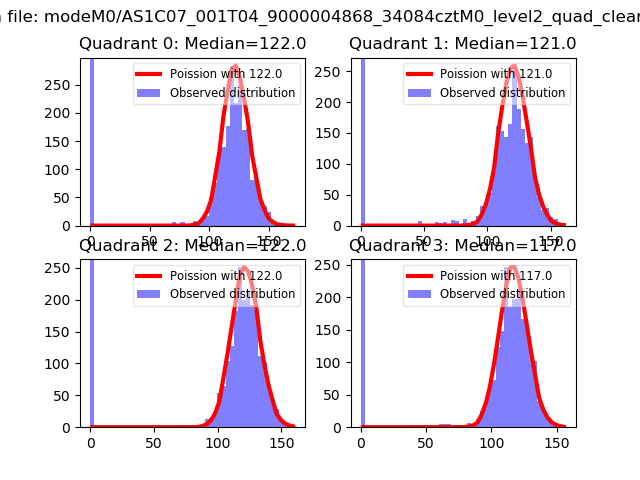 |
 |
| Quadrant-wise count rates Data is divided into 100 sec bins |
 |
|
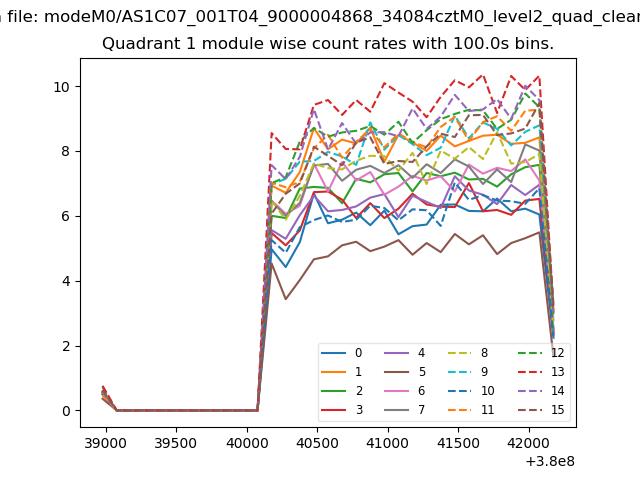
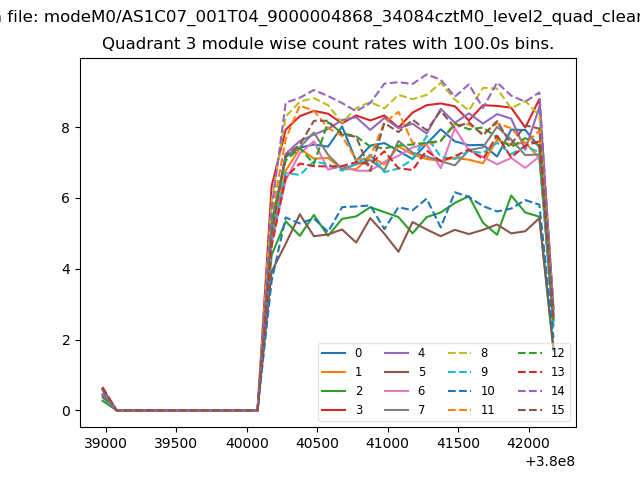
| Module-wise count rates for Quadrant A Data is divided into 100 sec bins |
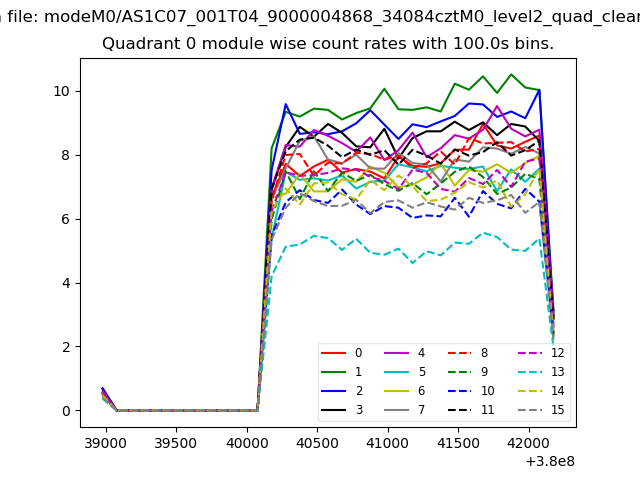 |
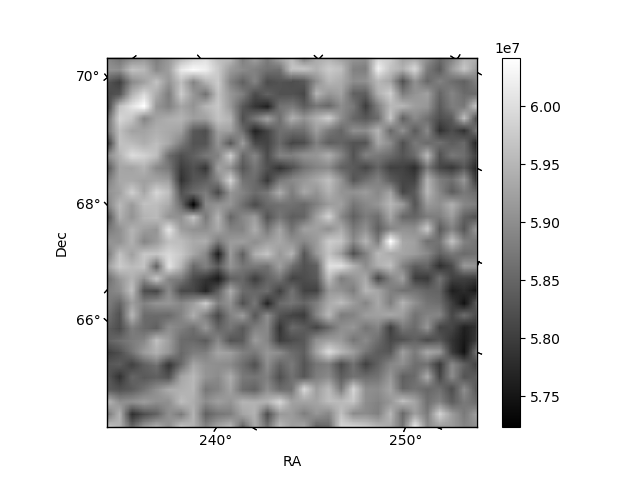 |
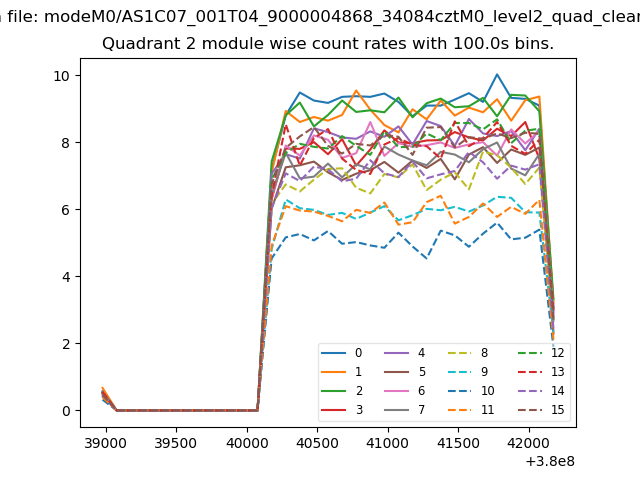
| Module-wise count rates for Quadrant B Data is divided into 100 sec bins |
 |
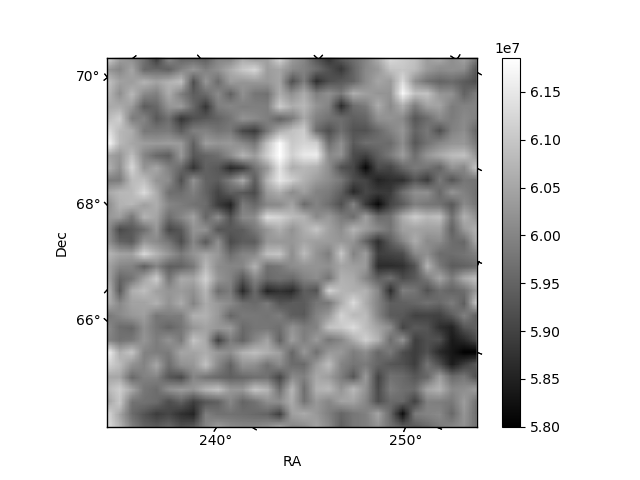 |
| Module-wise count rates for Quadrant C Data is divided into 100 sec bins |
 |
 |
| Module-wise count rates for Quadrant D Data is divided into 100 sec bins |
 |
 |
| Parameter | Plot |
|---|---|
| CZT HV Monitor | 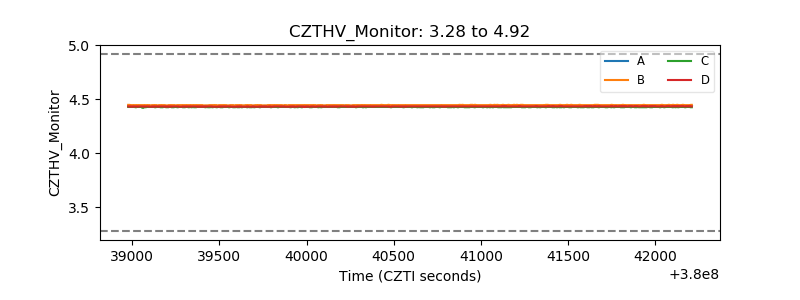 |
| D_VDD | 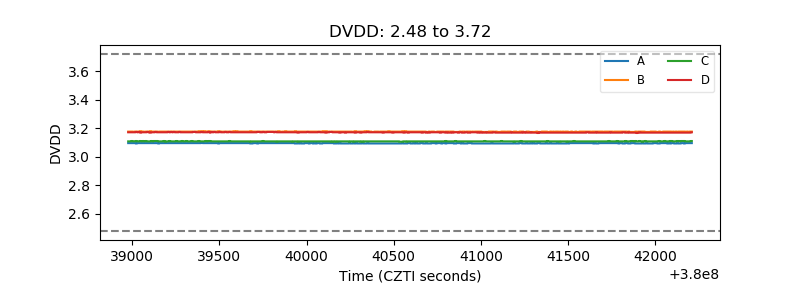 |
| Temperature 1 | 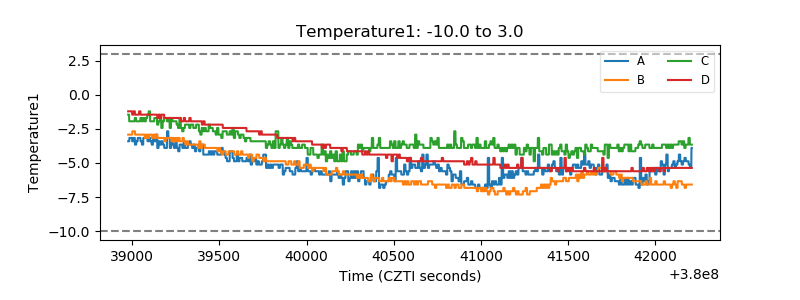 |
| Veto HV Monitor | 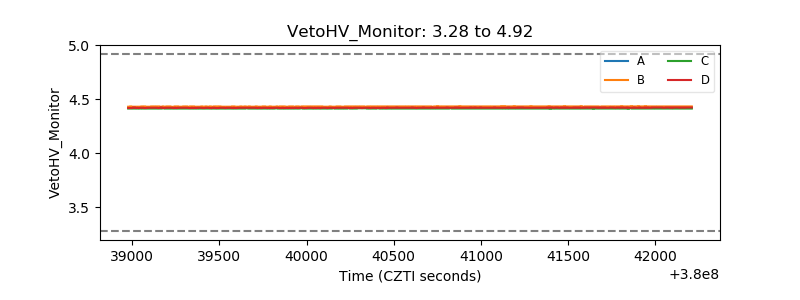 |
| Veto LLD | 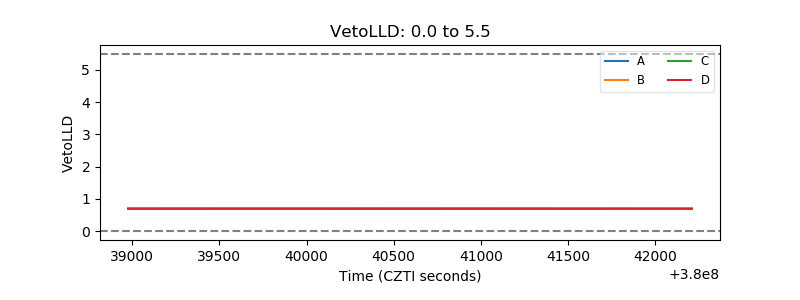 |
| Alpha Counter |  |
| _CPM_Rate | 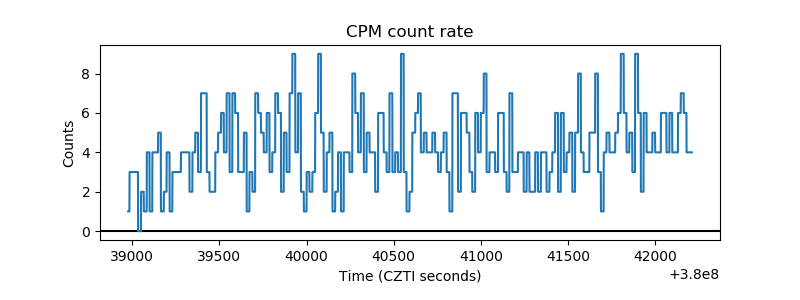 |
| CZT Counter |  |
| +2.5 Volts monitor |  |
| +5 Volts monitor |  |
| _ROLL_ROT | 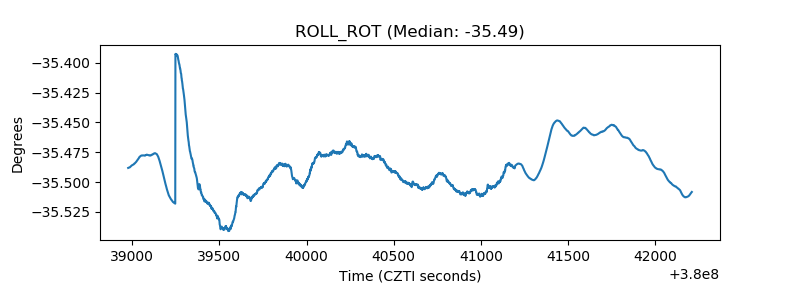 |
| _Roll_DEC | 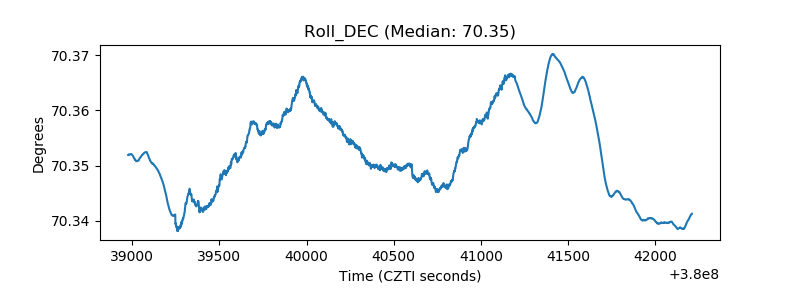 |
| _Roll_RA |  |
| Veto Counter | 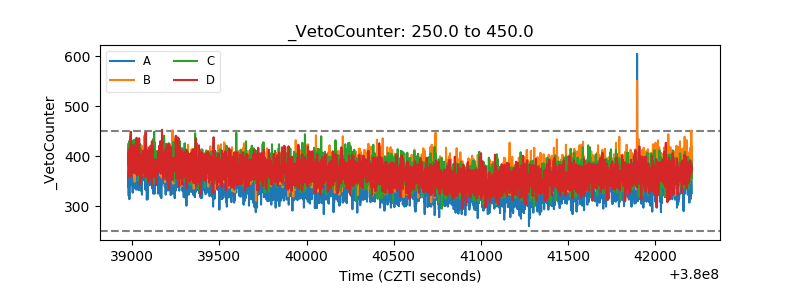 |