| Param | Original file | Final file |
|---|---|---|
| Filename | modeM0/AS1A05_208T01_9000004870cztM0_level2.fits | modeM0/AS1A05_208T01_9000004870cztM0_level2_quad_clean.evt |
| Size (bytes) | 952,099,200 | 805,265,280 |
| Size | 908.0 MB | 768.0 MB |
| Events in quadrant A | 5,968,912 | 4,718,242 |
| Events in quadrant B | 5,520,020 | 4,537,534 |
| Events in quadrant C | 5,754,920 | 4,477,921 |
| Events in quadrant D | 4,791,882 | 3,858,559 |
| Mode SS | |||
|---|---|---|---|
| Quadrant | BADHDUFLAG | Total packets | Discarded packets |
| A | 0 | 2022 | 0 |
| B | 0 | 2022 | 0 |
| C | 0 | 2022 | 0 |
| D | 0 | 2022 | 0 |
| Mode M9 | |||
|---|---|---|---|
| Quadrant | BADHDUFLAG | Total packets | Discarded packets |
| A | 0 | 383 | 0 |
| B | 0 | 383 | 0 |
| C | 0 | 383 | 0 |
| D | 0 | 383 | 0 |
| Mode M0 | |||
|---|---|---|---|
| Quadrant | BADHDUFLAG | Total packets | Discarded packets |
| A | 0 | 205539 | 0 |
| B | 0 | 286488 | 0 |
| C | 0 | 244226 | 0 |
| D | 0 | 351189 | 0 |
| Quadrant | Total seconds | Saturated seconds | Saturation percentage |
|---|---|---|---|
| A | 99123 | 753 | 0.759662% |
| B | 99123 | 6493 | 6.550447% |
| C | 99123 | 2193 | 2.212403% |
| D | 99123 | 8101 | 8.172674% |
Noise dominated data is calculated using 1-second bins in cleaned event files. If a bin has >2000 counts, and if more than 50% of those come from <1% of pixels, then it is considered to be noise-dominated and hence unusable.
| Quadrant | # 1 sec bins | Bins with >0 counts | Bins with >2000 counts | High rate bins dominated by noise | Noise dominated (total time) | Noise dominated (detector-on time) | Marked lightcurve |
|---|---|---|---|---|---|---|---|
| A | 143399 | 99114 | 0 | 0 | 0.00% | 0.00% |  |
| B | 143399 | 99037 | 0 | 0 | 0.00% | 0.00% |  |
| C | 143399 | 99090 | 0 | 0 | 0.00% | 0.00% |  |
| D | 143399 | 99044 | 0 | 0 | 0.00% | 0.00% |  |
Top three noisy pixels from each quadrant. If the there are fewer than three noisy pixels in the level2.evt file, extra rows are filled as -1
| Pixel properties | Quadrant properties | ||||||
|---|---|---|---|---|---|---|---|
| Quadrant | DetID | PixID | Counts | Sigma | Mean | Median | Sigma |
| A | 9 | 19 | 4840 | 8.83 | 1557 | 1458 | 383.1 |
| A | 7 | 110 | 4840 | 8.83 | 1557 | 1458 | 383.1 |
| A | 0 | 29 | 4683 | 8.42 | 1557 | 1458 | 383.1 |
| B | 2 | 9 | 4856 | 12.18 | 1461 | 1395 | 284.1 |
| B | 3 | 80 | 4236 | 10.0 | 1461 | 1395 | 284.1 |
| B | 2 | 8 | 3900 | 8.82 | 1461 | 1395 | 284.1 |
| C | 1 | 81 | 4792 | 8.64 | 1521 | 1430 | 389.2 |
| C | 1 | 80 | 4641 | 8.25 | 1521 | 1430 | 389.2 |
| C | 3 | 203 | 4449 | 7.76 | 1521 | 1430 | 389.2 |
| D | 7 | 3 | 3536 | 6.26 | 1373 | 1250 | 365.3 |
| D | 4 | 160 | 3524 | 6.23 | 1373 | 1250 | 365.3 |
| D | 10 | 189 | 3488 | 6.13 | 1373 | 1250 | 365.3 |
Histogram calculated using DETX and DETY for each event in the final _common_clean file
| Quadrant A | 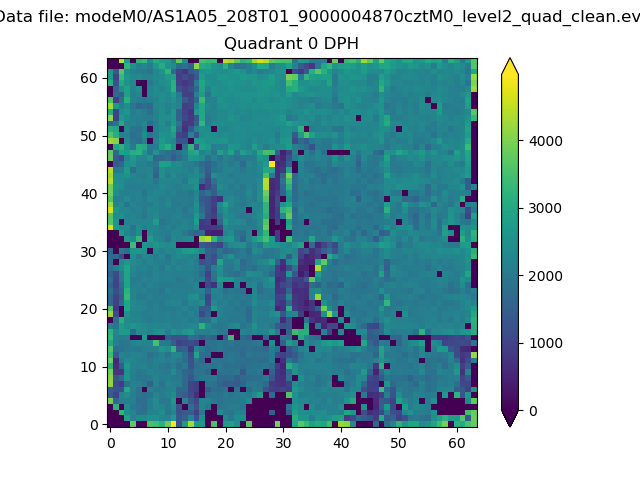 |
 |
Quadrant B |
|---|---|---|---|
| Quadrant D | 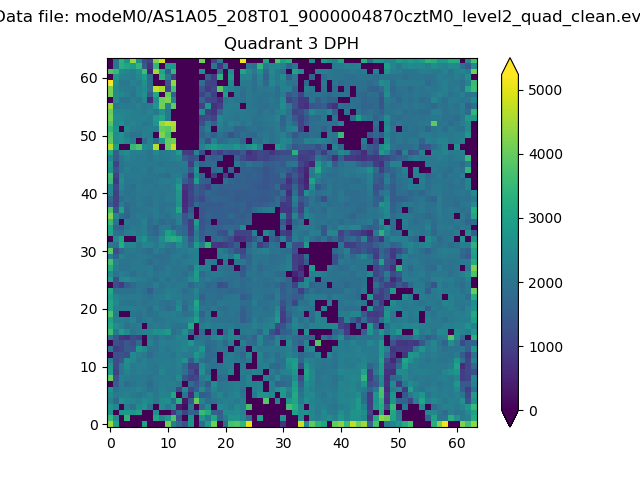 |
 |
Quadrant C |
| Plot type | Count rate plots | Images |
|---|---|---|
| Comparison with Poisson distribution Blue bars denote a histogram of data divided into 1 sec bins. Red curve is a Poisson curve with rate = median count rate of data. |
 |
 |
| Quadrant-wise count rates Data is divided into 100 sec bins |
 |
|
| Module-wise count rates for Quadrant A Data is divided into 100 sec bins |
 |
 |
| Module-wise count rates for Quadrant B Data is divided into 100 sec bins |
 |
 |
| Module-wise count rates for Quadrant C Data is divided into 100 sec bins |
 |
 |
| Module-wise count rates for Quadrant D Data is divided into 100 sec bins |
 |
 |
| Parameter | Plot |
|---|---|
| CZT HV Monitor |  |
| D_VDD |  |
| Temperature 1 |  |
| Veto HV Monitor |  |
| Veto LLD |  |
| Alpha Counter |  |
| _CPM_Rate |  |
| CZT Counter |  |
| +2.5 Volts monitor |  |
| +5 Volts monitor |  |
| _ROLL_ROT |  |
| _Roll_DEC |  |
| _Roll_RA |  |
| Veto Counter |  |