| Param | Original file | Final file |
|---|---|---|
| Filename | modeM0/AS1A05_208T01_9000004870_34084cztM0_level2.evt | modeM0/AS1A05_208T01_9000004870_34084cztM0_level2_quad_clean.evt |
| Size (bytes) | 1,354,115,520 | 204,413,760 |
| Size | 1.3 GB | 194.9 MB |
| Events in quadrant A | 6,574,034 | 1,335,098 |
| Events in quadrant B | 11,099,077 | 1,312,391 |
| Events in quadrant C | 8,545,167 | 1,323,093 |
| Events in quadrant D | 13,824,561 | 1,228,710 |
| Mode SS | |||
|---|---|---|---|
| Quadrant | BADHDUFLAG | Total packets | Discarded packets |
| A | 0 | 294 | 0 |
| B | 0 | 294 | 0 |
| C | 0 | 294 | 0 |
| D | 0 | 294 | 0 |
| Mode M9 | |||
|---|---|---|---|
| Quadrant | BADHDUFLAG | Total packets | Discarded packets |
| A | 0 | 50 | 0 |
| B | 0 | 49 | 0 |
| C | 0 | 49 | 0 |
| D | 0 | 49 | 0 |
| Mode M0 | |||
|---|---|---|---|
| Quadrant | BADHDUFLAG | Total packets | Discarded packets |
| A | 0 | 29122 | 3 |
| B | 0 | 42646 | 3 |
| C | 0 | 34207 | 3 |
| D | 0 | 50986 | 3 |
| Quadrant | Total seconds | Saturated seconds | Saturation percentage |
|---|---|---|---|
| A | 14371 | 22 | 0.153086% |
| B | 14371 | 765 | 5.323220% |
| C | 14371 | 205 | 1.426484% |
| D | 14371 | 847 | 5.893814% |
Noise dominated data is calculated using 1-second bins in cleaned event files. If a bin has >2000 counts, and if more than 50% of those come from <1% of pixels, then it is considered to be noise-dominated and hence unusable.
| Quadrant | # 1 sec bins | Bins with >0 counts | Bins with >2000 counts | High rate bins dominated by noise | Noise dominated (total time) | Noise dominated (detector-on time) | Marked lightcurve |
|---|---|---|---|---|---|---|---|
| A | 18551 | 14370 | 6 | 6 | 0.03% | 0.04% | 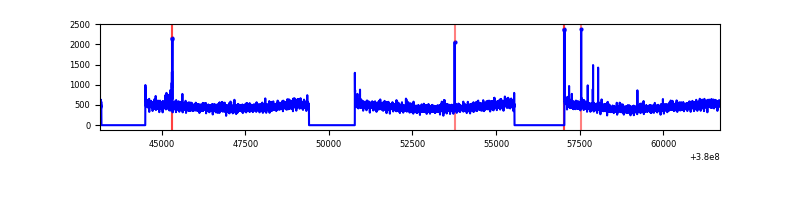 |
| B | 18551 | 14370 | 548 | 548 | 2.95% | 3.81% | 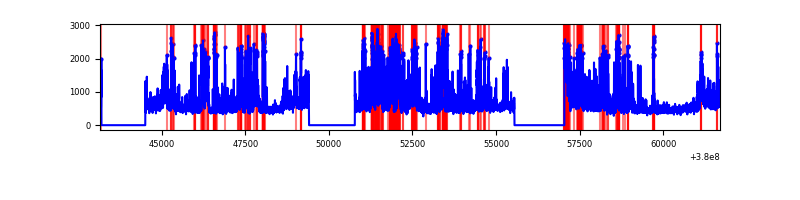 |
| C | 18551 | 14370 | 162 | 162 | 0.87% | 1.13% | 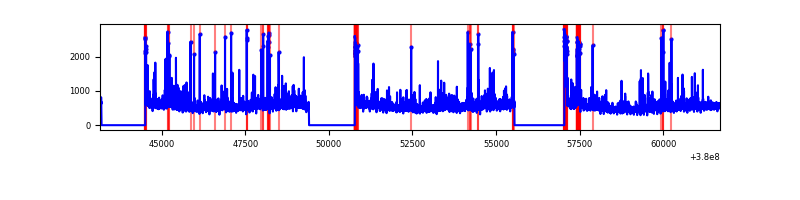 |
| D | 18551 | 14371 | 821 | 821 | 4.43% | 5.71% | 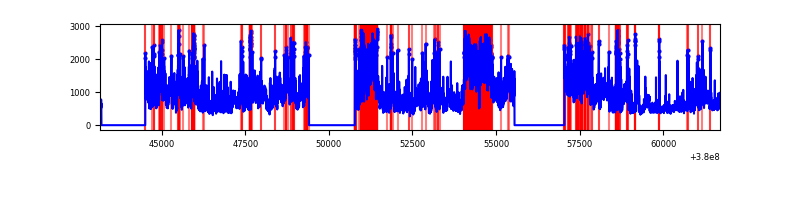 |
Top three noisy pixels from each quadrant. If the there are fewer than three noisy pixels in the level2.evt file, extra rows are filled as -1
| Pixel properties | Quadrant properties | ||||||
|---|---|---|---|---|---|---|---|
| Quadrant | DetID | PixID | Counts | Sigma | Mean | Median | Sigma |
| A | 15 | 169 | 50469 | 144.49 | 1673 | 1637 | 338.0 |
| A | 10 | 83 | 33220 | 93.45 | 1673 | 1637 | 338.0 |
| A | 13 | 254 | 25920 | 71.85 | 1673 | 1637 | 338.0 |
| B | 5 | 31 | 2477590 | 7861.56 | 1636 | 1595 | 314.9 |
| B | 5 | 172 | 1136607 | 3603.79 | 1636 | 1595 | 314.9 |
| B | 5 | 15 | 590496 | 1869.83 | 1636 | 1595 | 314.9 |
| C | 0 | 10 | 881718 | 2344.46 | 1621 | 1640 | 375.4 |
| C | 15 | 214 | 610565 | 1622.13 | 1621 | 1640 | 375.4 |
| C | 3 | 233 | 429692 | 1140.3 | 1621 | 1640 | 375.4 |
| D | 8 | 195 | 2939708 | 7559.04 | 1596 | 1553 | 388.7 |
| D | 1 | 52 | 981149 | 2520.22 | 1596 | 1553 | 388.7 |
| D | 3 | 13 | 940632 | 2415.99 | 1596 | 1553 | 388.7 |
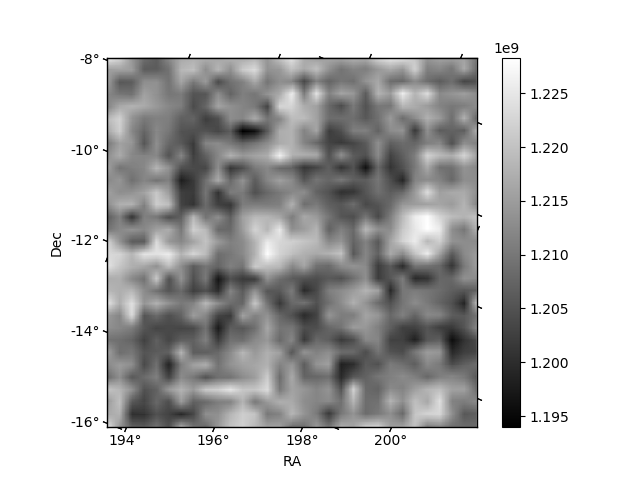
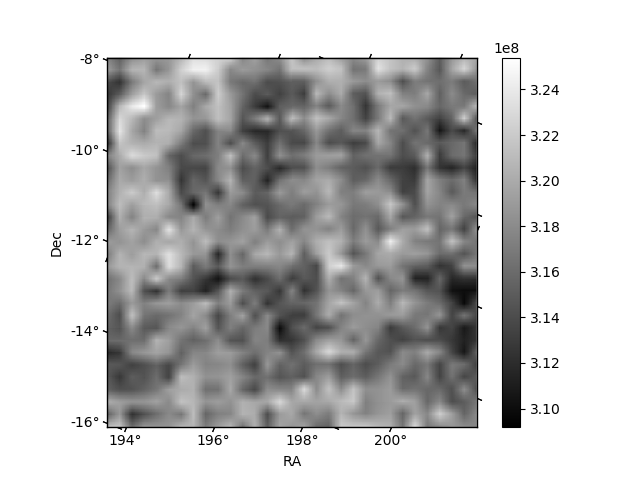
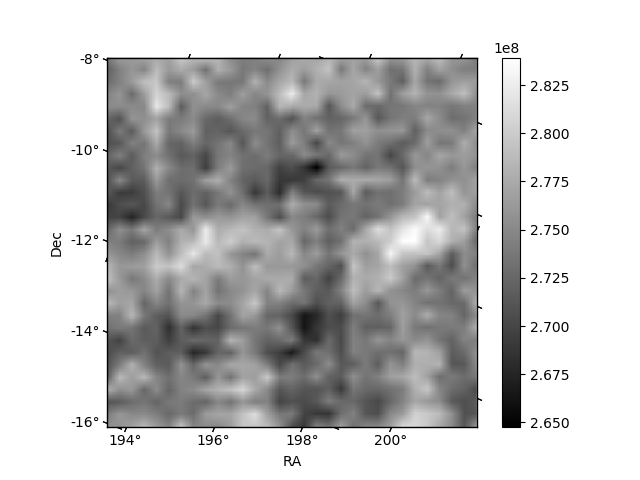
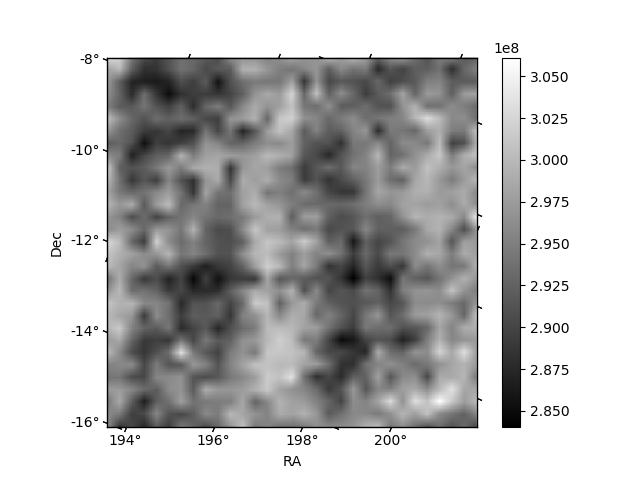
Histogram calculated using DETX and DETY for each event in the final _common_clean file
| Quadrant A |  |
 |
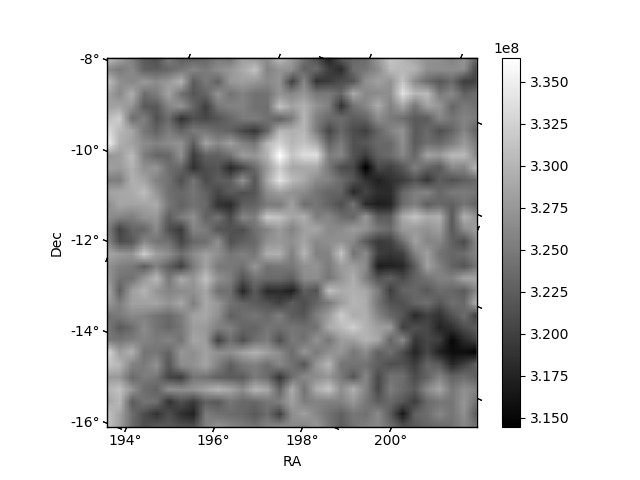
Quadrant B |
|---|---|---|---|
| Quadrant D |  |
 |
Quadrant C |
| Plot type | Count rate plots | Images |
|---|---|---|
| Comparison with Poisson distribution Blue bars denote a histogram of data divided into 1 sec bins. Red curve is a Poisson curve with rate = median count rate of data. |
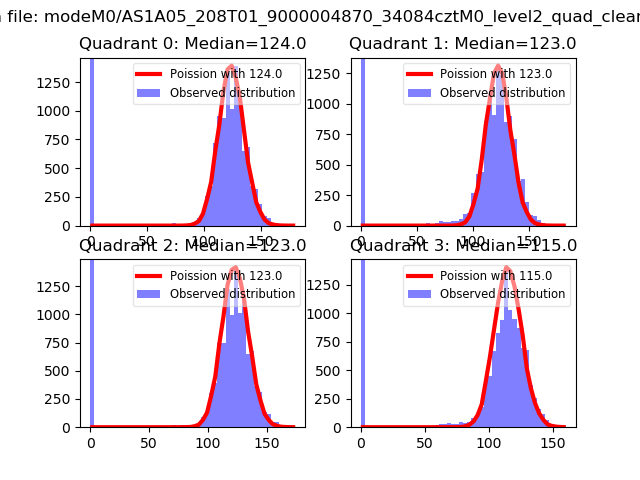 |
 |
| Quadrant-wise count rates Data is divided into 100 sec bins |
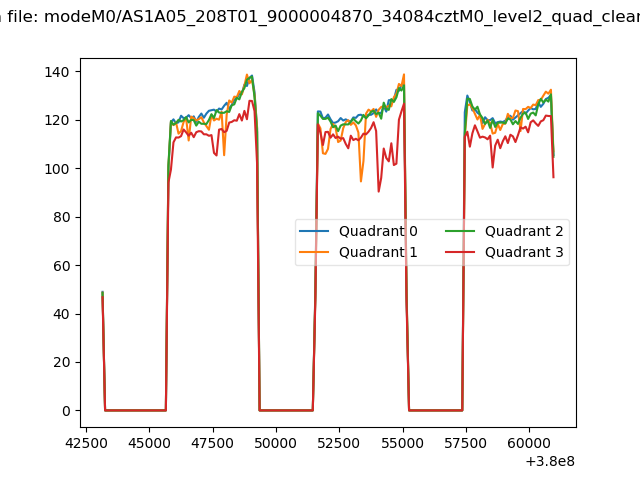 |
|
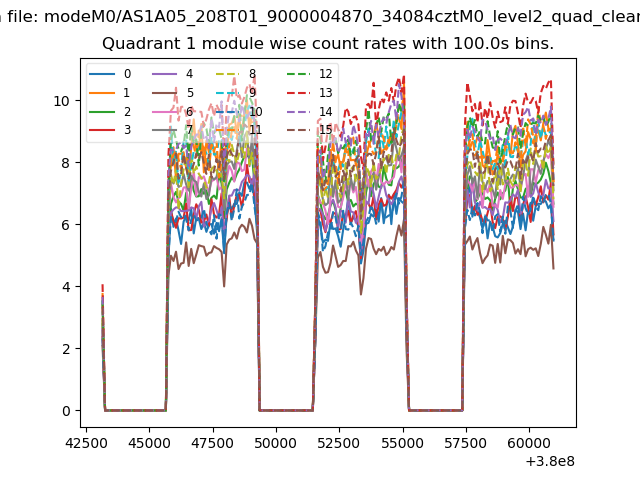
| Module-wise count rates for Quadrant A Data is divided into 100 sec bins |
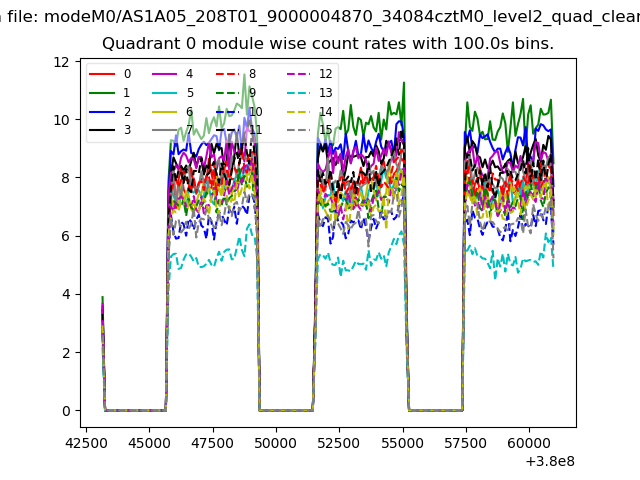 |
 |
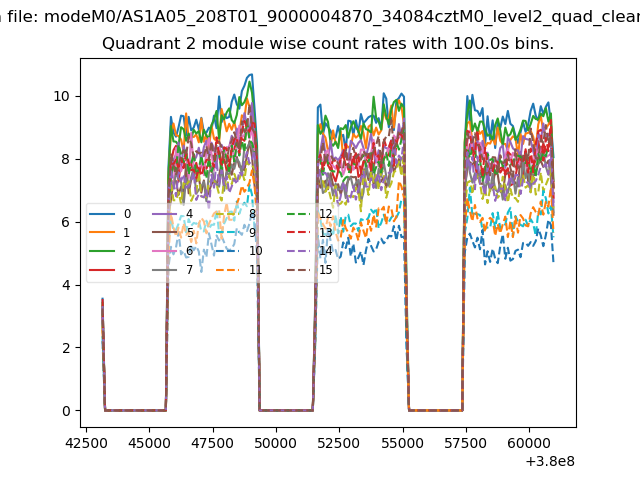
| Module-wise count rates for Quadrant B Data is divided into 100 sec bins |
 |
 |
| Module-wise count rates for Quadrant C Data is divided into 100 sec bins |
 |
 |
| Module-wise count rates for Quadrant D Data is divided into 100 sec bins |
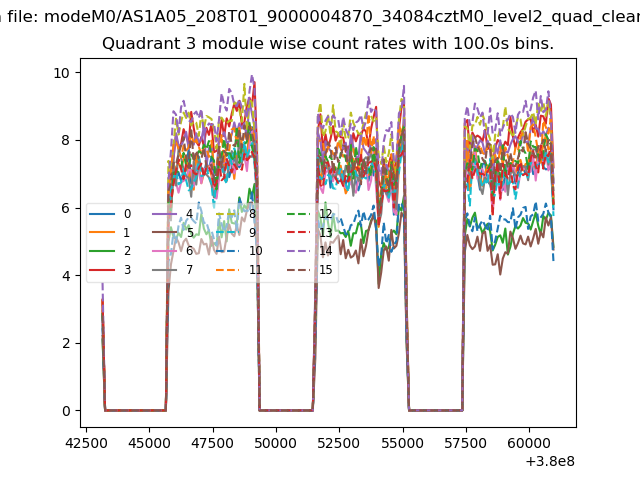 |
 |
| Parameter | Plot |
|---|---|
| CZT HV Monitor | 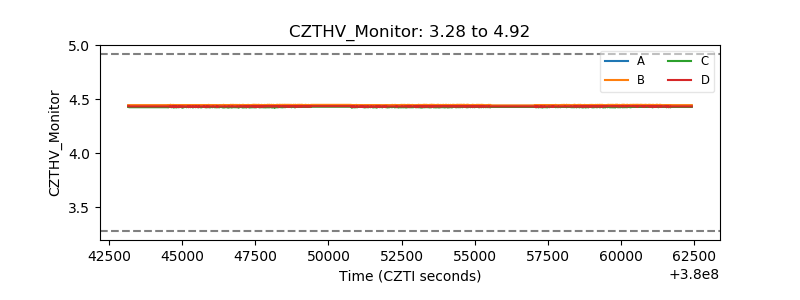 |
| D_VDD | 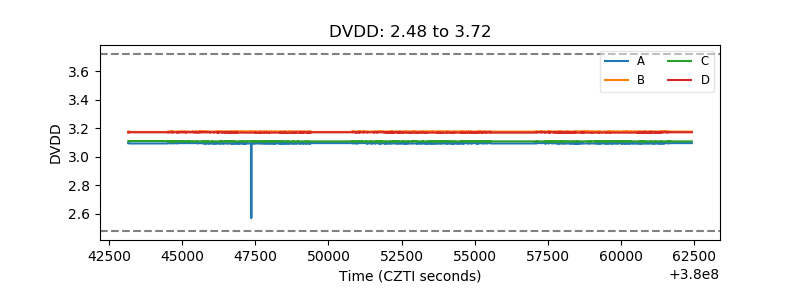 |
| Temperature 1 | 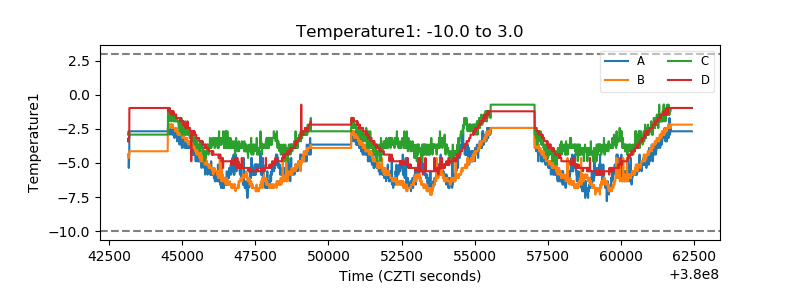 |
| Veto HV Monitor |  |
| Veto LLD | 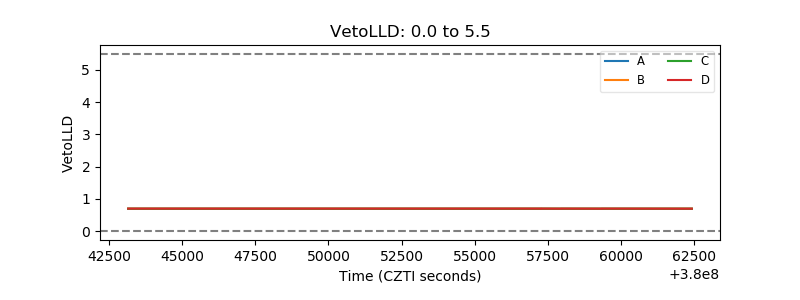 |
| Alpha Counter | 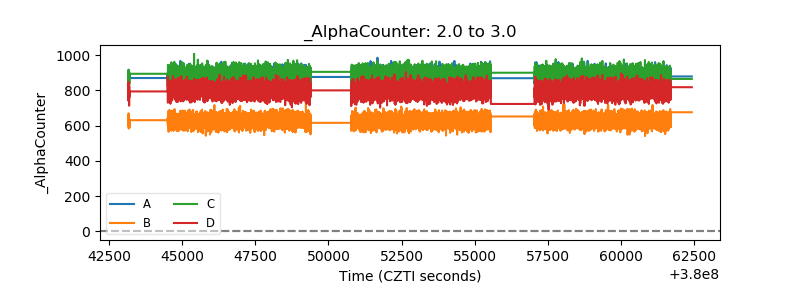 |
| _CPM_Rate | 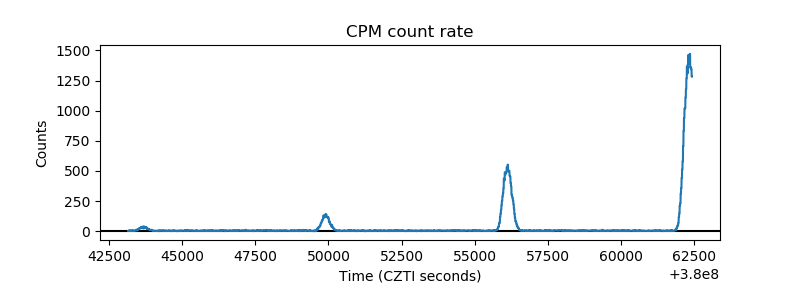 |
| CZT Counter | 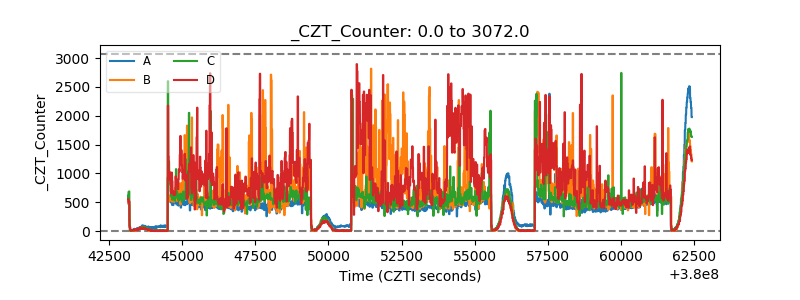 |
| +2.5 Volts monitor |  |
| +5 Volts monitor | 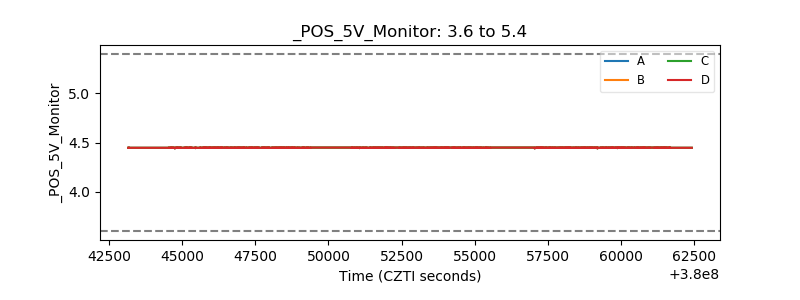 |
| _ROLL_ROT | 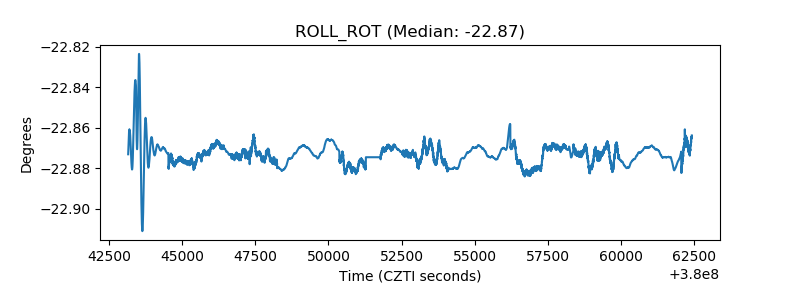 |
| _Roll_DEC | 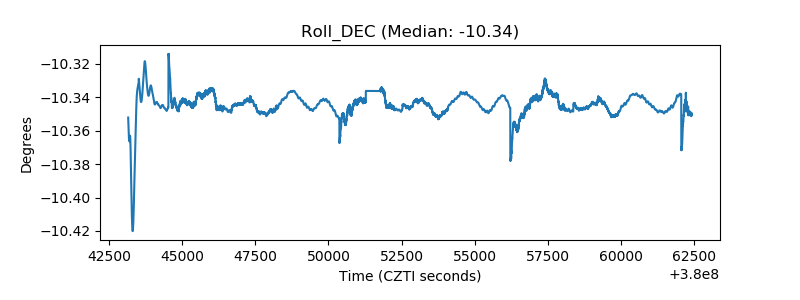 |
| _Roll_RA | 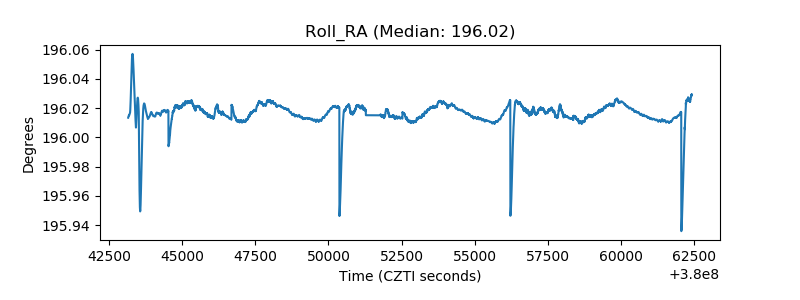 |
| Veto Counter | 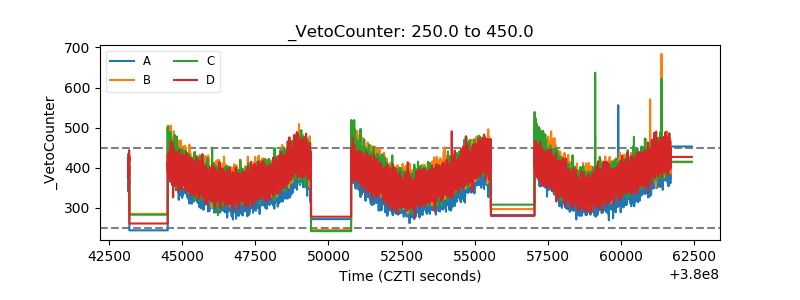 |