| Param | Original file | Final file |
|---|---|---|
| Filename | modeM0/AS1A05_208T01_9000004870_34086cztM0_level2.evt | modeM0/AS1A05_208T01_9000004870_34086cztM0_level2_quad_clean.evt |
| Size (bytes) | 574,882,560 | 90,673,920 |
| Size | 548.3 MB | 86.5 MB |
| Events in quadrant A | 2,932,740 | 594,810 |
| Events in quadrant B | 5,790,220 | 577,901 |
| Events in quadrant C | 3,492,843 | 588,238 |
| Events in quadrant D | 4,773,221 | 550,176 |
| Mode SS | |||
|---|---|---|---|
| Quadrant | BADHDUFLAG | Total packets | Discarded packets |
| A | 0 | 130 | 0 |
| B | 0 | 130 | 0 |
| C | 0 | 130 | 0 |
| D | 0 | 130 | 0 |
| Mode M9 | |||
|---|---|---|---|
| Quadrant | BADHDUFLAG | Total packets | Discarded packets |
| A | 0 | 33 | 0 |
| B | 0 | 33 | 0 |
| C | 0 | 33 | 0 |
| D | 0 | 33 | 0 |
| Mode M0 | |||
|---|---|---|---|
| Quadrant | BADHDUFLAG | Total packets | Discarded packets |
| A | 0 | 12654 | 3 |
| B | 0 | 21570 | 2 |
| C | 0 | 14028 | 2 |
| D | 0 | 18362 | 2 |
| Quadrant | Total seconds | Saturated seconds | Saturation percentage |
|---|---|---|---|
| A | 6218 | 8 | 0.128659% |
| B | 6218 | 627 | 10.083628% |
| C | 6218 | 71 | 1.141846% |
| D | 6218 | 237 | 3.811515% |
Noise dominated data is calculated using 1-second bins in cleaned event files. If a bin has >2000 counts, and if more than 50% of those come from <1% of pixels, then it is considered to be noise-dominated and hence unusable.
| Quadrant | # 1 sec bins | Bins with >0 counts | Bins with >2000 counts | High rate bins dominated by noise | Noise dominated (total time) | Noise dominated (detector-on time) | Marked lightcurve |
|---|---|---|---|---|---|---|---|
| A | 9565 | 6220 | 0 | 0 | 0.00% | 0.00% | 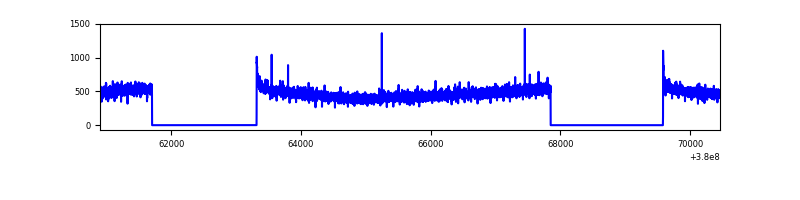 |
| B | 9565 | 6219 | 396 | 396 | 4.14% | 6.37% | 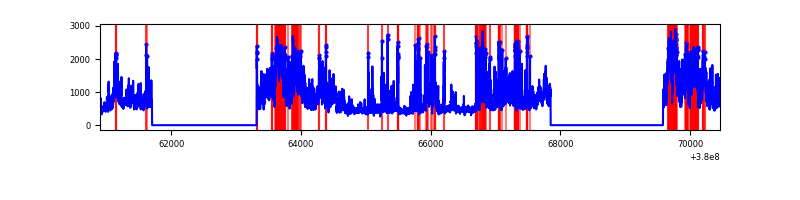 |
| C | 9565 | 6220 | 59 | 59 | 0.62% | 0.95% | 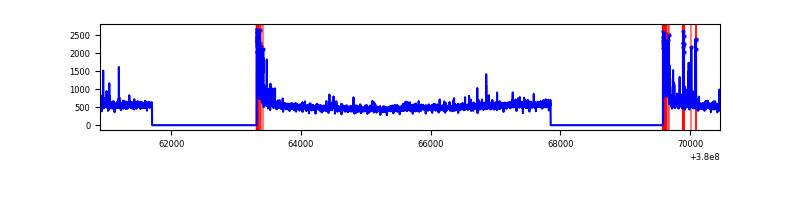 |
| D | 9565 | 6220 | 241 | 241 | 2.52% | 3.87% | 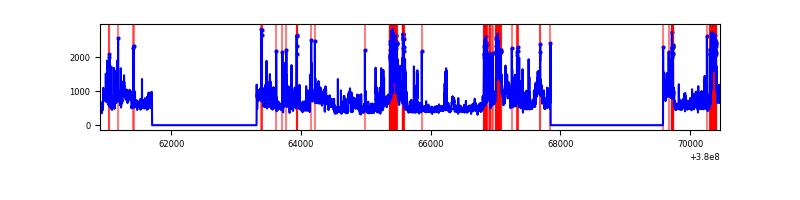 |
Top three noisy pixels from each quadrant. If the there are fewer than three noisy pixels in the level2.evt file, extra rows are filled as -1
| Pixel properties | Quadrant properties | ||||||
|---|---|---|---|---|---|---|---|
| Quadrant | DetID | PixID | Counts | Sigma | Mean | Median | Sigma |
| A | 10 | 83 | 19725 | 126.39 | 750 | 735 | 150.2 |
| A | 13 | 254 | 11052 | 68.67 | 750 | 735 | 150.2 |
| A | 13 | 6 | 10764 | 66.75 | 750 | 735 | 150.2 |
| B | 5 | 31 | 1448783 | 10218.39 | 729 | 709 | 141.7 |
| B | 5 | 172 | 660248 | 4654.06 | 729 | 709 | 141.7 |
| B | 5 | 15 | 493988 | 3480.84 | 729 | 709 | 141.7 |
| C | 0 | 10 | 292267 | 1735.53 | 729 | 738 | 168.0 |
| C | 15 | 214 | 269243 | 1598.47 | 729 | 738 | 168.0 |
| C | 3 | 233 | 33812 | 196.9 | 729 | 738 | 168.0 |
| D | 8 | 195 | 920854 | 5248.2 | 719 | 698 | 175.3 |
| D | 2 | 250 | 395727 | 2253.09 | 719 | 698 | 175.3 |
| D | 2 | 120 | 161672 | 918.13 | 719 | 698 | 175.3 |
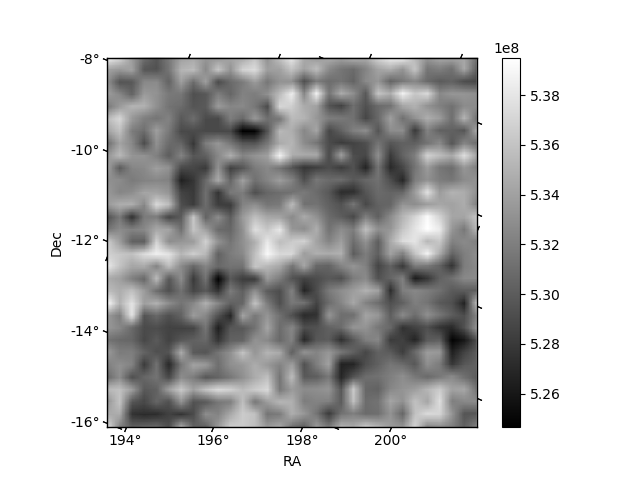
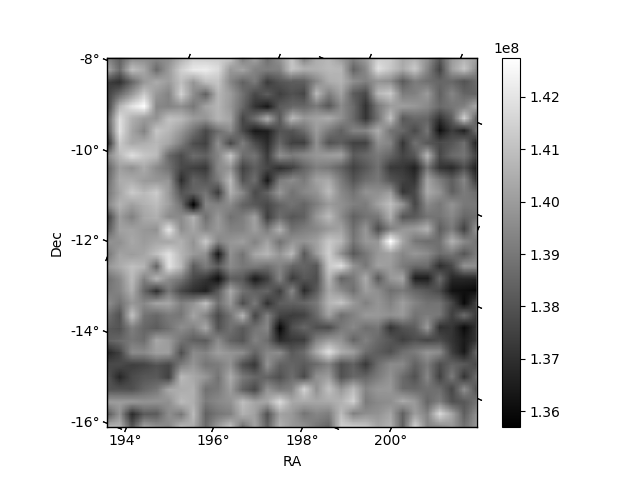
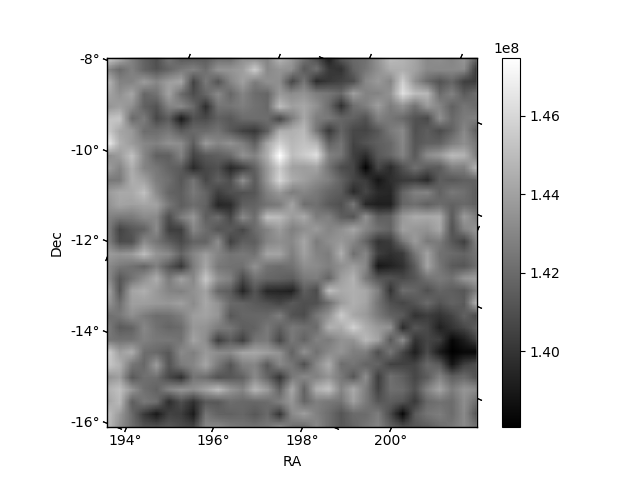
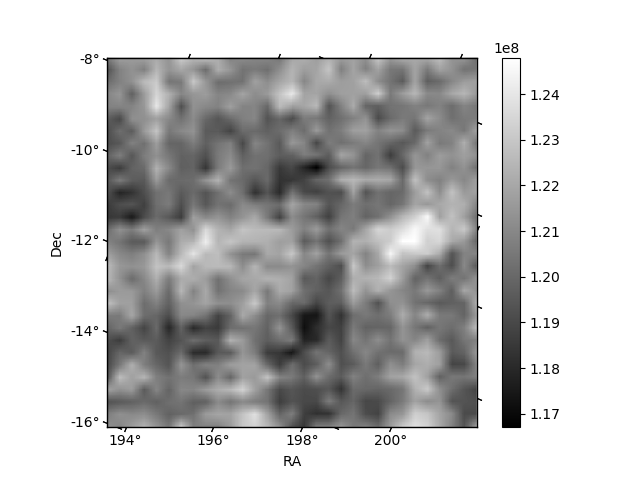
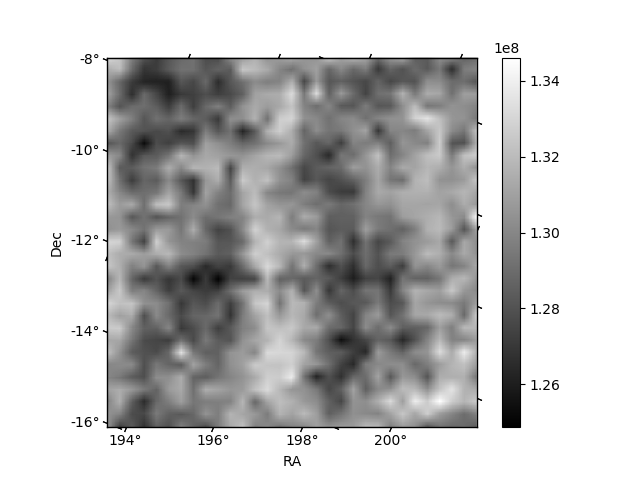
Histogram calculated using DETX and DETY for each event in the final _common_clean file
| Quadrant A | 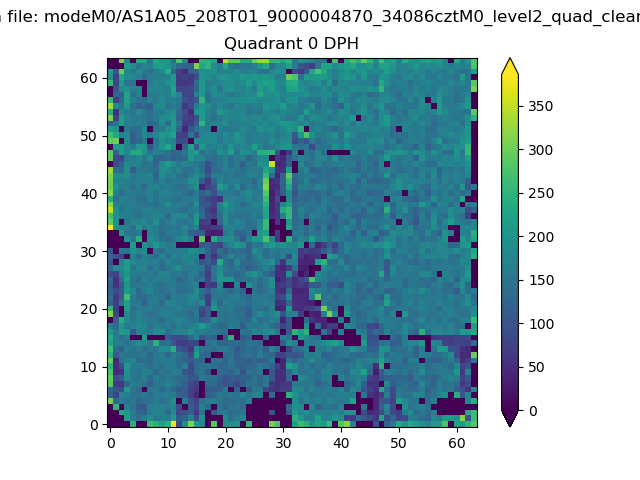 |
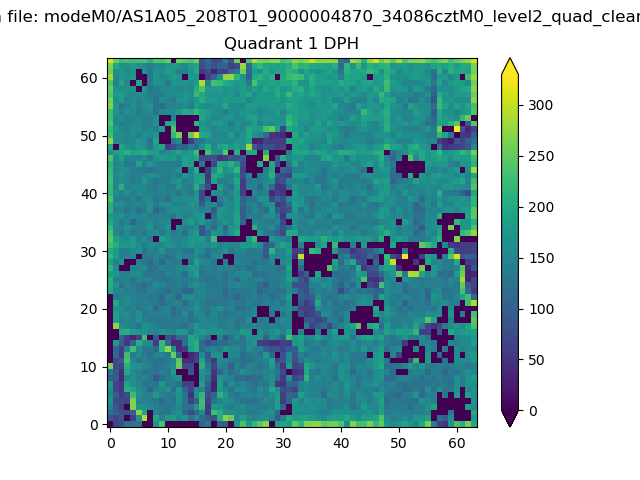 |
Quadrant B |
|---|---|---|---|
| Quadrant D | 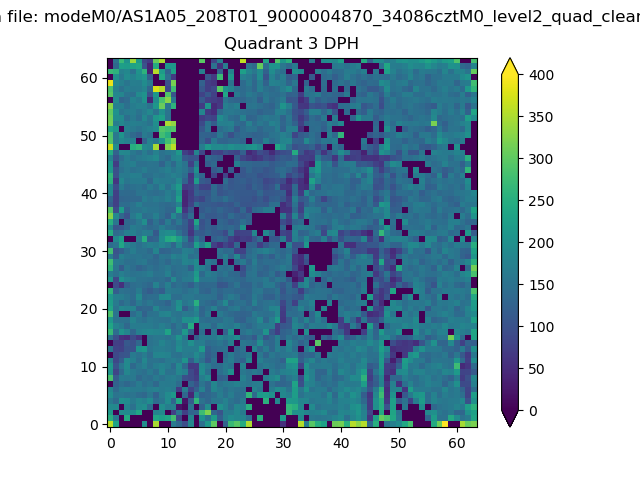 |
 |
Quadrant C |
| Plot type | Count rate plots | Images |
|---|---|---|
| Comparison with Poisson distribution Blue bars denote a histogram of data divided into 1 sec bins. Red curve is a Poisson curve with rate = median count rate of data. |
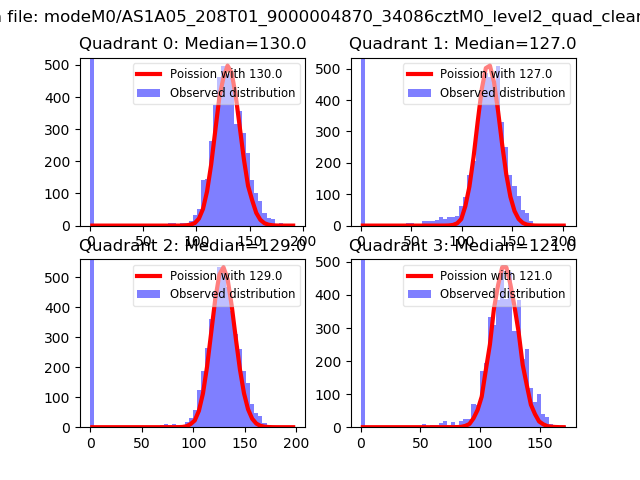 |
 |
| Quadrant-wise count rates Data is divided into 100 sec bins |
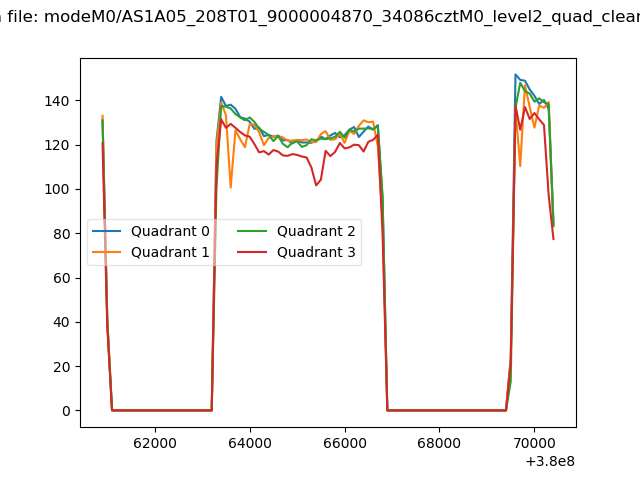 |
|
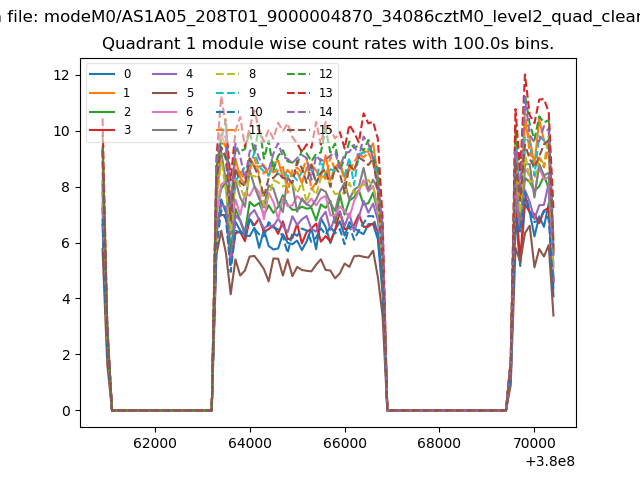
| Module-wise count rates for Quadrant A Data is divided into 100 sec bins |
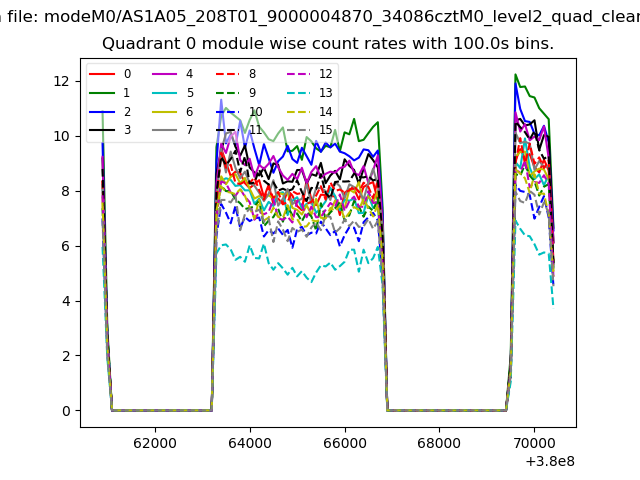 |
 |
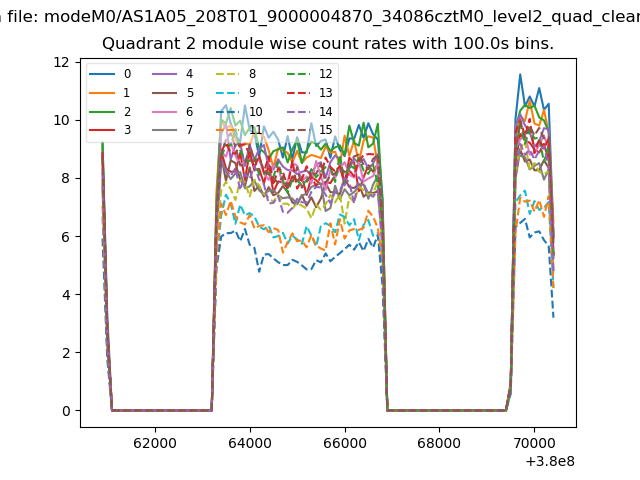
| Module-wise count rates for Quadrant B Data is divided into 100 sec bins |
 |
 |
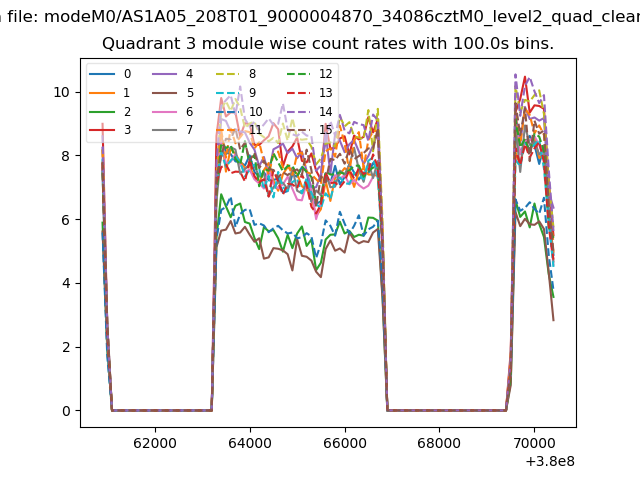
| Module-wise count rates for Quadrant C Data is divided into 100 sec bins |
 |
 |
| Module-wise count rates for Quadrant D Data is divided into 100 sec bins |
 |
 |
| Parameter | Plot |
|---|---|
| CZT HV Monitor | 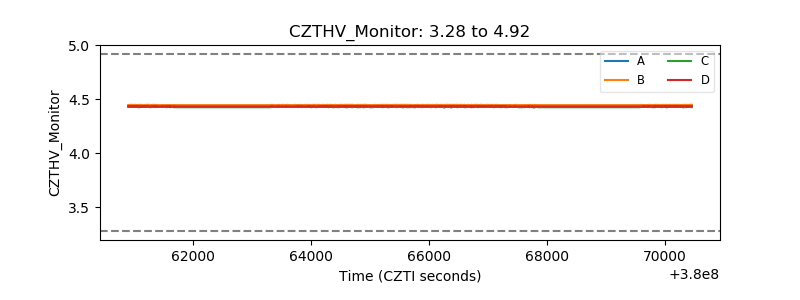 |
| D_VDD | 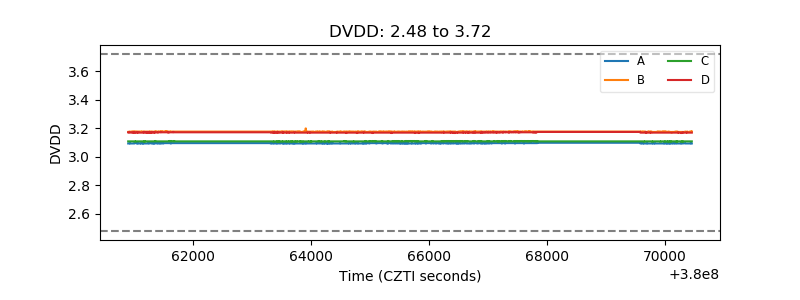 |
| Temperature 1 | 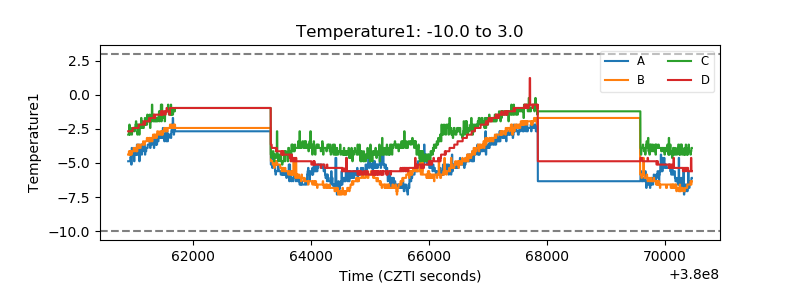 |
| Veto HV Monitor | 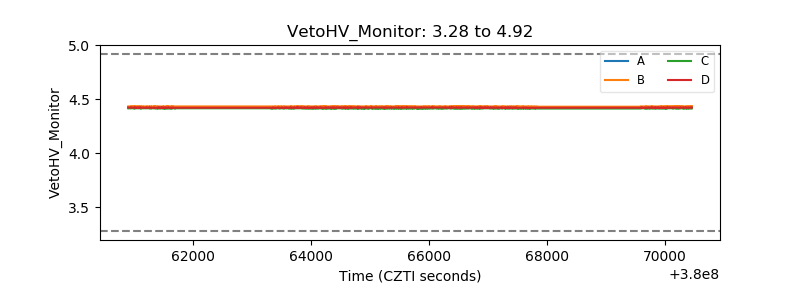 |
| Veto LLD | 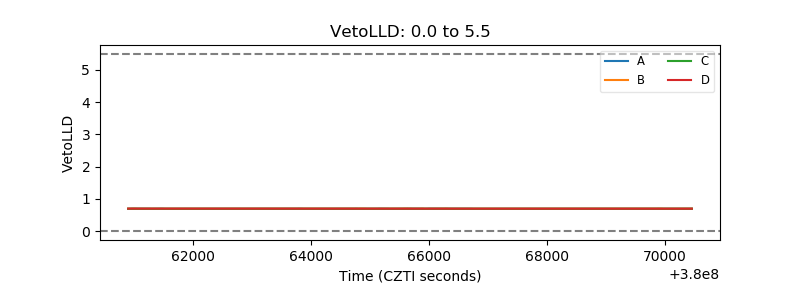 |
| Alpha Counter | 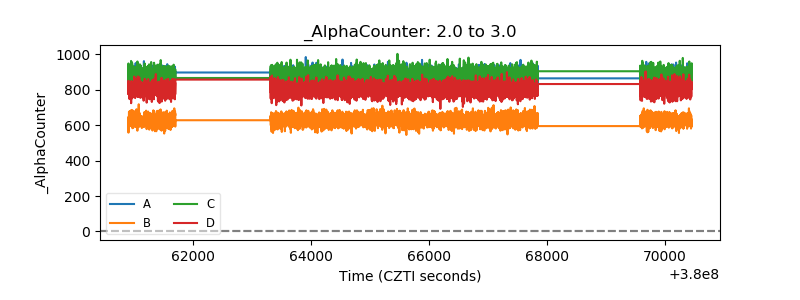 |
| _CPM_Rate | 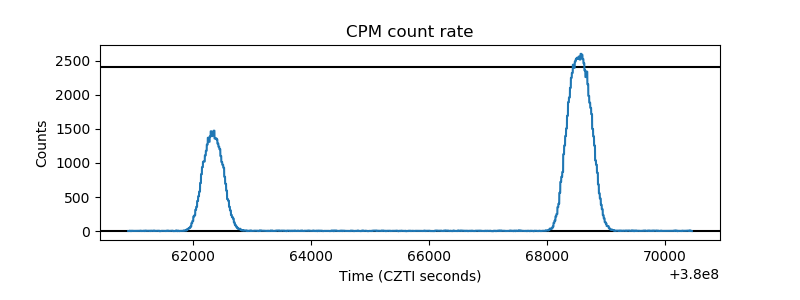 |
| CZT Counter |  |
| +2.5 Volts monitor |  |
| +5 Volts monitor | 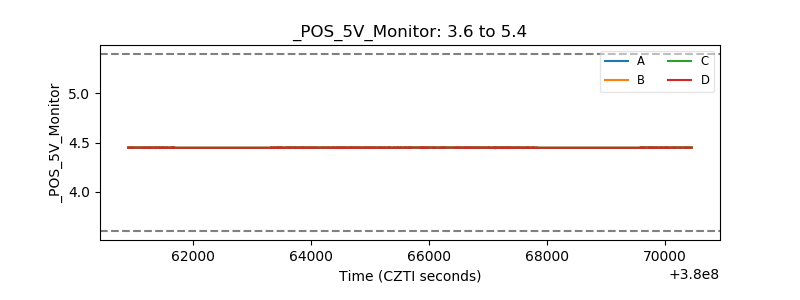 |
| _ROLL_ROT | 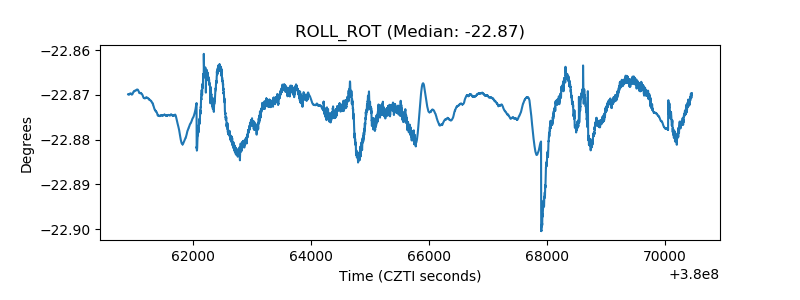 |
| _Roll_DEC | 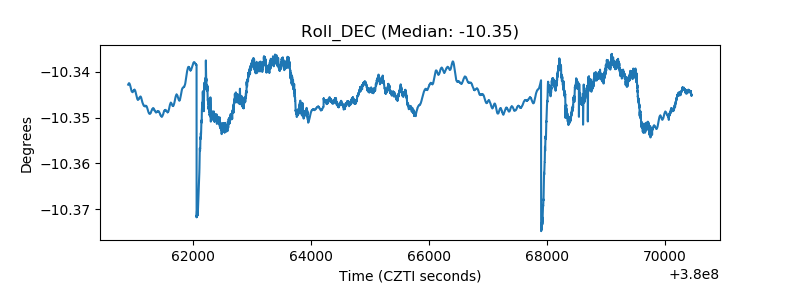 |
| _Roll_RA | 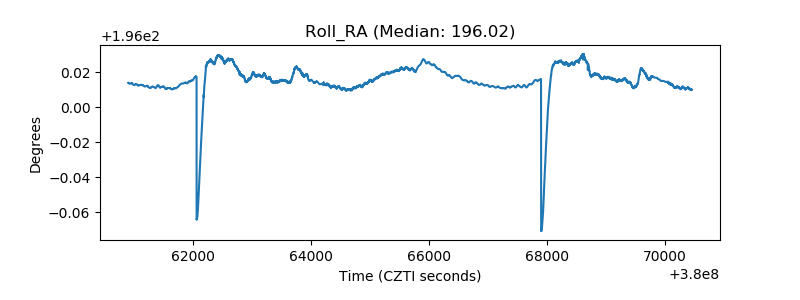 |
| Veto Counter | 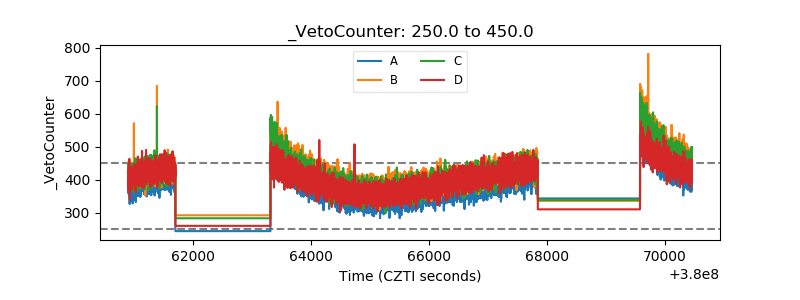 |