| Param | Original file | Final file |
|---|---|---|
| Filename | modeM0/AS1A05_208T01_9000004870_34087cztM0_level2.evt | modeM0/AS1A05_208T01_9000004870_34087cztM0_level2_quad_clean.evt |
| Size (bytes) | 519,013,440 | 89,956,800 |
| Size | 495.0 MB | 85.8 MB |
| Events in quadrant A | 2,648,169 | 598,172 |
| Events in quadrant B | 4,950,396 | 590,485 |
| Events in quadrant C | 3,289,893 | 590,973 |
| Events in quadrant D | 4,450,790 | 552,811 |
| Mode SS | |||
|---|---|---|---|
| Quadrant | BADHDUFLAG | Total packets | Discarded packets |
| A | 0 | 114 | 0 |
| B | 0 | 114 | 0 |
| C | 0 | 114 | 0 |
| D | 0 | 114 | 0 |
| Mode M9 | |||
|---|---|---|---|
| Quadrant | BADHDUFLAG | Total packets | Discarded packets |
| A | 0 | 28 | 0 |
| B | 0 | 28 | 0 |
| C | 0 | 28 | 0 |
| D | 0 | 29 | 0 |
| Mode M0 | |||
|---|---|---|---|
| Quadrant | BADHDUFLAG | Total packets | Discarded packets |
| A | 0 | 11384 | 3 |
| B | 0 | 18426 | 2 |
| C | 0 | 13015 | 2 |
| D | 0 | 17073 | 2 |
| Quadrant | Total seconds | Saturated seconds | Saturation percentage |
|---|---|---|---|
| A | 5599 | 7 | 0.125022% |
| B | 5599 | 464 | 8.287194% |
| C | 5599 | 94 | 1.678871% |
| D | 5599 | 147 | 2.625469% |
Noise dominated data is calculated using 1-second bins in cleaned event files. If a bin has >2000 counts, and if more than 50% of those come from <1% of pixels, then it is considered to be noise-dominated and hence unusable.
| Quadrant | # 1 sec bins | Bins with >0 counts | Bins with >2000 counts | High rate bins dominated by noise | Noise dominated (total time) | Noise dominated (detector-on time) | Marked lightcurve |
|---|---|---|---|---|---|---|---|
| A | 7481 | 5600 | 0 | 0 | 0.00% | 0.00% | 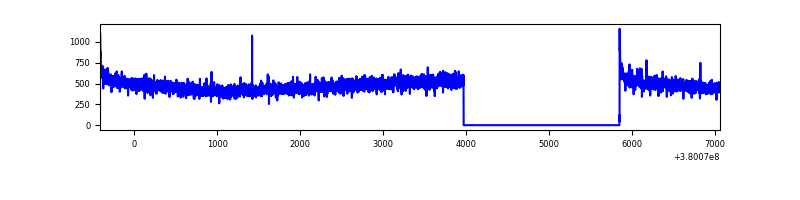 |
| B | 7481 | 5600 | 319 | 319 | 4.26% | 5.70% | 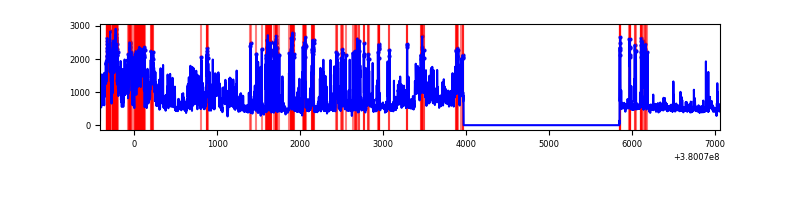 |
| C | 7481 | 5600 | 78 | 78 | 1.04% | 1.39% | 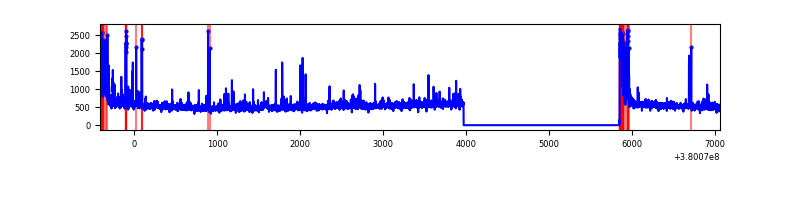 |
| D | 7481 | 5600 | 145 | 145 | 1.94% | 2.59% | 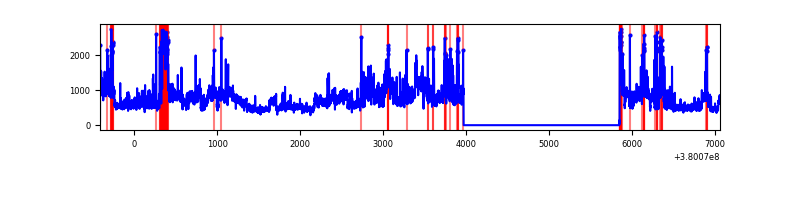 |
Top three noisy pixels from each quadrant. If the there are fewer than three noisy pixels in the level2.evt file, extra rows are filled as -1
| Pixel properties | Quadrant properties | ||||||
|---|---|---|---|---|---|---|---|
| Quadrant | DetID | PixID | Counts | Sigma | Mean | Median | Sigma |
| A | 10 | 83 | 19175 | 135.88 | 678 | 665 | 136.2 |
| A | 13 | 6 | 10324 | 70.91 | 678 | 665 | 136.2 |
| A | 13 | 254 | 9384 | 64.01 | 678 | 665 | 136.2 |
| B | 5 | 172 | 1008411 | 7986.64 | 663 | 649 | 126.2 |
| B | 5 | 31 | 804364 | 6369.55 | 663 | 649 | 126.2 |
| B | 5 | 15 | 275576 | 2178.83 | 663 | 649 | 126.2 |
| C | 0 | 10 | 403329 | 2641.78 | 661 | 667 | 152.4 |
| C | 15 | 214 | 244970 | 1602.82 | 661 | 667 | 152.4 |
| C | 14 | 67 | 27280 | 174.6 | 661 | 667 | 152.4 |
| D | 8 | 195 | 988648 | 6193.76 | 650 | 633 | 159.5 |
| D | 7 | 223 | 269372 | 1684.7 | 650 | 633 | 159.5 |
| D | 2 | 250 | 175657 | 1097.21 | 650 | 633 | 159.5 |
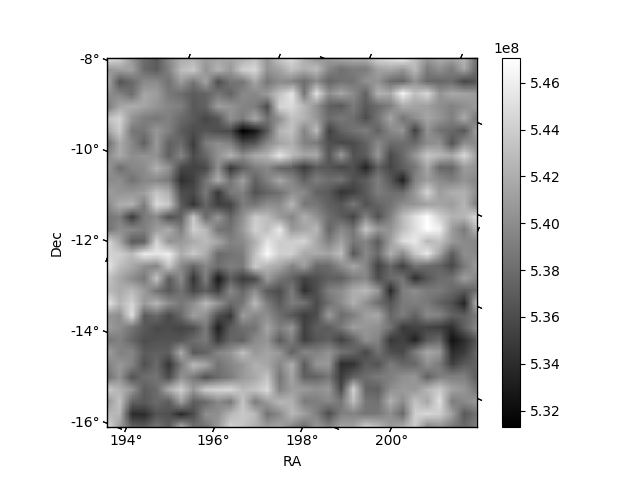
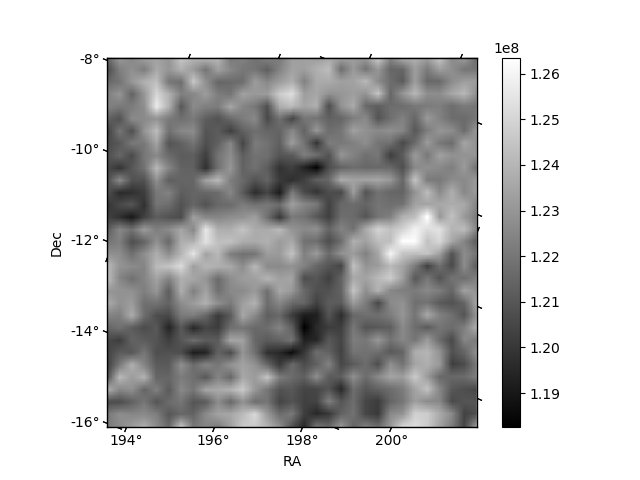
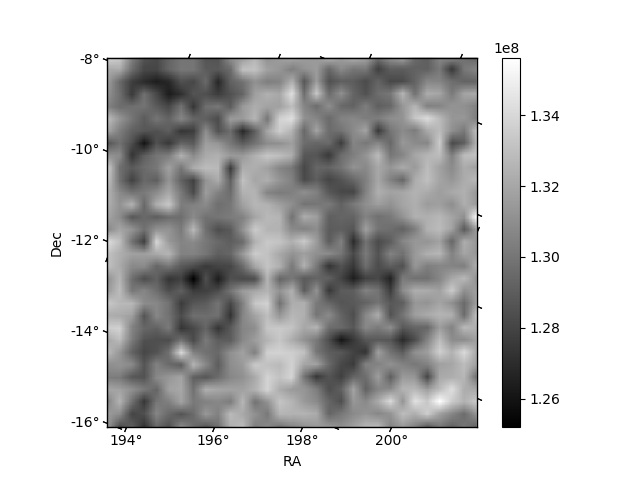
Histogram calculated using DETX and DETY for each event in the final _common_clean file
| Quadrant A | 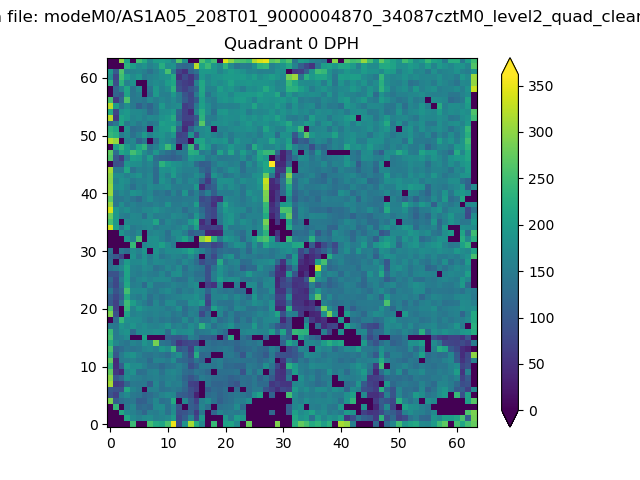 |
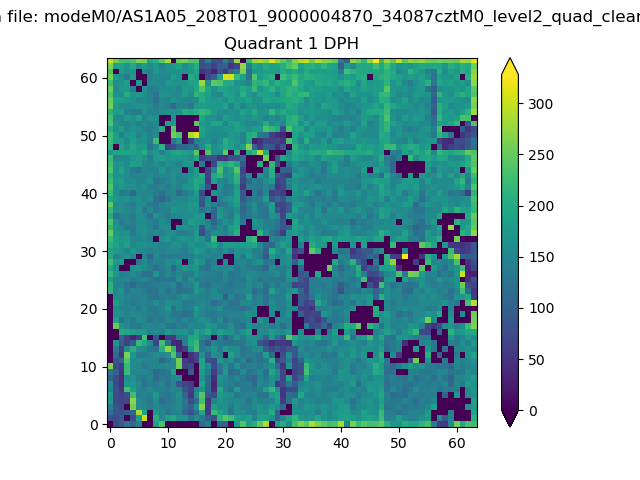 |
Quadrant B |
|---|---|---|---|
| Quadrant D | 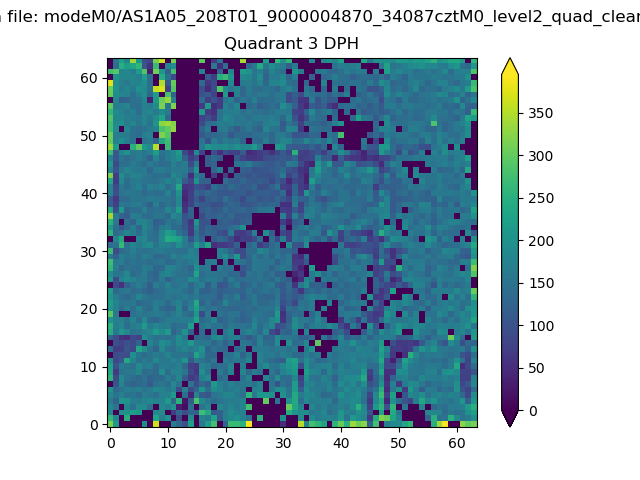 |
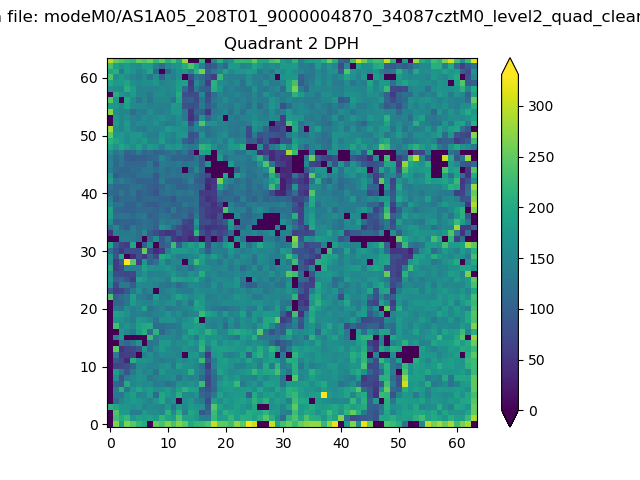 |
Quadrant C |
| Plot type | Count rate plots | Images |
|---|---|---|
| Comparison with Poisson distribution Blue bars denote a histogram of data divided into 1 sec bins. Red curve is a Poisson curve with rate = median count rate of data. |
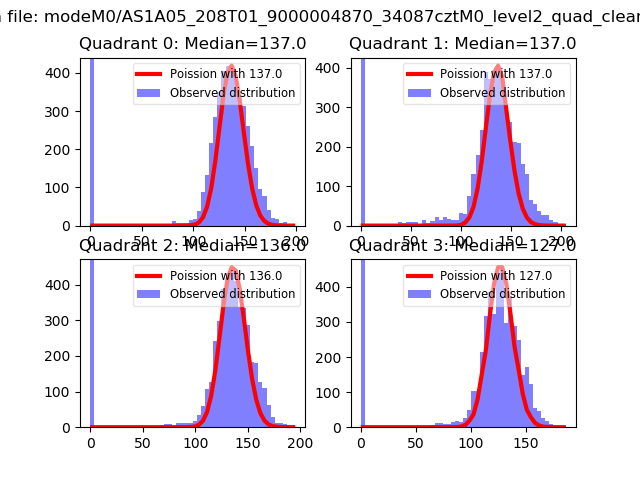 |
 |
| Quadrant-wise count rates Data is divided into 100 sec bins |
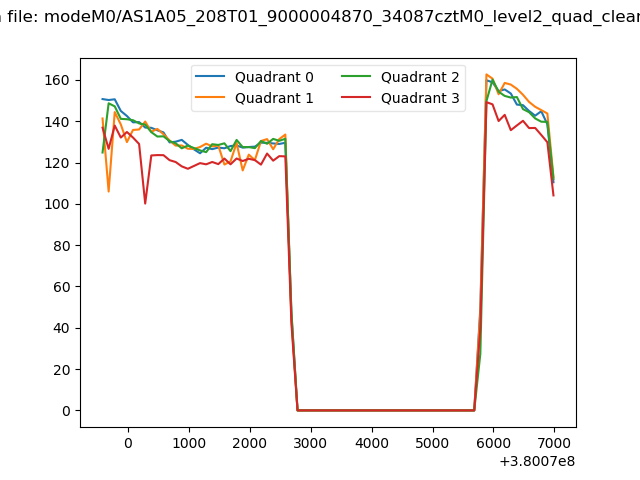 |
|
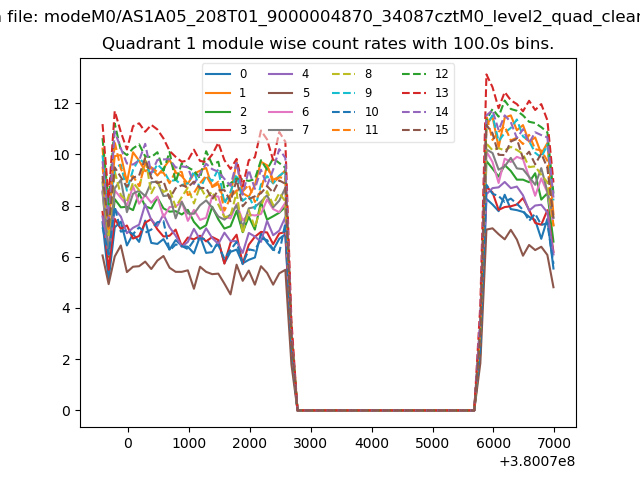
| Module-wise count rates for Quadrant A Data is divided into 100 sec bins |
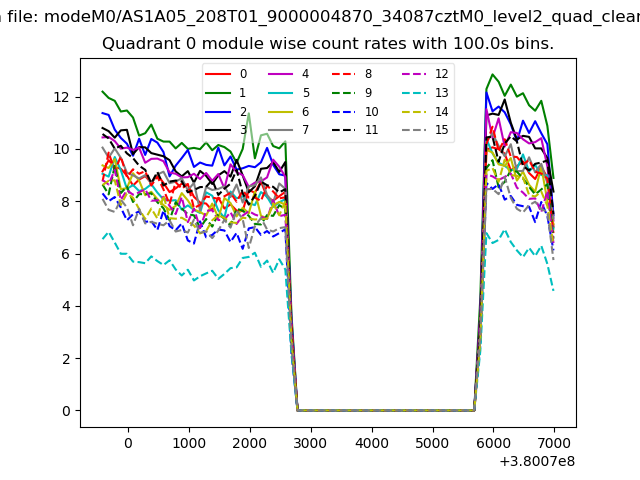 |
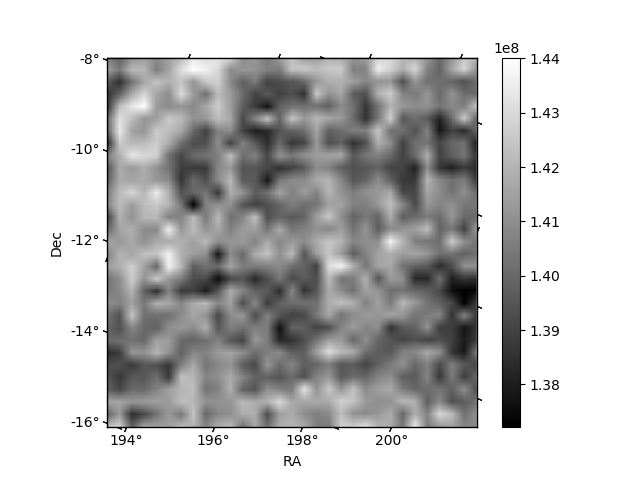 |
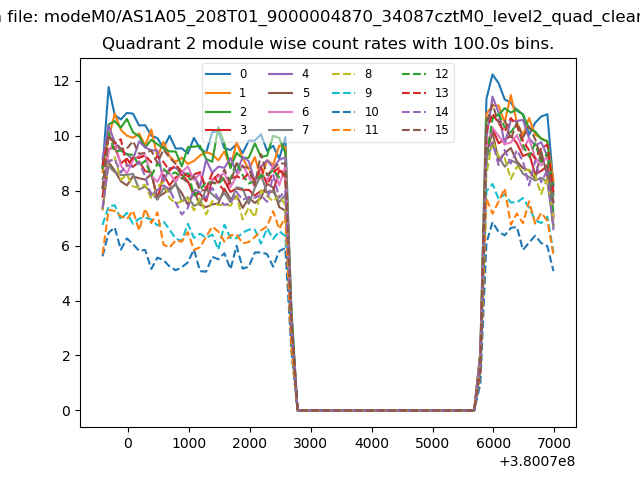
| Module-wise count rates for Quadrant B Data is divided into 100 sec bins |
 |
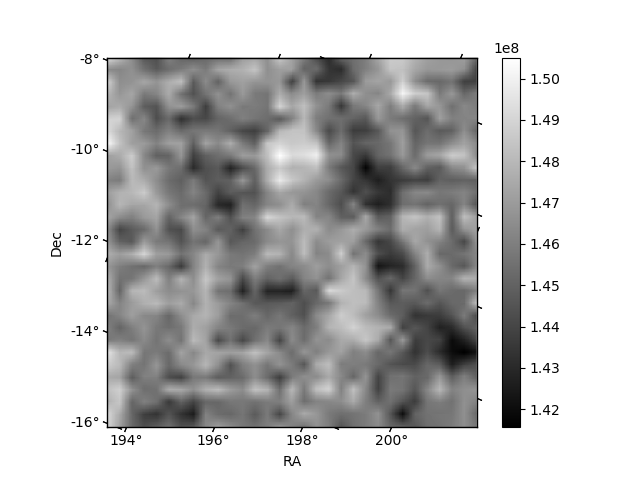 |
| Module-wise count rates for Quadrant C Data is divided into 100 sec bins |
 |
 |
| Module-wise count rates for Quadrant D Data is divided into 100 sec bins |
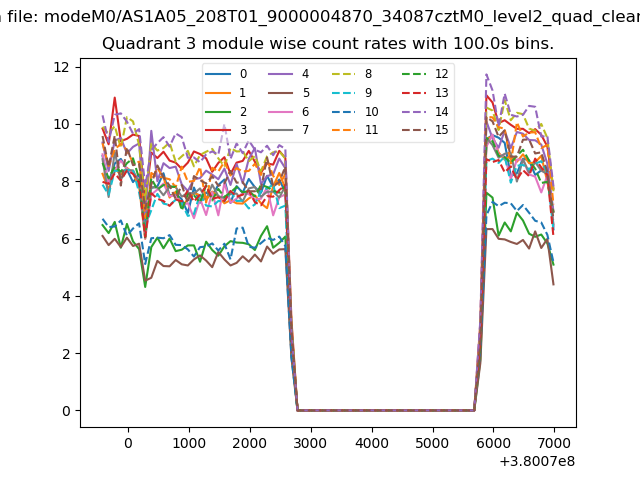 |
 |
| Parameter | Plot |
|---|---|
| CZT HV Monitor | 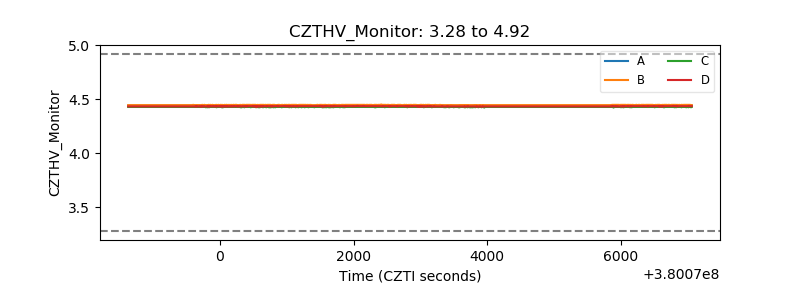 |
| D_VDD | 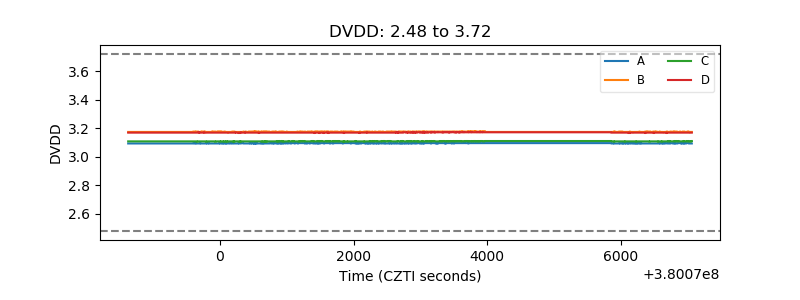 |
| Temperature 1 | 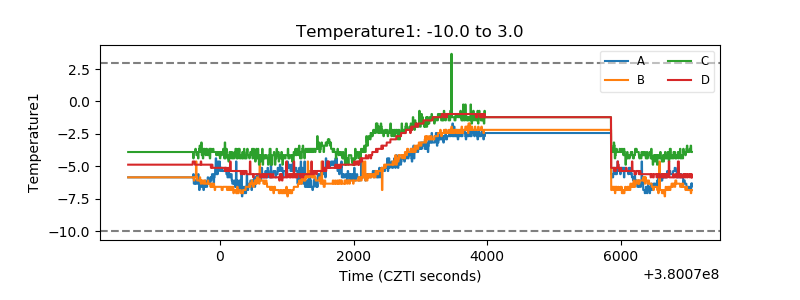 |
| Veto HV Monitor | 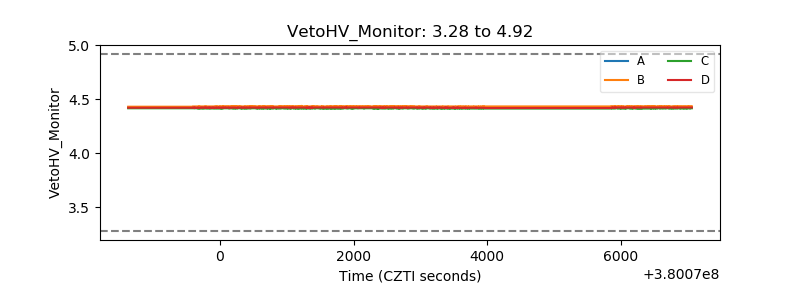 |
| Veto LLD | 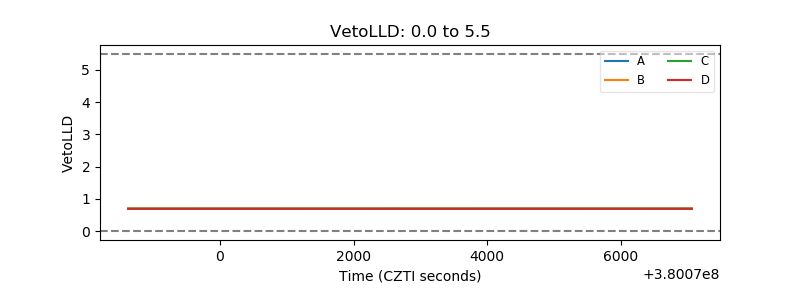 |
| Alpha Counter | 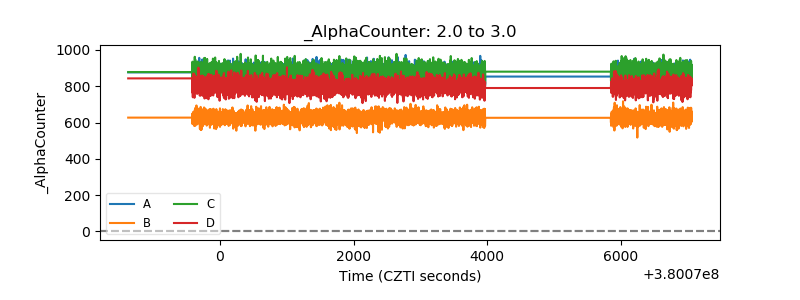 |
| _CPM_Rate | 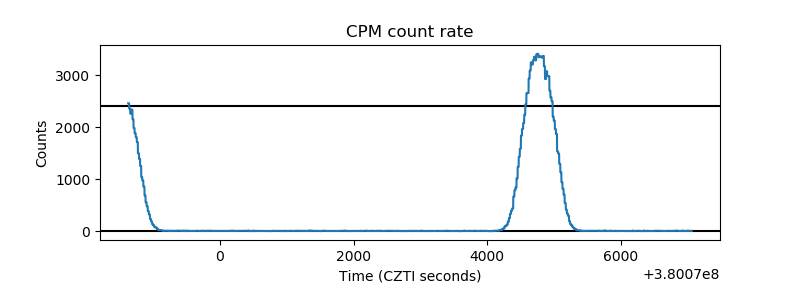 |
| CZT Counter | 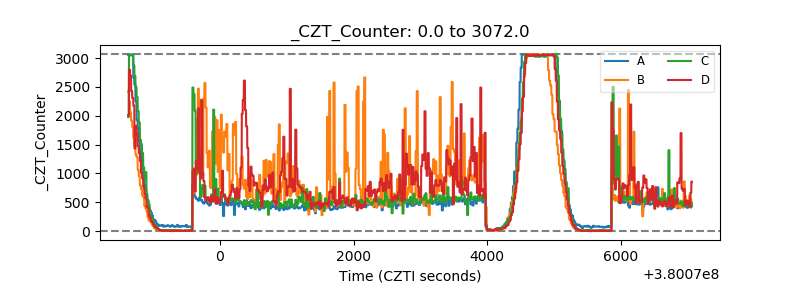 |
| +2.5 Volts monitor | 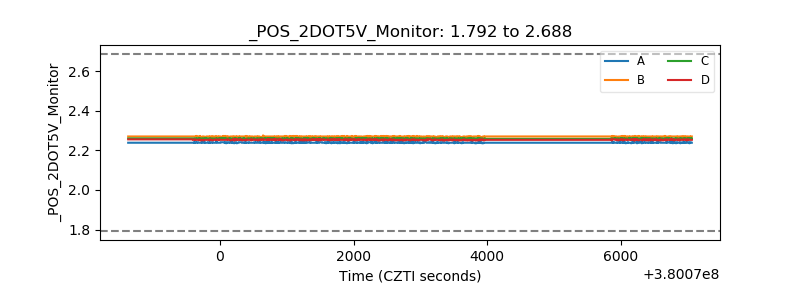 |
| +5 Volts monitor |  |
| _ROLL_ROT | 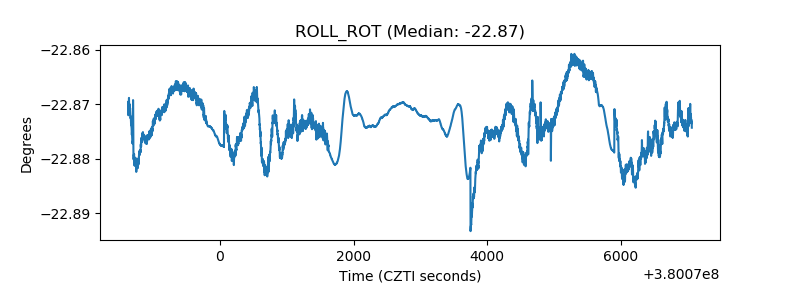 |
| _Roll_DEC | 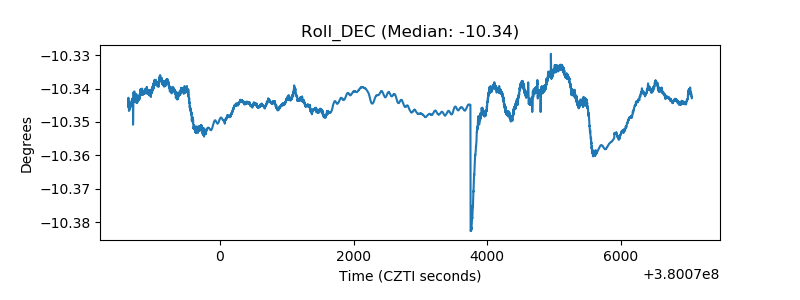 |
| _Roll_RA | 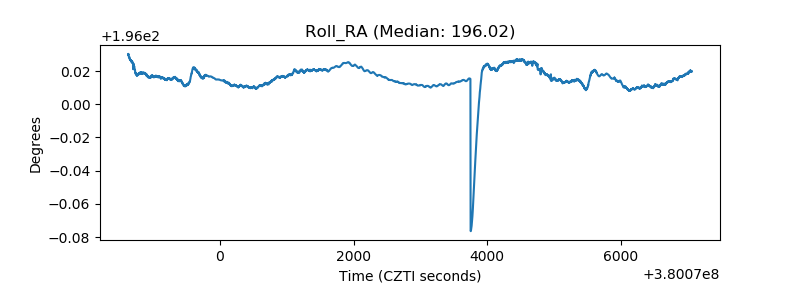 |
| Veto Counter | 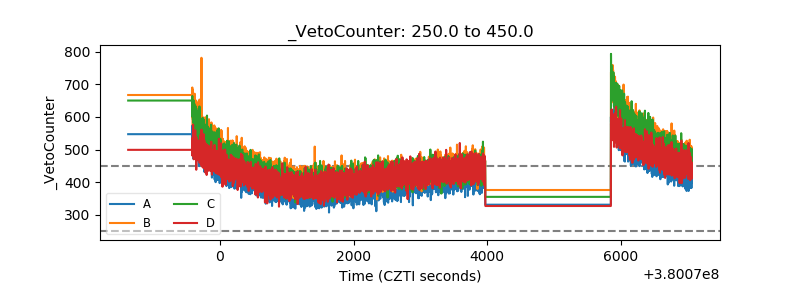 |