| Param | Original file | Final file |
|---|---|---|
| Filename | modeM0/AS1A05_208T01_9000004870_34088cztM0_level2.evt | modeM0/AS1A05_208T01_9000004870_34088cztM0_level2_quad_clean.evt |
| Size (bytes) | 473,235,840 | 83,759,040 |
| Size | 451.3 MB | 79.9 MB |
| Events in quadrant A | 2,600,221 | 551,571 |
| Events in quadrant B | 4,177,888 | 559,802 |
| Events in quadrant C | 3,363,566 | 539,522 |
| Events in quadrant D | 3,828,635 | 512,098 |
| Mode SS | |||
|---|---|---|---|
| Quadrant | BADHDUFLAG | Total packets | Discarded packets |
| A | 0 | 106 | 0 |
| B | 0 | 106 | 0 |
| C | 0 | 106 | 0 |
| D | 0 | 106 | 0 |
| Mode M9 | |||
|---|---|---|---|
| Quadrant | BADHDUFLAG | Total packets | Discarded packets |
| A | 0 | 34 | 0 |
| B | 0 | 34 | 0 |
| C | 0 | 34 | 0 |
| D | 0 | 35 | 0 |
| Mode M0 | |||
|---|---|---|---|
| Quadrant | BADHDUFLAG | Total packets | Discarded packets |
| A | 0 | 10904 | 2 |
| B | 0 | 15921 | 1 |
| C | 0 | 13101 | 1 |
| D | 0 | 14934 | 1 |
| Quadrant | Total seconds | Saturated seconds | Saturation percentage |
|---|---|---|---|
| A | 5343 | 9 | 0.168445% |
| B | 5343 | 314 | 5.876848% |
| C | 5343 | 156 | 2.919708% |
| D | 5343 | 92 | 1.721879% |
Noise dominated data is calculated using 1-second bins in cleaned event files. If a bin has >2000 counts, and if more than 50% of those come from <1% of pixels, then it is considered to be noise-dominated and hence unusable.
| Quadrant | # 1 sec bins | Bins with >0 counts | Bins with >2000 counts | High rate bins dominated by noise | Noise dominated (total time) | Noise dominated (detector-on time) | Marked lightcurve |
|---|---|---|---|---|---|---|---|
| A | 7346 | 5344 | 0 | 0 | 0.00% | 0.00% | 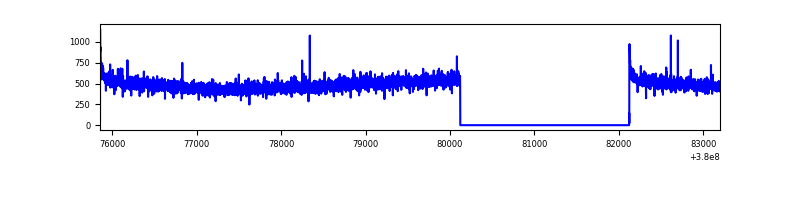 |
| B | 7346 | 5344 | 161 | 161 | 2.19% | 3.01% | 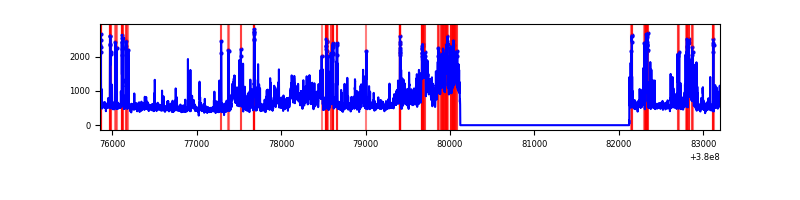 |
| C | 7346 | 5344 | 129 | 129 | 1.76% | 2.41% | 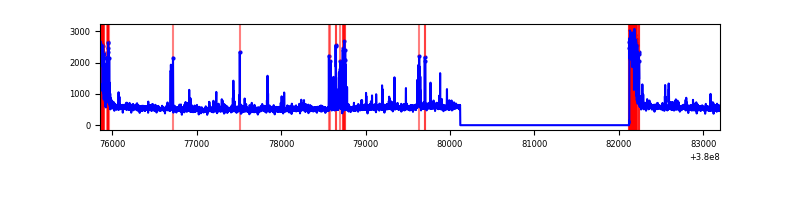 |
| D | 7346 | 5344 | 95 | 95 | 1.29% | 1.78% | 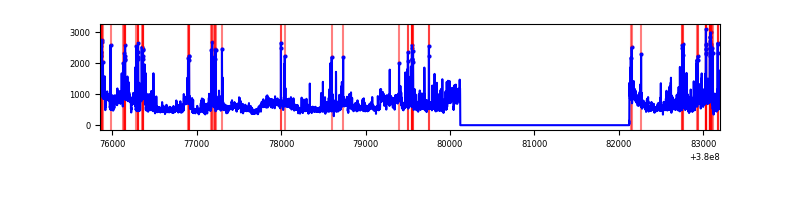 |
Top three noisy pixels from each quadrant. If the there are fewer than three noisy pixels in the level2.evt file, extra rows are filled as -1
| Pixel properties | Quadrant properties | ||||||
|---|---|---|---|---|---|---|---|
| Quadrant | DetID | PixID | Counts | Sigma | Mean | Median | Sigma |
| A | 10 | 83 | 19109 | 138.26 | 668 | 658 | 133.4 |
| A | 13 | 254 | 8242 | 56.83 | 668 | 658 | 133.4 |
| A | 3 | 137 | 6257 | 41.96 | 668 | 658 | 133.4 |
| B | 5 | 31 | 601322 | 4849.11 | 659 | 641 | 123.9 |
| B | 5 | 172 | 596153 | 4807.39 | 659 | 641 | 123.9 |
| B | 5 | 15 | 225916 | 1818.58 | 659 | 641 | 123.9 |
| C | 0 | 10 | 551878 | 3705.6 | 647 | 655 | 148.8 |
| C | 15 | 214 | 232124 | 1556.05 | 647 | 655 | 148.8 |
| C | 14 | 67 | 28104 | 184.53 | 647 | 655 | 148.8 |
| D | 8 | 195 | 702472 | 4436.62 | 643 | 627 | 158.2 |
| D | 2 | 250 | 311637 | 1966.01 | 643 | 627 | 158.2 |
| D | 13 | 249 | 90300 | 566.85 | 643 | 627 | 158.2 |
Histogram calculated using DETX and DETY for each event in the final _common_clean file
| Quadrant A | 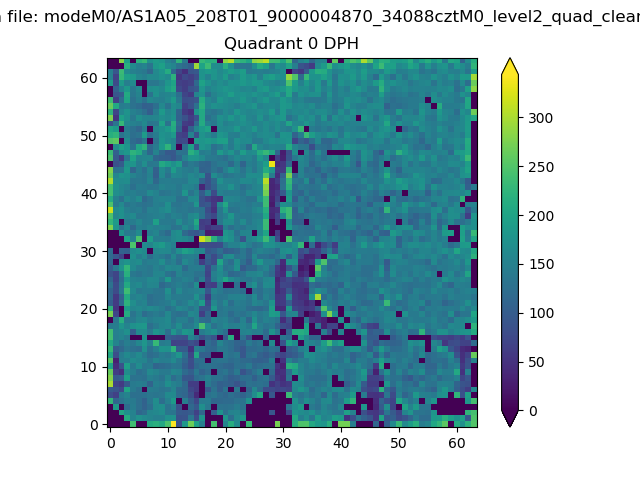 |
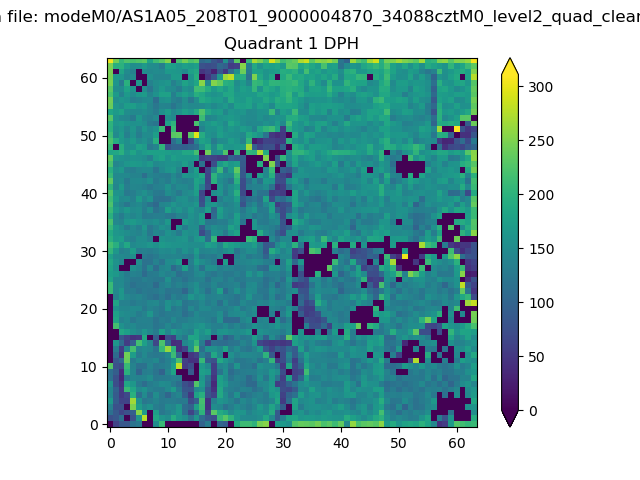 |
Quadrant B |
|---|---|---|---|
| Quadrant D | 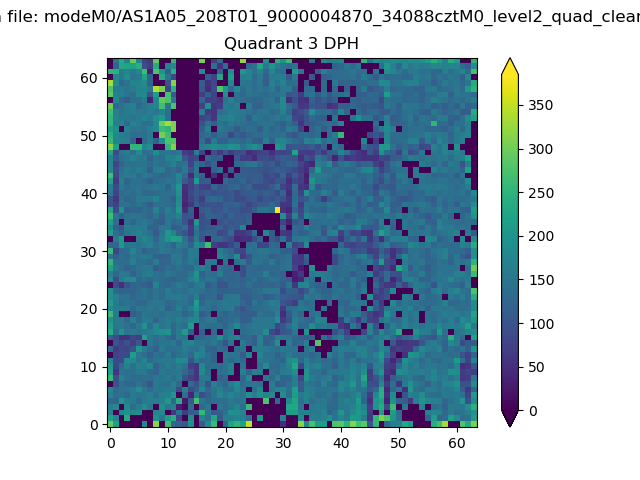 |
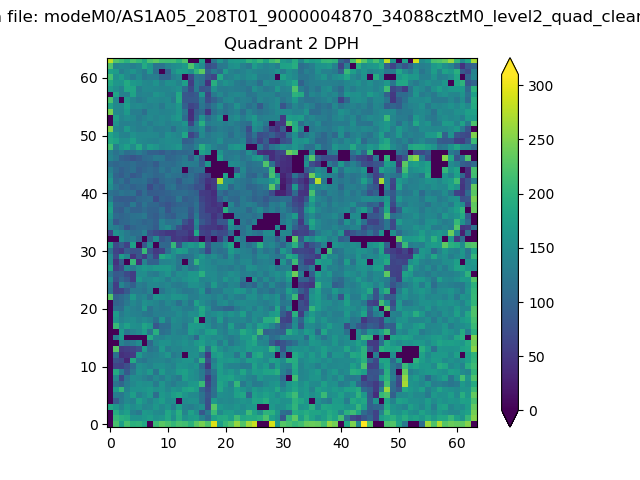 |
Quadrant C |
| Plot type | Count rate plots | Images |
|---|---|---|
| Comparison with Poisson distribution Blue bars denote a histogram of data divided into 1 sec bins. Red curve is a Poisson curve with rate = median count rate of data. |
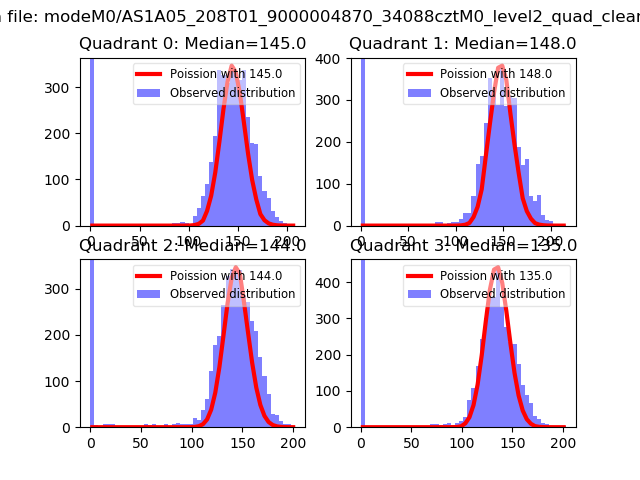 |
 |
| Quadrant-wise count rates Data is divided into 100 sec bins |
 |
|
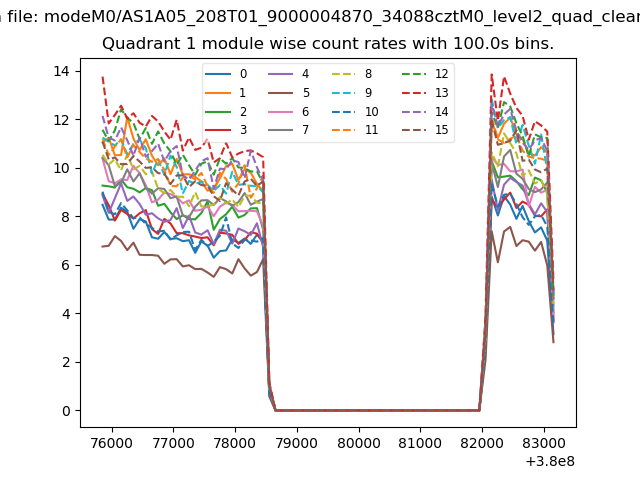
| Module-wise count rates for Quadrant A Data is divided into 100 sec bins |
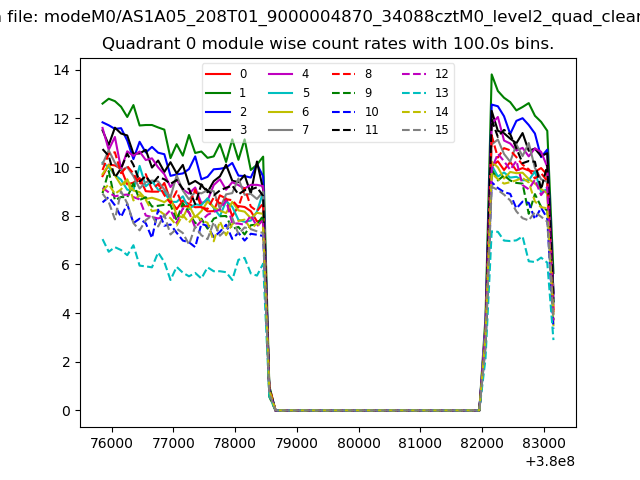 |
 |
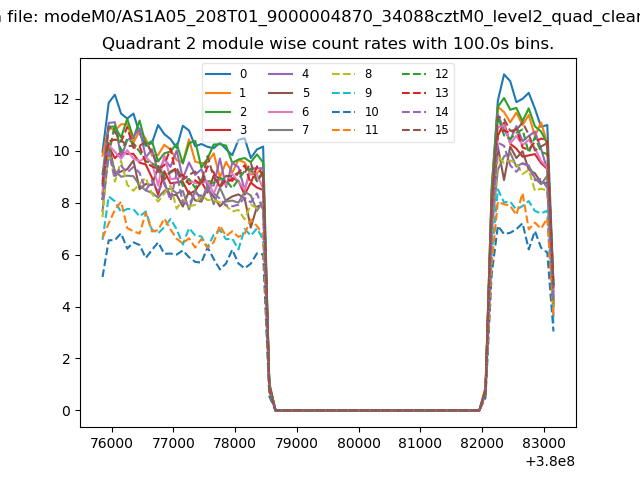
| Module-wise count rates for Quadrant B Data is divided into 100 sec bins |
 |
 |
| Module-wise count rates for Quadrant C Data is divided into 100 sec bins |
 |
 |
| Module-wise count rates for Quadrant D Data is divided into 100 sec bins |
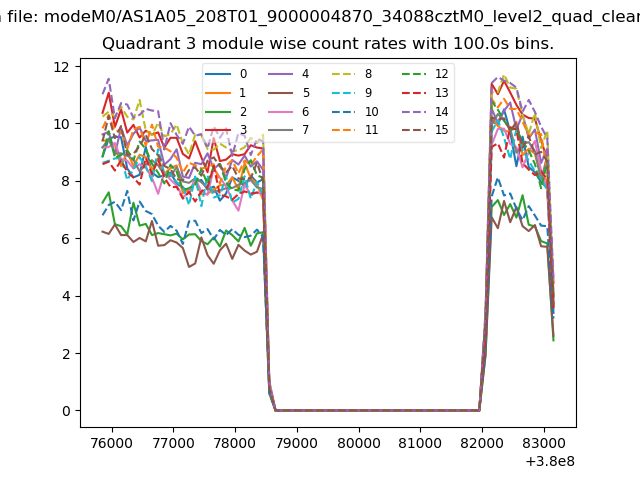 |
 |
| Parameter | Plot |
|---|---|
| CZT HV Monitor | 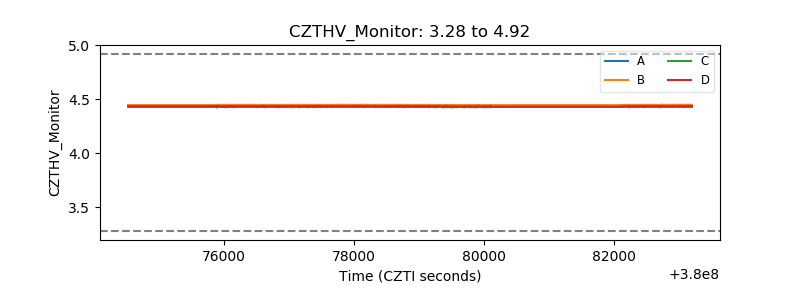 |
| D_VDD | 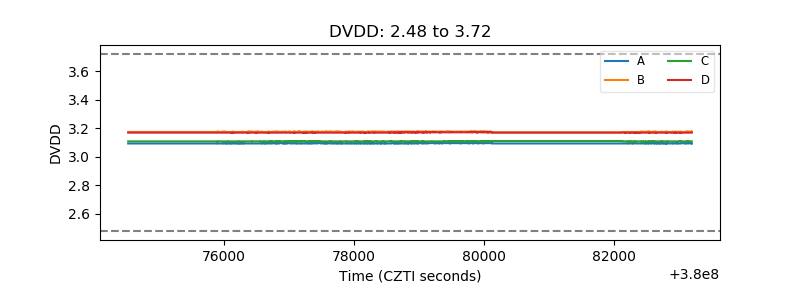 |
| Temperature 1 | 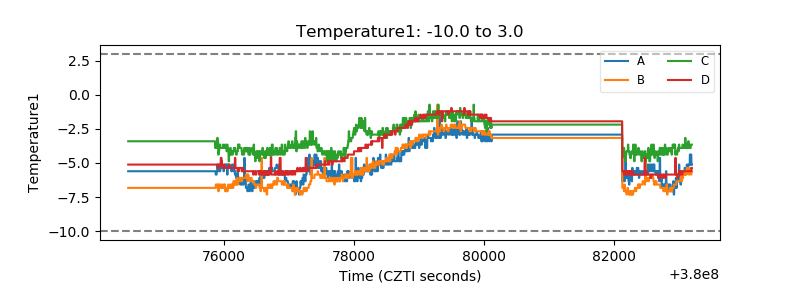 |
| Veto HV Monitor |  |
| Veto LLD | 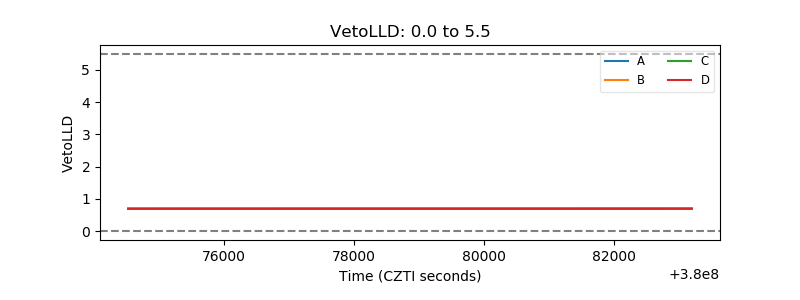 |
| Alpha Counter | 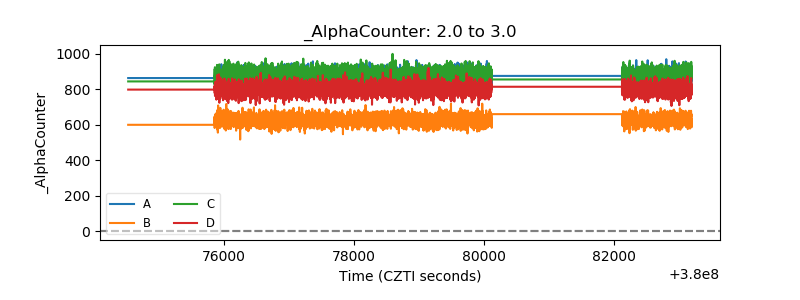 |
| _CPM_Rate | 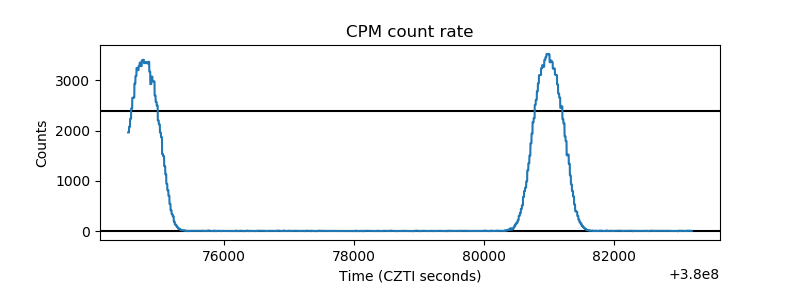 |
| CZT Counter | 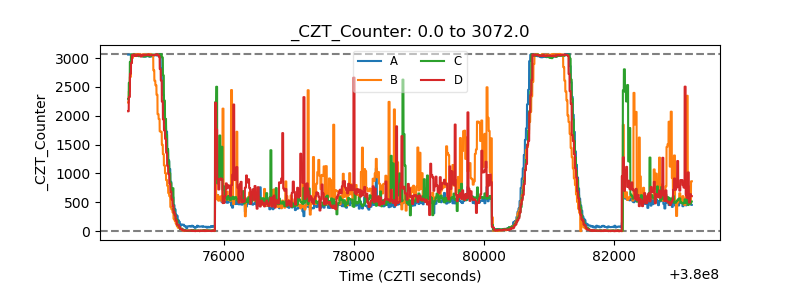 |
| +2.5 Volts monitor |  |
| +5 Volts monitor |  |
| _ROLL_ROT | 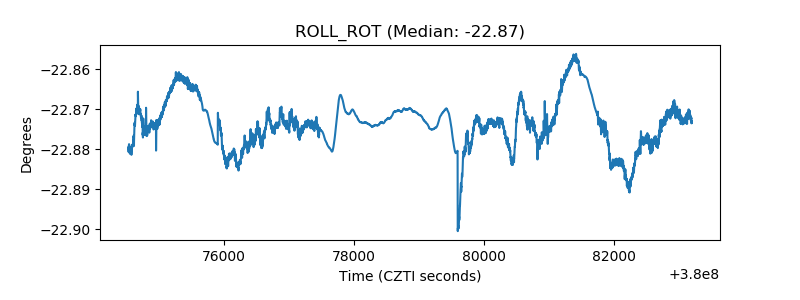 |
| _Roll_DEC | 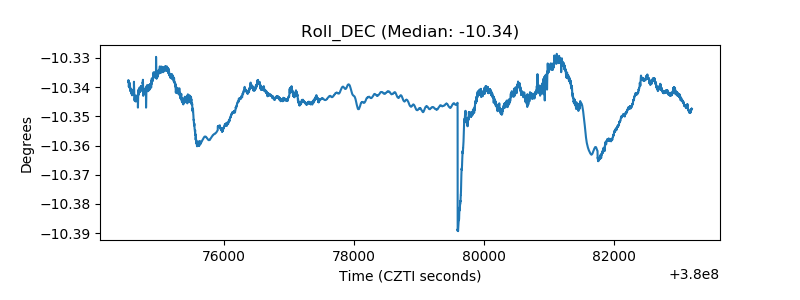 |
| _Roll_RA | 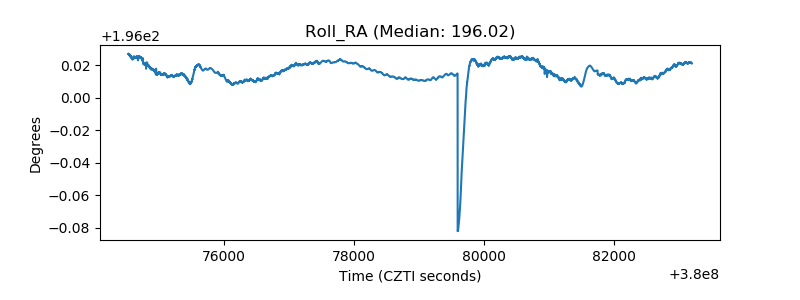 |
| Veto Counter | 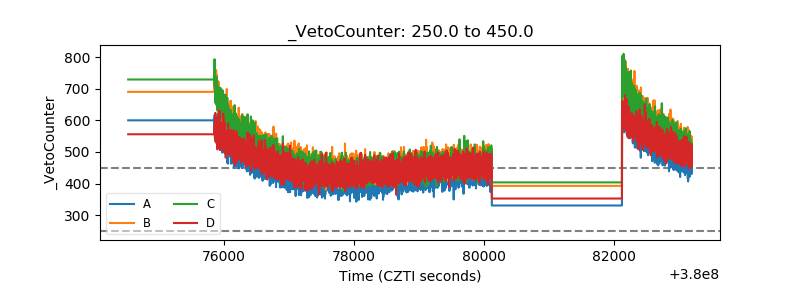 |