| Param | Original file | Final file |
|---|---|---|
| Filename | modeM0/AS1A05_208T01_9000004870_34090cztM0_level2.evt | modeM0/AS1A05_208T01_9000004870_34090cztM0_level2_quad_clean.evt |
| Size (bytes) | 549,527,040 | 65,295,360 |
| Size | 524.1 MB | 62.3 MB |
| Events in quadrant A | 2,556,639 | 425,210 |
| Events in quadrant B | 4,293,839 | 431,069 |
| Events in quadrant C | 3,105,391 | 419,948 |
| Events in quadrant D | 6,338,786 | 340,212 |
| Mode SS | |||
|---|---|---|---|
| Quadrant | BADHDUFLAG | Total packets | Discarded packets |
| A | 0 | 106 | 0 |
| B | 0 | 106 | 0 |
| C | 0 | 106 | 0 |
| D | 0 | 106 | 0 |
| Mode M9 | |||
|---|---|---|---|
| Quadrant | BADHDUFLAG | Total packets | Discarded packets |
| A | 0 | 33 | 0 |
| B | 0 | 33 | 0 |
| C | 0 | 33 | 0 |
| D | 0 | 34 | 0 |
| Mode M0 | |||
|---|---|---|---|
| Quadrant | BADHDUFLAG | Total packets | Discarded packets |
| A | 0 | 10492 | 3 |
| B | 0 | 16069 | 2 |
| C | 0 | 12117 | 2 |
| D | 0 | 22373 | 2 |
| Quadrant | Total seconds | Saturated seconds | Saturation percentage |
|---|---|---|---|
| A | 5136 | 8 | 0.155763% |
| B | 5136 | 412 | 8.021807% |
| C | 5136 | 85 | 1.654984% |
| D | 5136 | 1000 | 19.470405% |
Noise dominated data is calculated using 1-second bins in cleaned event files. If a bin has >2000 counts, and if more than 50% of those come from <1% of pixels, then it is considered to be noise-dominated and hence unusable.
| Quadrant | # 1 sec bins | Bins with >0 counts | Bins with >2000 counts | High rate bins dominated by noise | Noise dominated (total time) | Noise dominated (detector-on time) | Marked lightcurve |
|---|---|---|---|---|---|---|---|
| A | 7260 | 5137 | 0 | 0 | 0.00% | 0.00% | 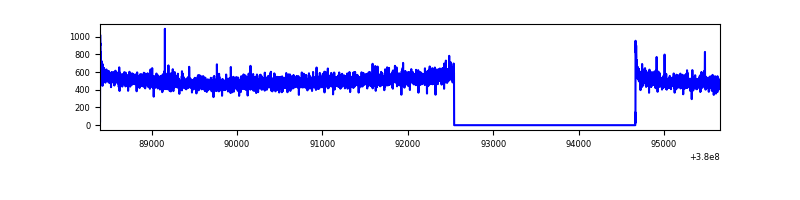 |
| B | 7260 | 5137 | 282 | 282 | 3.88% | 5.49% | 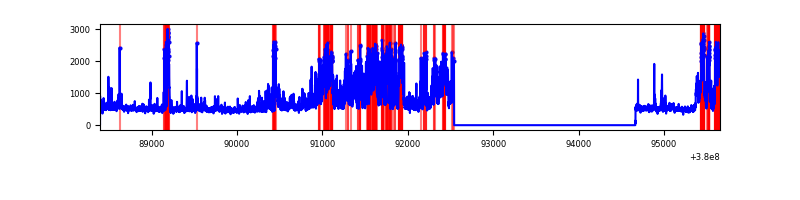 |
| C | 7260 | 5137 | 78 | 78 | 1.07% | 1.52% | 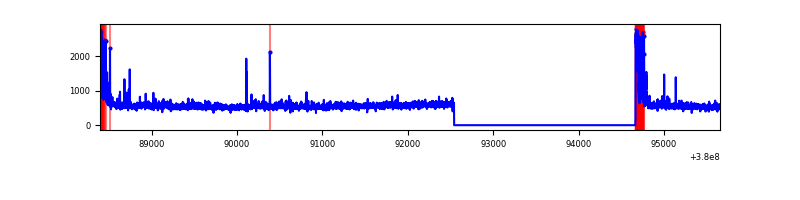 |
| D | 7260 | 5137 | 1037 | 1037 | 14.28% | 20.19% | 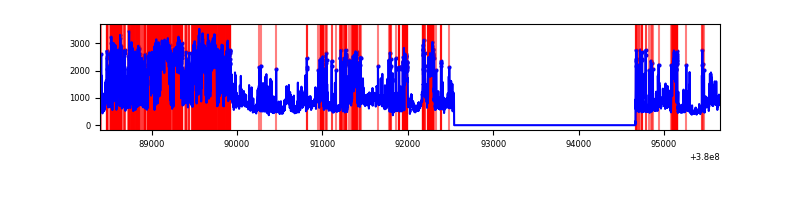 |
Top three noisy pixels from each quadrant. If the there are fewer than three noisy pixels in the level2.evt file, extra rows are filled as -1
| Pixel properties | Quadrant properties | ||||||
|---|---|---|---|---|---|---|---|
| Quadrant | DetID | PixID | Counts | Sigma | Mean | Median | Sigma |
| A | 10 | 83 | 19565 | 145.96 | 654 | 641 | 129.7 |
| A | 13 | 6 | 9729 | 70.09 | 654 | 641 | 129.7 |
| A | 13 | 254 | 7874 | 55.79 | 654 | 641 | 129.7 |
| B | 5 | 31 | 935452 | 7746.13 | 635 | 620 | 120.7 |
| B | 5 | 172 | 494214 | 4089.98 | 635 | 620 | 120.7 |
| B | 5 | 15 | 272808 | 2255.38 | 635 | 620 | 120.7 |
| C | 0 | 10 | 310283 | 2120.13 | 635 | 642 | 146.0 |
| C | 15 | 214 | 225978 | 1542.89 | 635 | 642 | 146.0 |
| C | 3 | 233 | 56085 | 379.62 | 635 | 642 | 146.0 |
| D | 12 | 16 | 1646624 | 11421.03 | 585 | 570 | 144.1 |
| D | 2 | 250 | 697261 | 4833.94 | 585 | 570 | 144.1 |
| D | 8 | 195 | 622641 | 4316.2 | 585 | 570 | 144.1 |
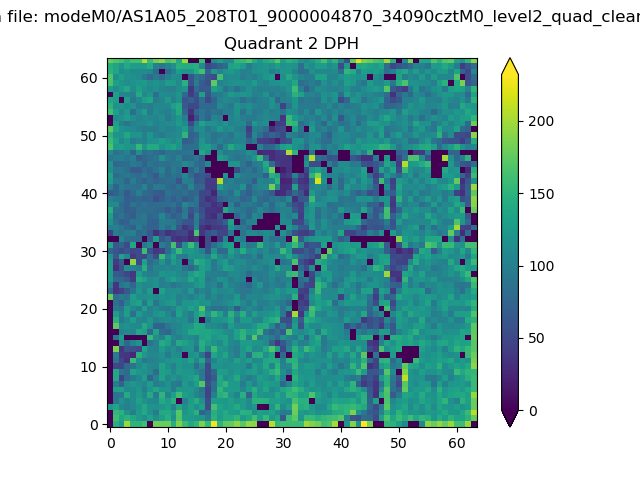
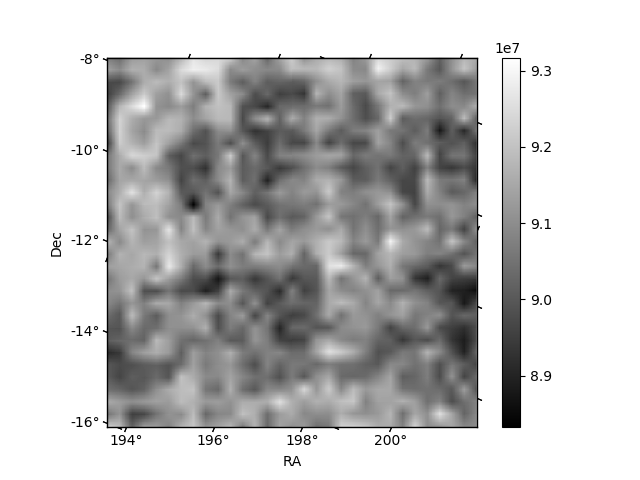
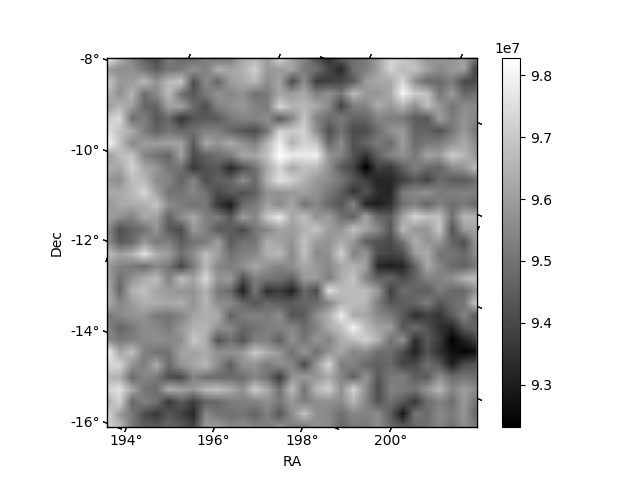
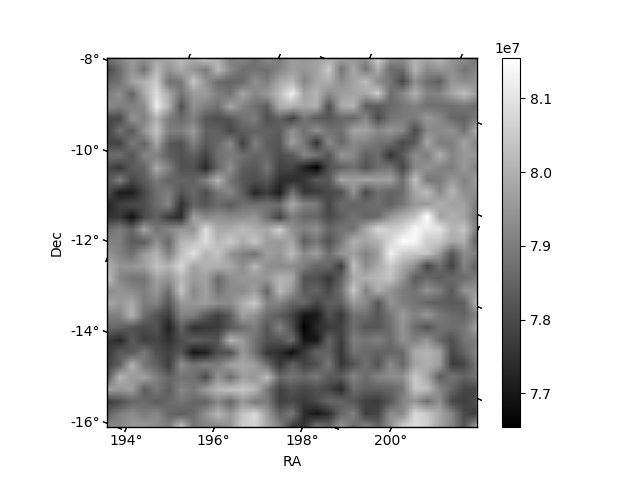
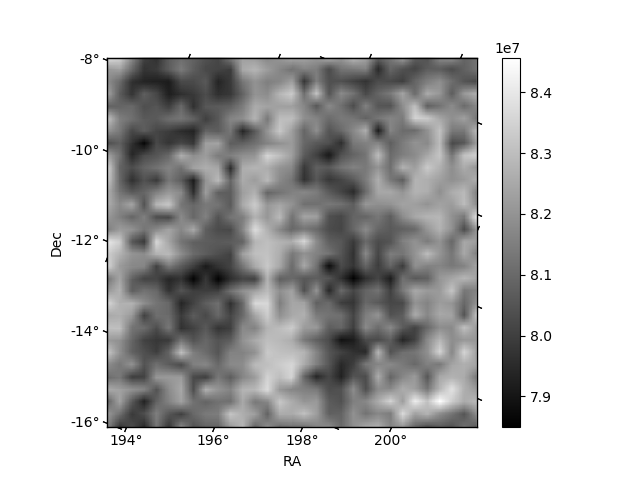
Histogram calculated using DETX and DETY for each event in the final _common_clean file
| Quadrant A |  |
 |
Quadrant B |
|---|---|---|---|
| Quadrant D | 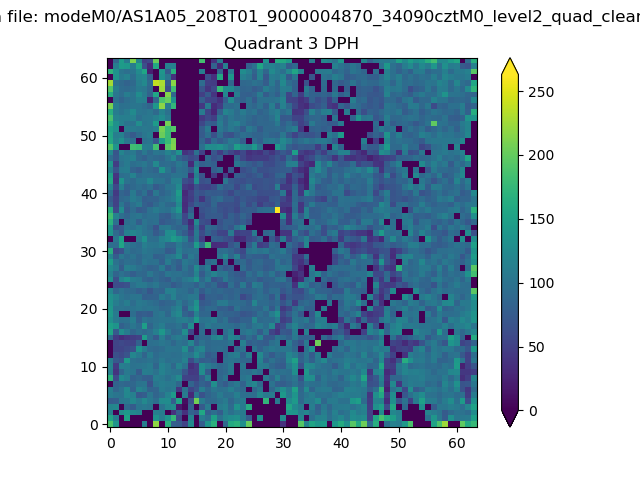 |
 |
Quadrant C |
| Plot type | Count rate plots | Images |
|---|---|---|
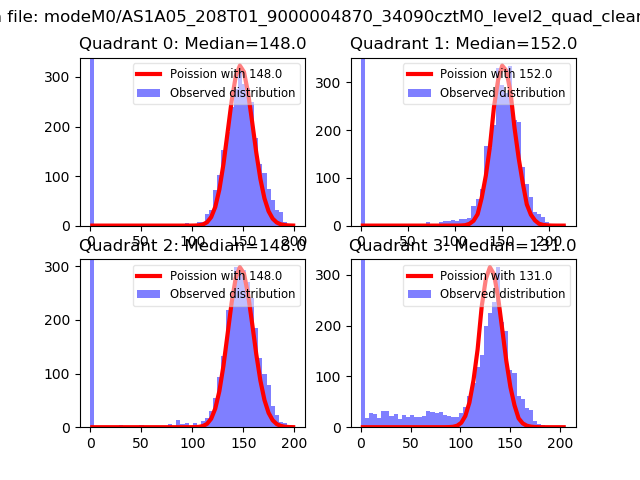
| Comparison with Poisson distribution Blue bars denote a histogram of data divided into 1 sec bins. Red curve is a Poisson curve with rate = median count rate of data. |
 |
 |
| Quadrant-wise count rates Data is divided into 100 sec bins |
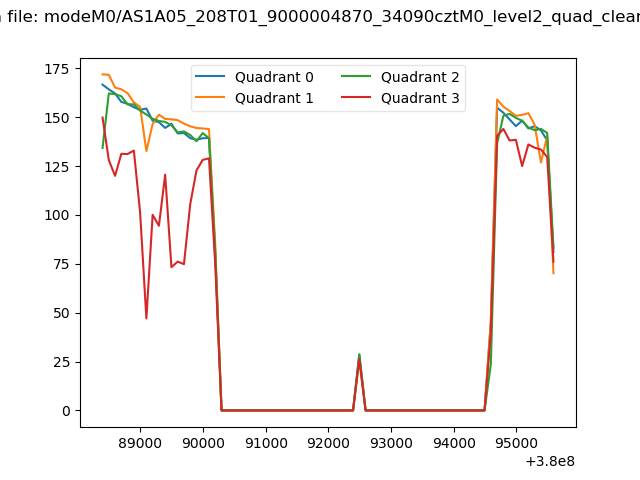 |
|
| Module-wise count rates for Quadrant A Data is divided into 100 sec bins |
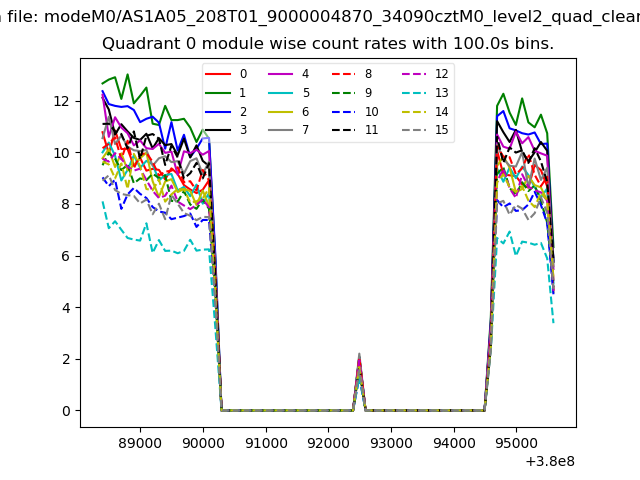 |
 |
| Module-wise count rates for Quadrant B Data is divided into 100 sec bins |
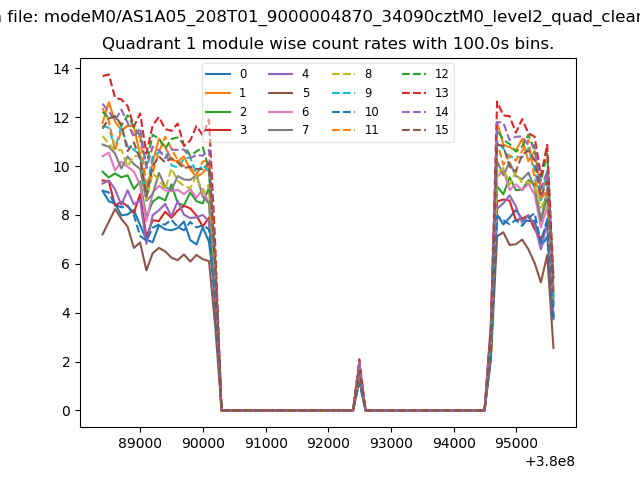 |
 |
| Module-wise count rates for Quadrant C Data is divided into 100 sec bins |
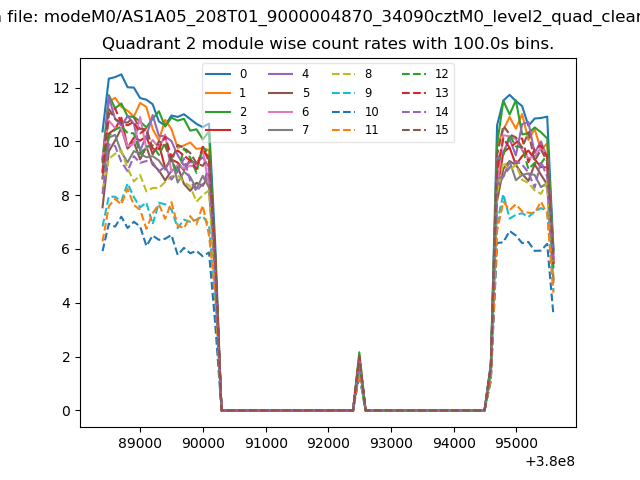 |
 |
| Module-wise count rates for Quadrant D Data is divided into 100 sec bins |
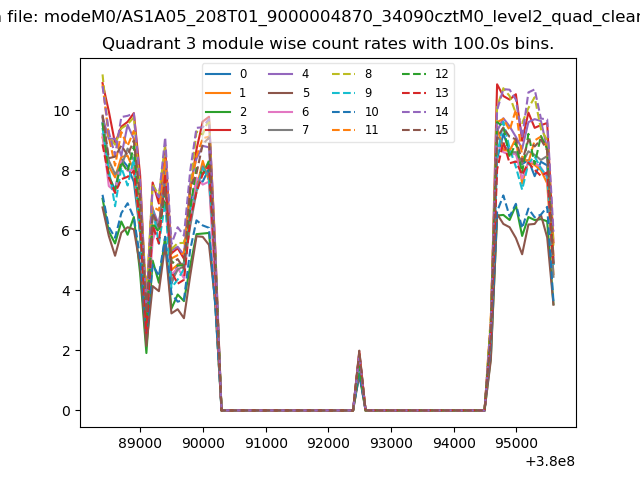 |
 |
| Parameter | Plot |
|---|---|
| CZT HV Monitor | 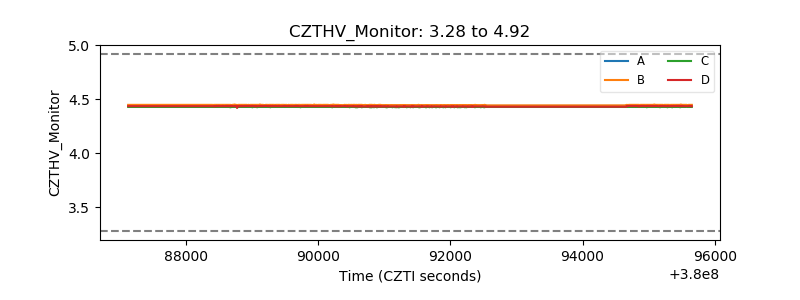 |
| D_VDD | 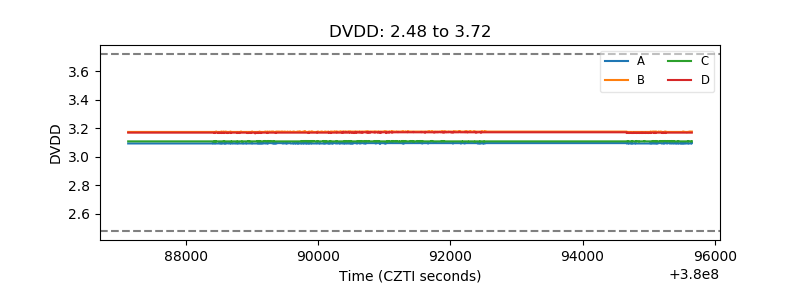 |
| Temperature 1 | 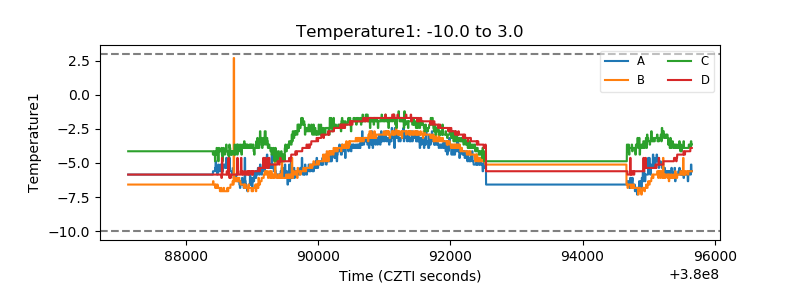 |
| Veto HV Monitor | 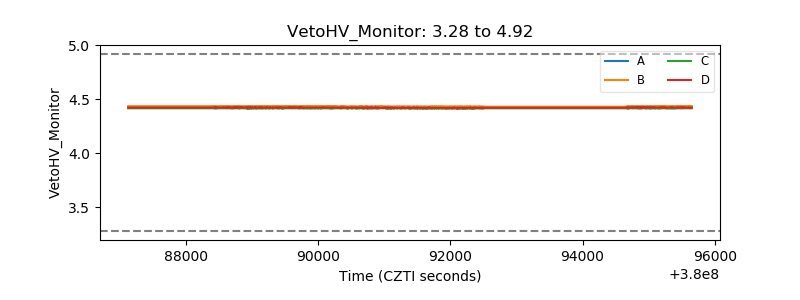 |
| Veto LLD | 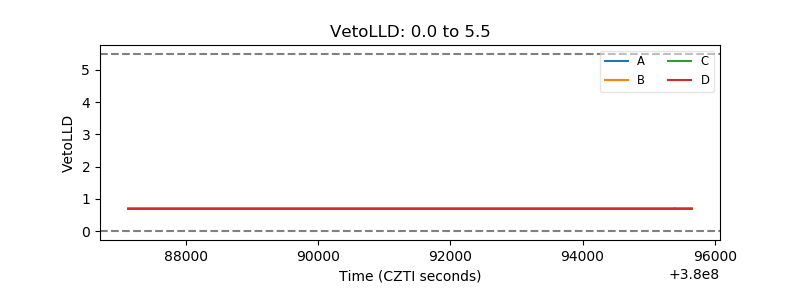 |
| Alpha Counter | 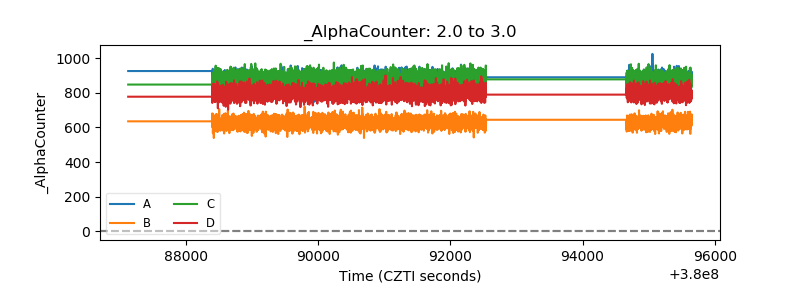 |
| _CPM_Rate | 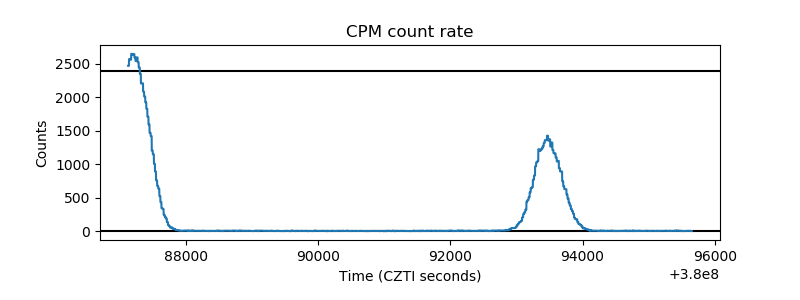 |
| CZT Counter | 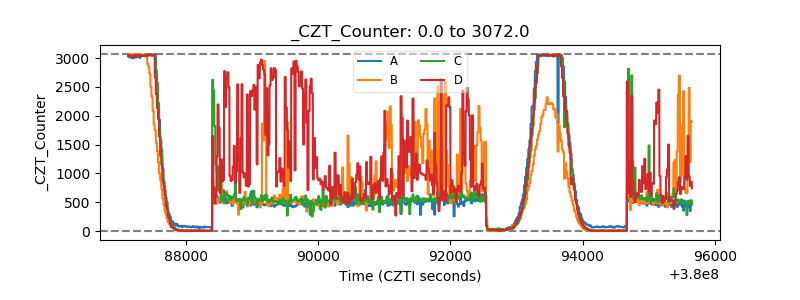 |
| +2.5 Volts monitor |  |
| +5 Volts monitor | 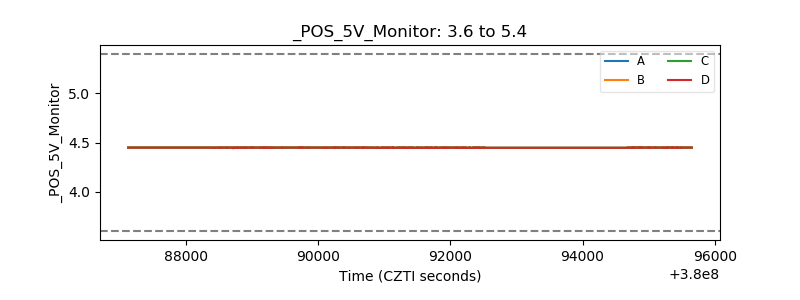 |
| _ROLL_ROT | 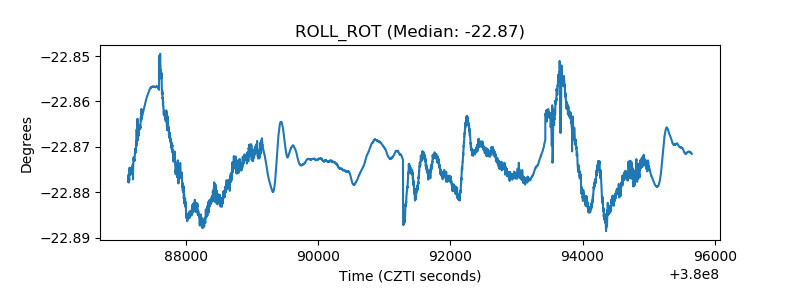 |
| _Roll_DEC | 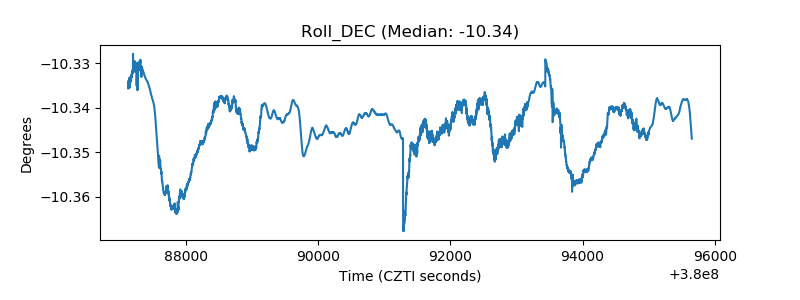 |
| _Roll_RA | 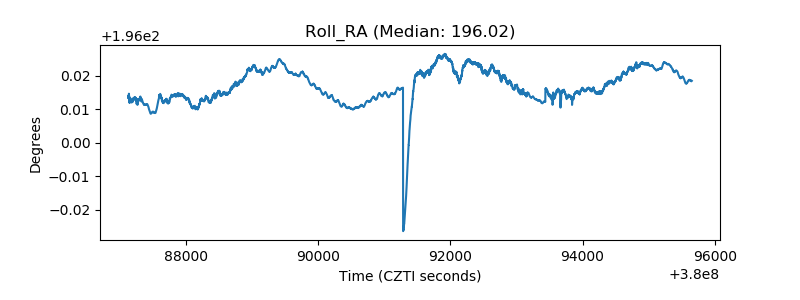 |
| Veto Counter | 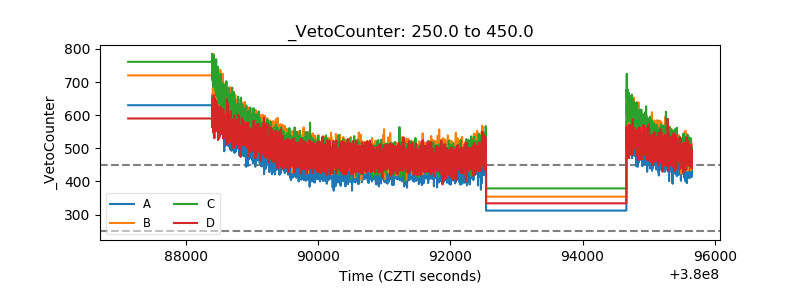 |