| Param | Original file | Final file |
|---|---|---|
| Filename | modeM0/AS1A05_208T01_9000004870_34091cztM0_level2.evt | modeM0/AS1A05_208T01_9000004870_34091cztM0_level2_quad_clean.evt |
| Size (bytes) | 883,267,200 | 99,673,920 |
| Size | 842.3 MB | 95.1 MB |
| Events in quadrant A | 4,374,574 | 625,883 |
| Events in quadrant B | 7,085,226 | 626,783 |
| Events in quadrant C | 5,362,883 | 618,936 |
| Events in quadrant D | 9,325,247 | 526,919 |
| Mode SS | |||
|---|---|---|---|
| Quadrant | BADHDUFLAG | Total packets | Discarded packets |
| A | 0 | 184 | 0 |
| B | 0 | 184 | 0 |
| C | 0 | 184 | 0 |
| D | 0 | 184 | 0 |
| Mode M9 | |||
|---|---|---|---|
| Quadrant | BADHDUFLAG | Total packets | Discarded packets |
| A | 0 | 42 | 0 |
| B | 0 | 42 | 0 |
| C | 0 | 42 | 0 |
| D | 0 | 42 | 0 |
| Mode M0 | |||
|---|---|---|---|
| Quadrant | BADHDUFLAG | Total packets | Discarded packets |
| A | 0 | 18102 | 3 |
| B | 0 | 26878 | 2 |
| C | 0 | 21067 | 2 |
| D | 0 | 33803 | 2 |
| Quadrant | Total seconds | Saturated seconds | Saturation percentage |
|---|---|---|---|
| A | 8921 | 11 | 0.123305% |
| B | 8921 | 516 | 5.784105% |
| C | 8921 | 116 | 1.300303% |
| D | 8921 | 1076 | 12.061428% |
Noise dominated data is calculated using 1-second bins in cleaned event files. If a bin has >2000 counts, and if more than 50% of those come from <1% of pixels, then it is considered to be noise-dominated and hence unusable.
| Quadrant | # 1 sec bins | Bins with >0 counts | Bins with >2000 counts | High rate bins dominated by noise | Noise dominated (total time) | Noise dominated (detector-on time) | Marked lightcurve |
|---|---|---|---|---|---|---|---|
| A | 13138 | 8923 | 0 | 0 | 0.00% | 0.00% | 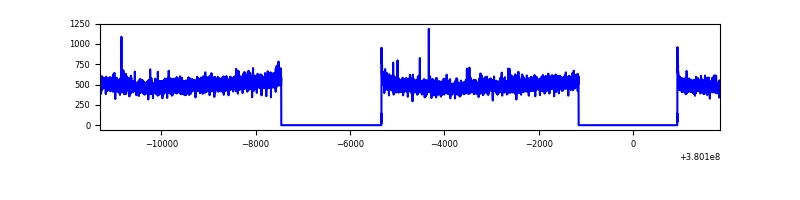 |
| B | 13138 | 8923 | 369 | 369 | 2.81% | 4.14% |  |
| C | 13138 | 8923 | 108 | 108 | 0.82% | 1.21% | 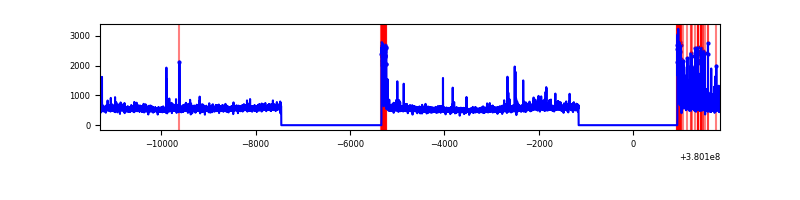 |
| D | 13138 | 8923 | 1092 | 1092 | 8.31% | 12.24% | 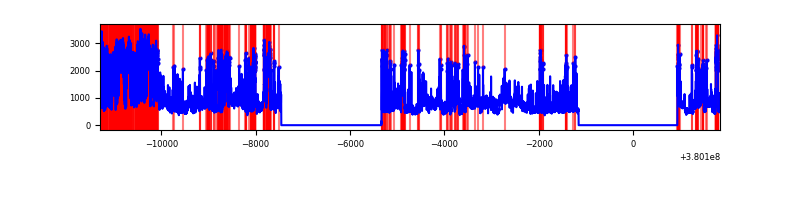 |
Top three noisy pixels from each quadrant. If the there are fewer than three noisy pixels in the level2.evt file, extra rows are filled as -1
| Pixel properties | Quadrant properties | ||||||
|---|---|---|---|---|---|---|---|
| Quadrant | DetID | PixID | Counts | Sigma | Mean | Median | Sigma |
| A | 10 | 83 | 22529 | 96.54 | 1124 | 1102 | 222.0 |
| A | 13 | 6 | 15343 | 64.16 | 1124 | 1102 | 222.0 |
| A | 13 | 254 | 14441 | 60.1 | 1124 | 1102 | 222.0 |
| B | 5 | 31 | 1398200 | 6796.4 | 1090 | 1063 | 205.6 |
| B | 5 | 172 | 838870 | 4075.53 | 1090 | 1063 | 205.6 |
| B | 5 | 15 | 405153 | 1965.7 | 1090 | 1063 | 205.6 |
| C | 0 | 10 | 523172 | 2098.81 | 1089 | 1101 | 248.7 |
| C | 15 | 214 | 383200 | 1536.1 | 1089 | 1101 | 248.7 |
| C | 3 | 233 | 82578 | 327.55 | 1089 | 1101 | 248.7 |
| D | 12 | 16 | 1445007 | 5622.01 | 1041 | 1012 | 256.8 |
| D | 8 | 195 | 1351293 | 5257.14 | 1041 | 1012 | 256.8 |
| D | 2 | 250 | 880219 | 3423.08 | 1041 | 1012 | 256.8 |
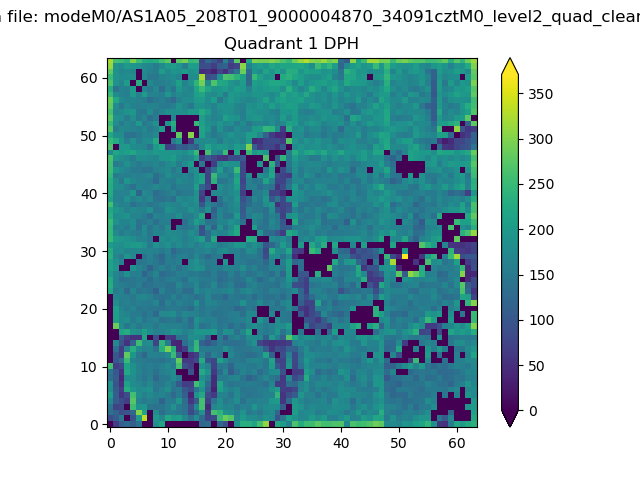
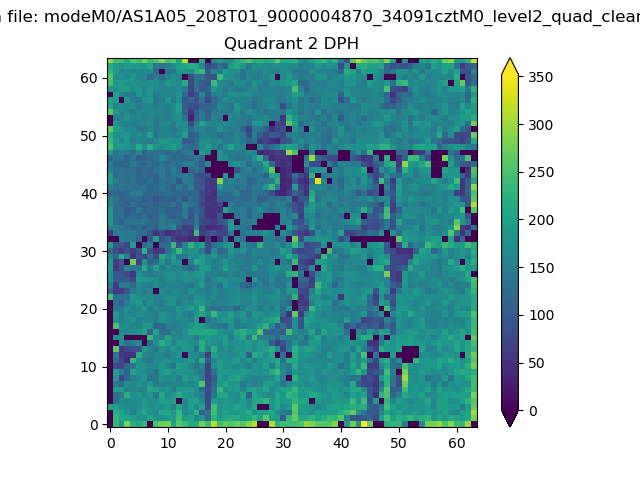
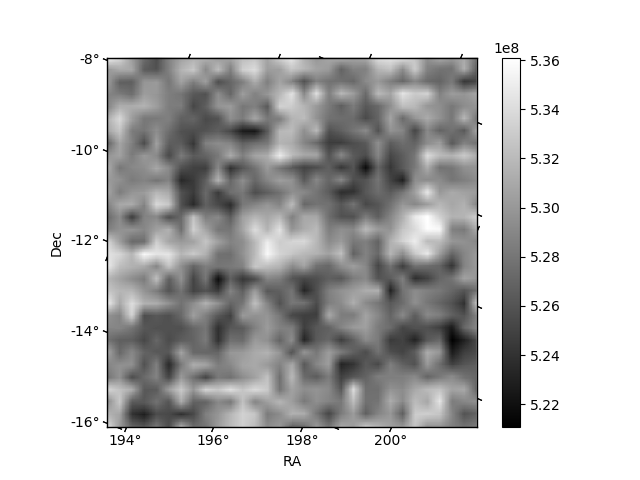
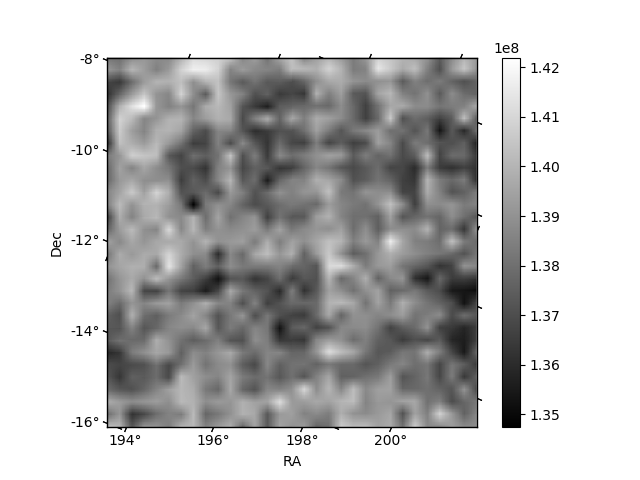
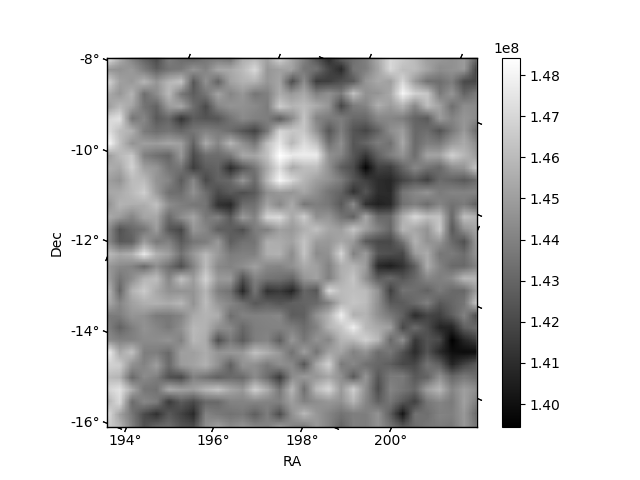
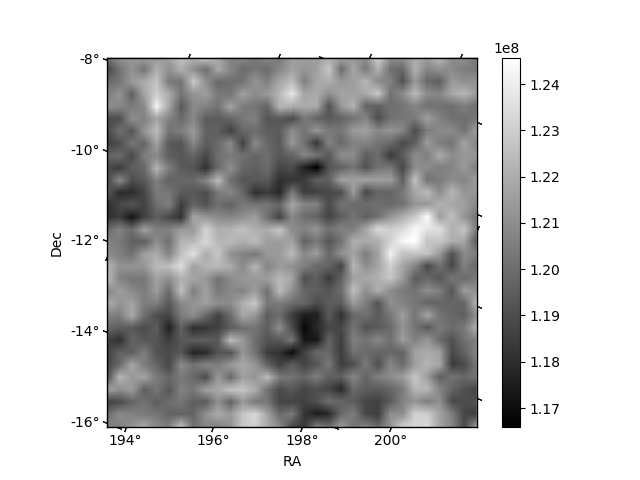
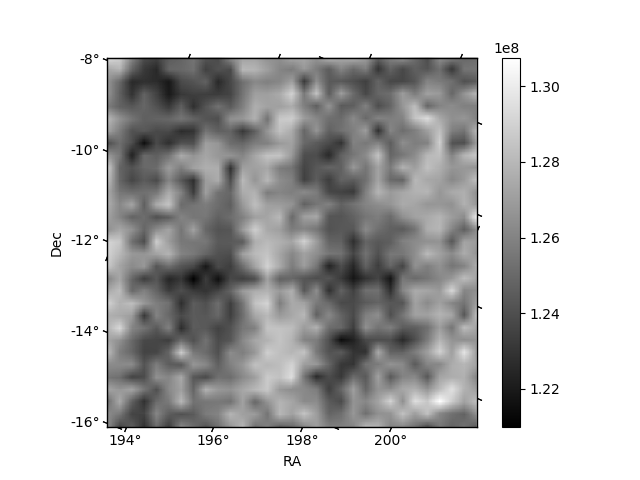
Histogram calculated using DETX and DETY for each event in the final _common_clean file
| Quadrant A | 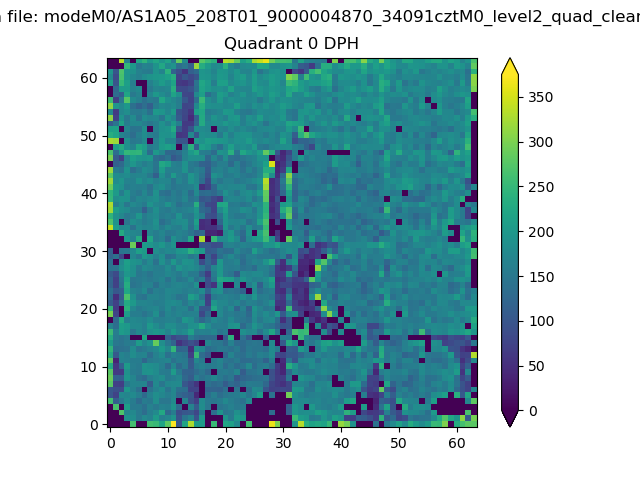 |
 |
Quadrant B |
|---|---|---|---|
| Quadrant D | 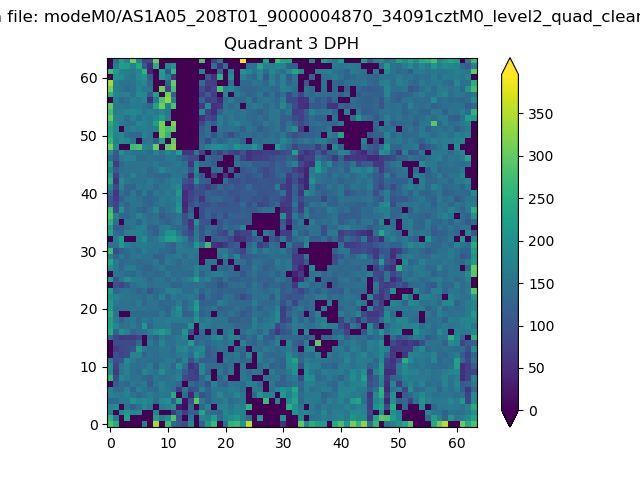 |
 |
Quadrant C |
| Plot type | Count rate plots | Images |
|---|---|---|
| Comparison with Poisson distribution Blue bars denote a histogram of data divided into 1 sec bins. Red curve is a Poisson curve with rate = median count rate of data. |
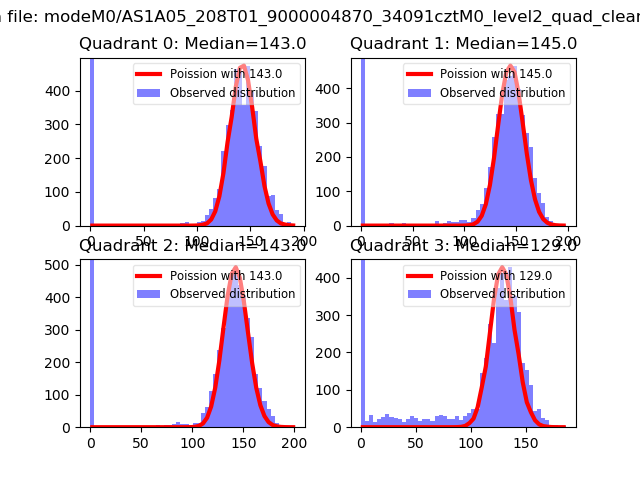 |
 |
| Quadrant-wise count rates Data is divided into 100 sec bins |
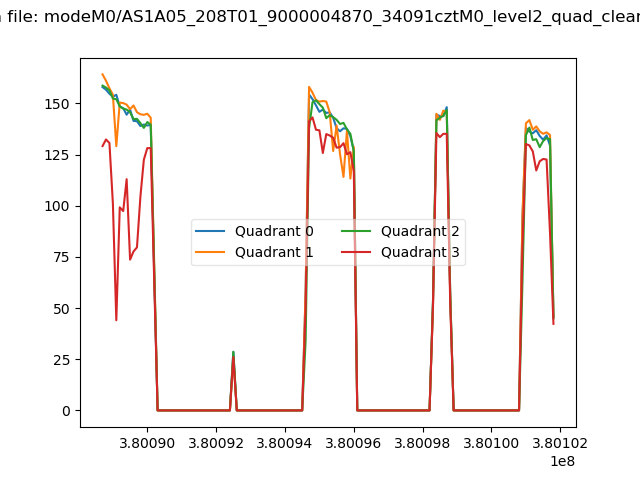 |
|
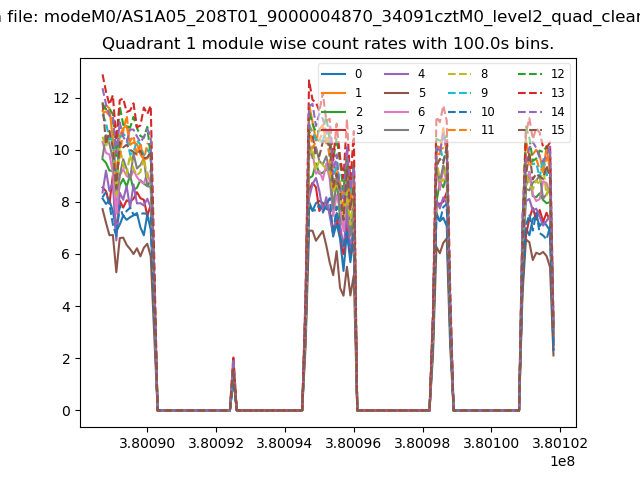
| Module-wise count rates for Quadrant A Data is divided into 100 sec bins |
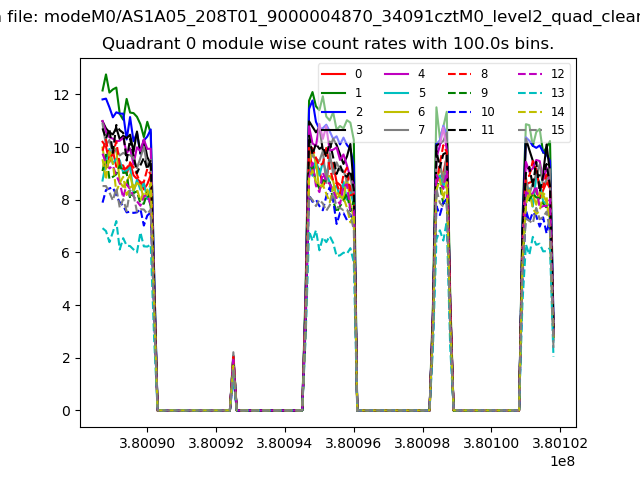 |
 |
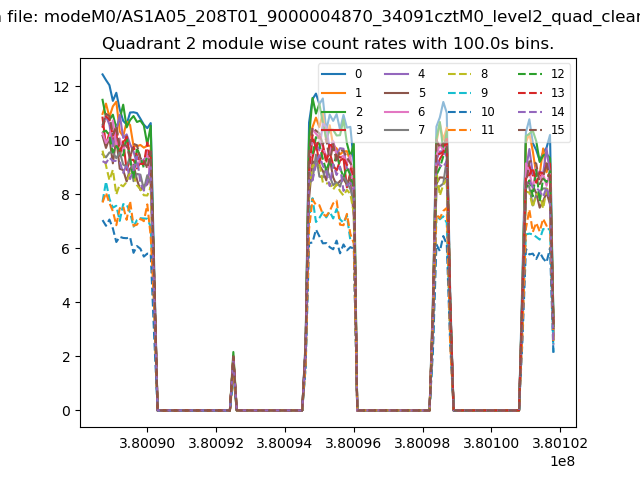
| Module-wise count rates for Quadrant B Data is divided into 100 sec bins |
 |
 |
| Module-wise count rates for Quadrant C Data is divided into 100 sec bins |
 |
 |
| Module-wise count rates for Quadrant D Data is divided into 100 sec bins |
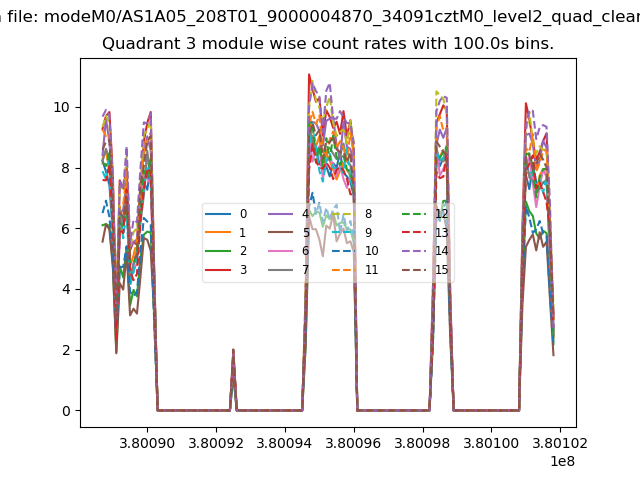 |
 |
| Parameter | Plot |
|---|---|
| CZT HV Monitor | 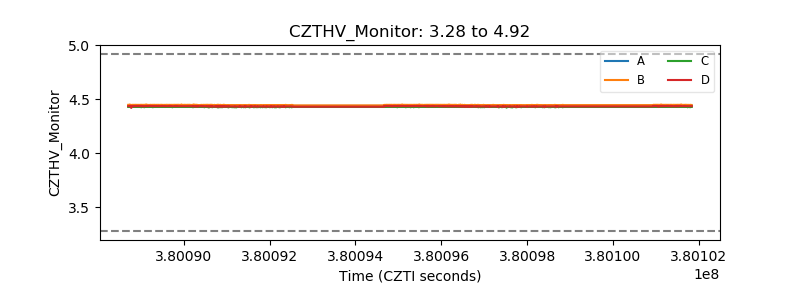 |
| D_VDD | 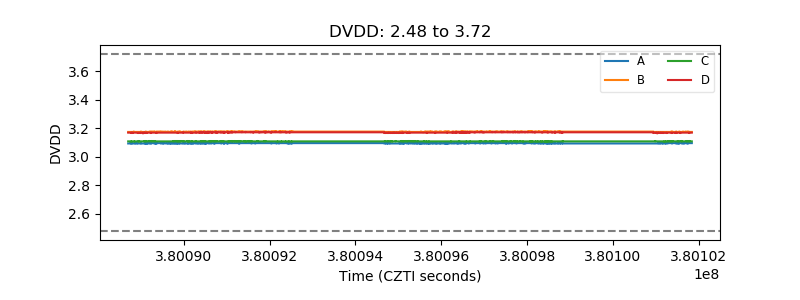 |
| Temperature 1 | 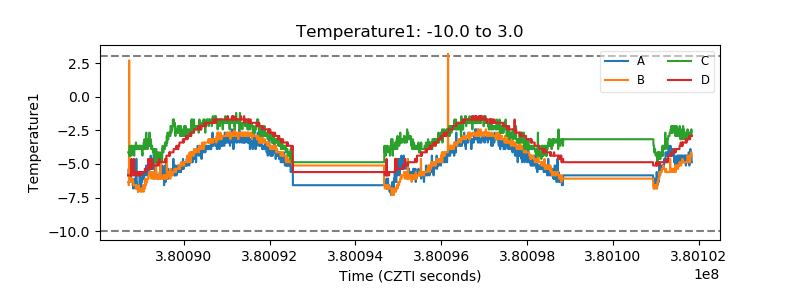 |
| Veto HV Monitor |  |
| Veto LLD | 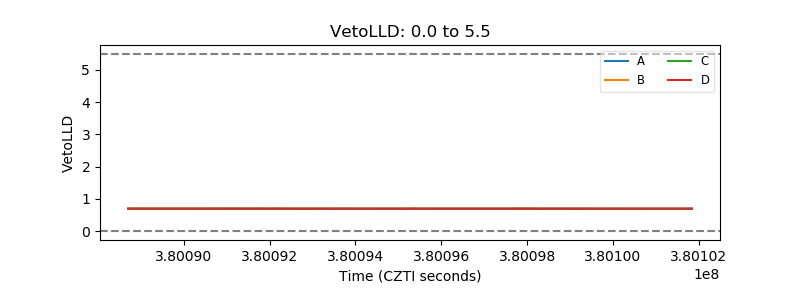 |
| Alpha Counter | 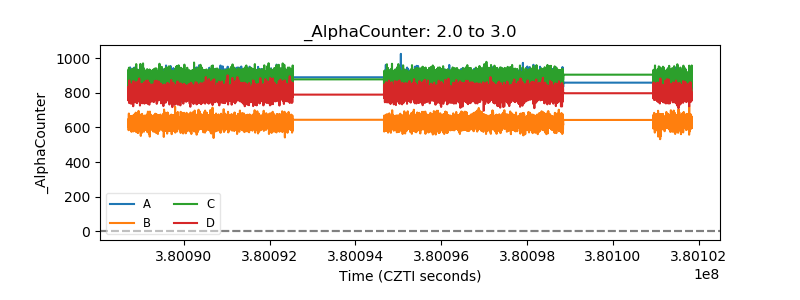 |
| _CPM_Rate | 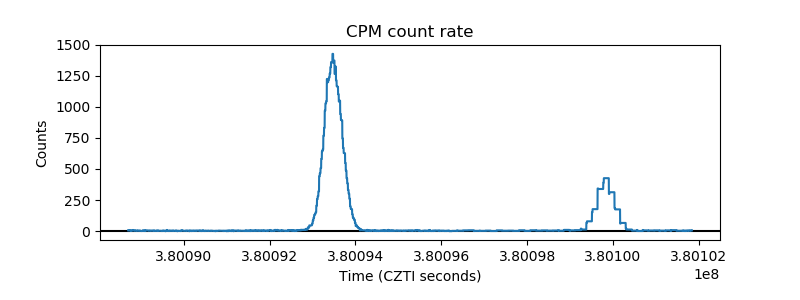 |
| CZT Counter | 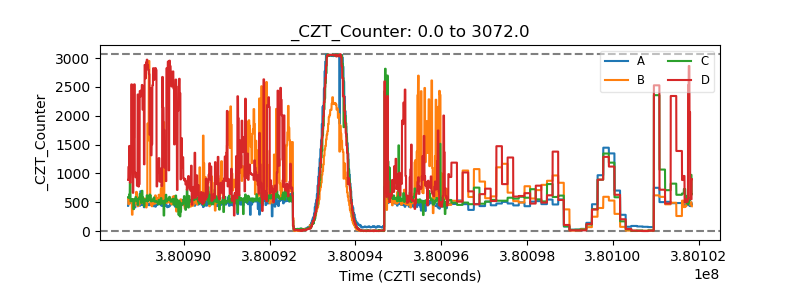 |
| +2.5 Volts monitor |  |
| +5 Volts monitor |  |
| _ROLL_ROT | 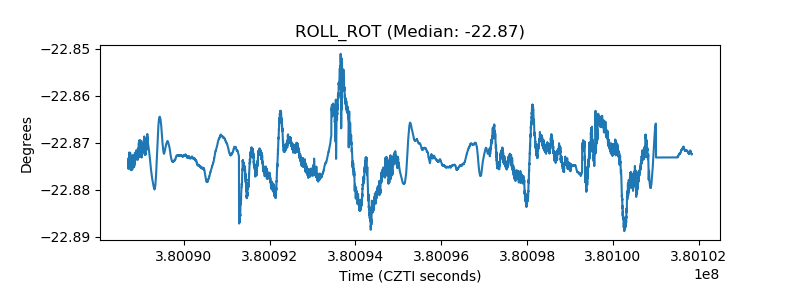 |
| _Roll_DEC | 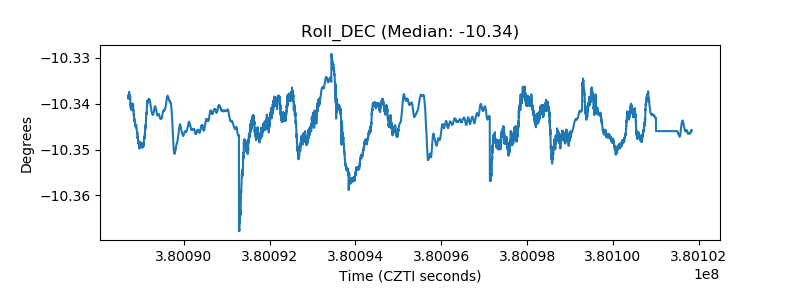 |
| _Roll_RA | 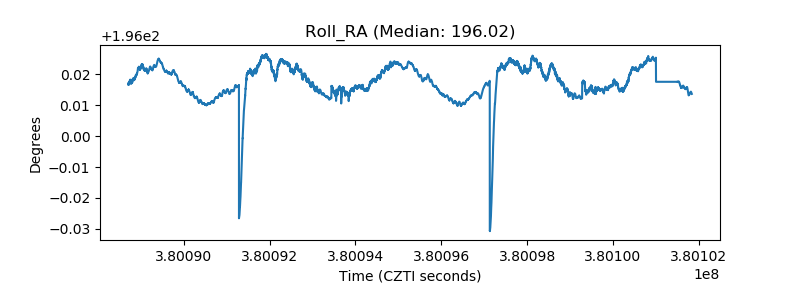 |
| Veto Counter | 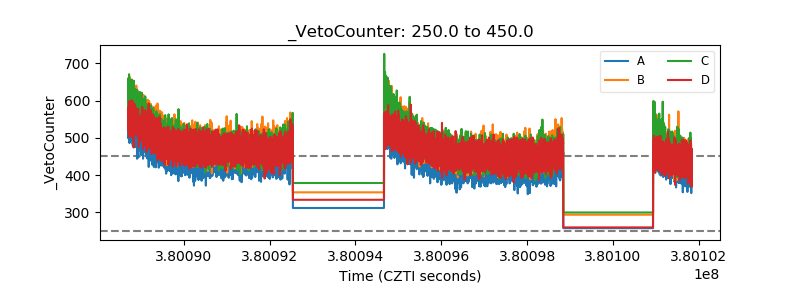 |