| Param | Original file | Final file |
|---|---|---|
| Filename | modeM0/AS1A05_208T01_9000004870_34092cztM0_level2.evt | modeM0/AS1A05_208T01_9000004870_34092cztM0_level2_quad_clean.evt |
| Size (bytes) | 438,053,760 | 55,131,840 |
| Size | 417.8 MB | 52.6 MB |
| Events in quadrant A | 2,349,028 | 338,322 |
| Events in quadrant B | 2,990,106 | 342,023 |
| Events in quadrant C | 3,402,137 | 332,764 |
| Events in quadrant D | 4,189,333 | 308,585 |
| Mode SS | |||
|---|---|---|---|
| Quadrant | BADHDUFLAG | Total packets | Discarded packets |
| A | 0 | 102 | 0 |
| B | 0 | 102 | 0 |
| C | 0 | 102 | 0 |
| D | 0 | 102 | 0 |
| Mode M9 | |||
|---|---|---|---|
| Quadrant | BADHDUFLAG | Total packets | Discarded packets |
| A | 0 | 19 | 0 |
| B | 0 | 19 | 0 |
| C | 0 | 19 | 0 |
| D | 0 | 19 | 0 |
| Mode M0 | |||
|---|---|---|---|
| Quadrant | BADHDUFLAG | Total packets | Discarded packets |
| A | 0 | 9946 | 2 |
| B | 0 | 11998 | 1 |
| C | 0 | 13237 | 1 |
| D | 0 | 15757 | 1 |
| Quadrant | Total seconds | Saturated seconds | Saturation percentage |
|---|---|---|---|
| A | 4949 | 4 | 0.080824% |
| B | 4949 | 111 | 2.242877% |
| C | 4949 | 95 | 1.919580% |
| D | 4949 | 196 | 3.960396% |
Noise dominated data is calculated using 1-second bins in cleaned event files. If a bin has >2000 counts, and if more than 50% of those come from <1% of pixels, then it is considered to be noise-dominated and hence unusable.
| Quadrant | # 1 sec bins | Bins with >0 counts | Bins with >2000 counts | High rate bins dominated by noise | Noise dominated (total time) | Noise dominated (detector-on time) | Marked lightcurve |
|---|---|---|---|---|---|---|---|
| A | 6832 | 4950 | 0 | 0 | 0.00% | 0.00% | 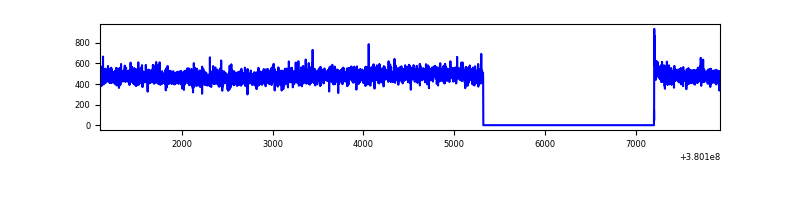 |
| B | 6832 | 4950 | 80 | 80 | 1.17% | 1.62% | 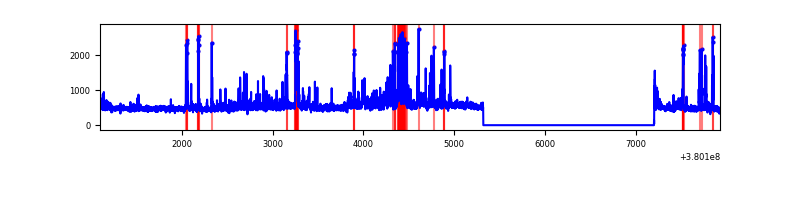 |
| C | 6832 | 4950 | 91 | 91 | 1.33% | 1.84% | 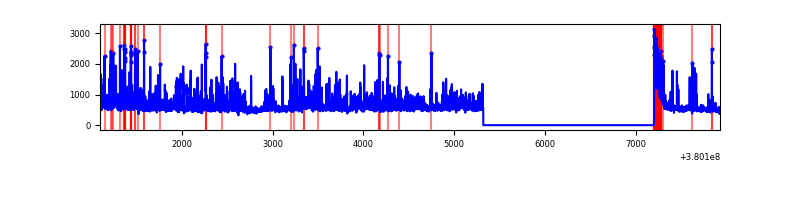 |
| D | 6832 | 4950 | 195 | 195 | 2.85% | 3.94% | 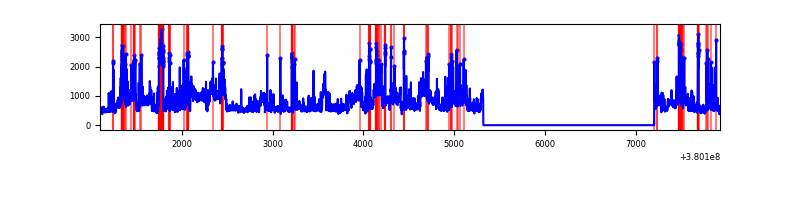 |
Top three noisy pixels from each quadrant. If the there are fewer than three noisy pixels in the level2.evt file, extra rows are filled as -1
| Pixel properties | Quadrant properties | ||||||
|---|---|---|---|---|---|---|---|
| Quadrant | DetID | PixID | Counts | Sigma | Mean | Median | Sigma |
| A | 13 | 6 | 14474 | 114.4 | 601 | 589 | 121.4 |
| A | 10 | 83 | 12348 | 96.89 | 601 | 589 | 121.4 |
| A | 13 | 254 | 9875 | 76.51 | 601 | 589 | 121.4 |
| B | 5 | 172 | 400230 | 3504.38 | 589 | 573 | 114.0 |
| B | 5 | 31 | 85167 | 741.76 | 589 | 573 | 114.0 |
| B | 0 | 245 | 35561 | 306.79 | 589 | 573 | 114.0 |
| C | 0 | 10 | 775512 | 5746.75 | 579 | 584 | 134.8 |
| C | 15 | 214 | 215401 | 1593.05 | 579 | 584 | 134.8 |
| C | 0 | 207 | 53849 | 395.01 | 579 | 584 | 134.8 |
| D | 8 | 195 | 999056 | 7045.84 | 575 | 559 | 141.7 |
| D | 2 | 250 | 319836 | 2252.96 | 575 | 559 | 141.7 |
| D | 10 | 118 | 183632 | 1291.84 | 575 | 559 | 141.7 |
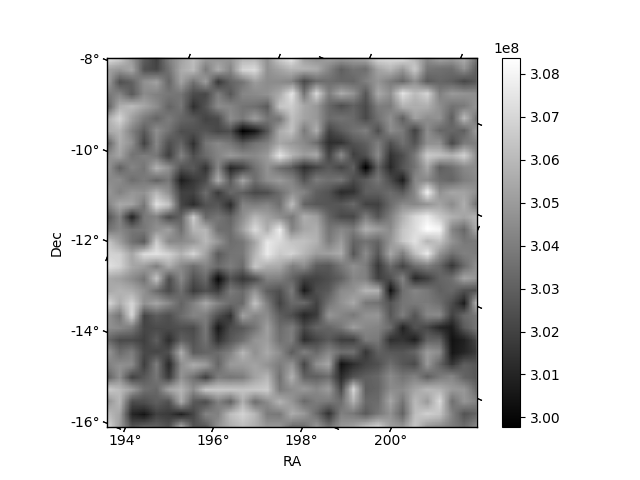
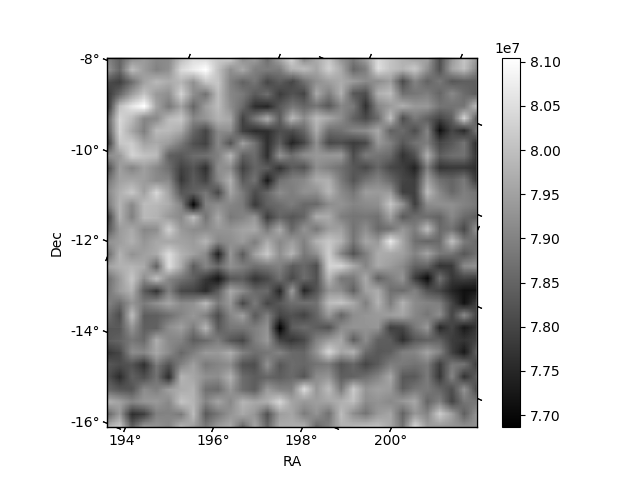
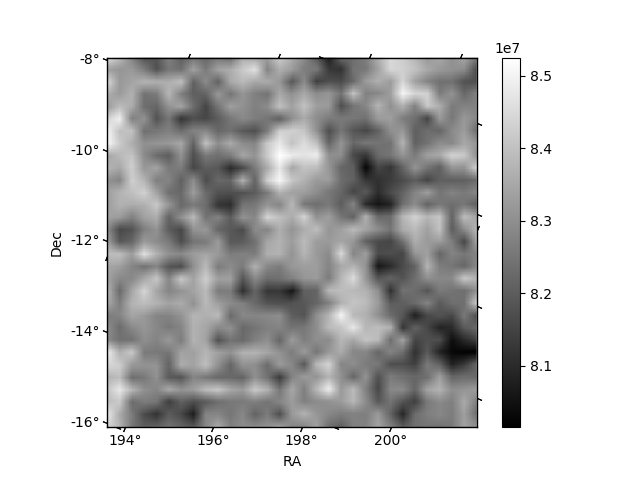
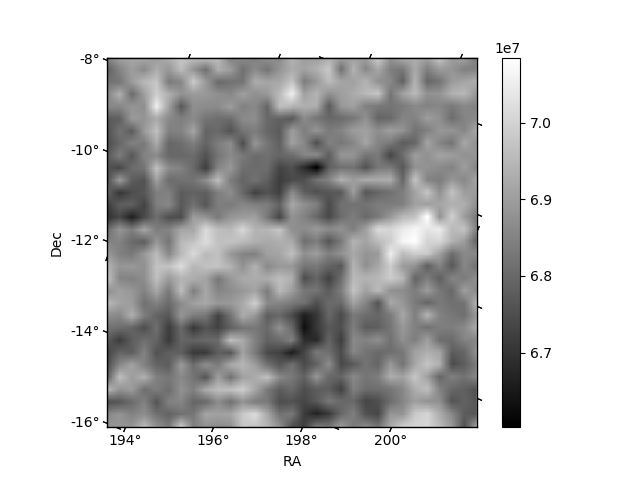
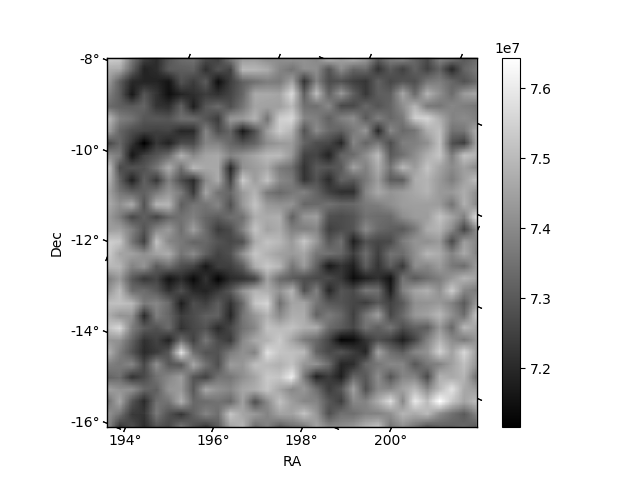
Histogram calculated using DETX and DETY for each event in the final _common_clean file
| Quadrant A | 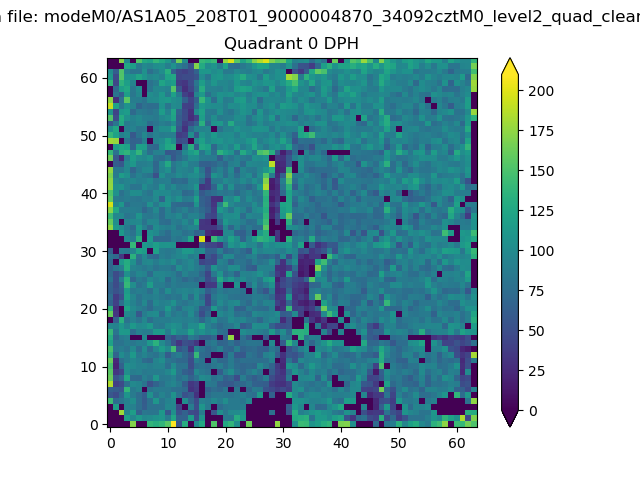 |
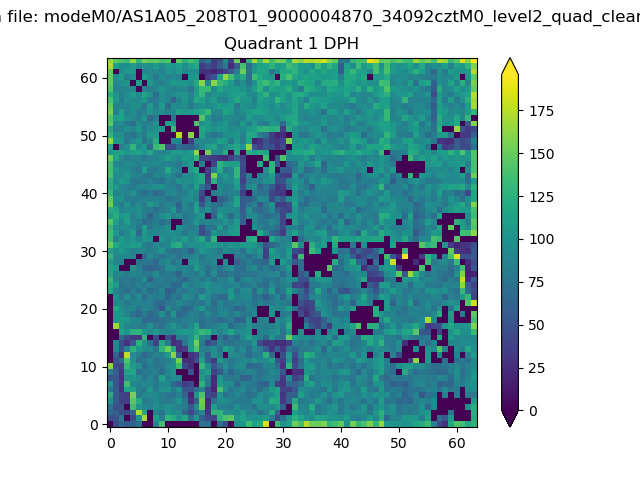 |
Quadrant B |
|---|---|---|---|
| Quadrant D | 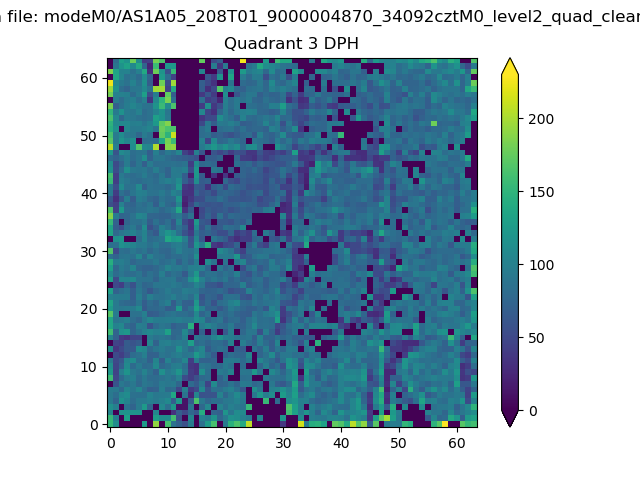 |
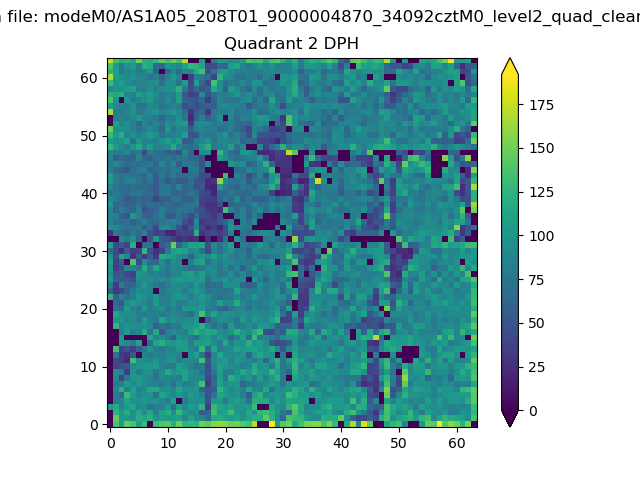 |
Quadrant C |
| Plot type | Count rate plots | Images |
|---|---|---|
| Comparison with Poisson distribution Blue bars denote a histogram of data divided into 1 sec bins. Red curve is a Poisson curve with rate = median count rate of data. |
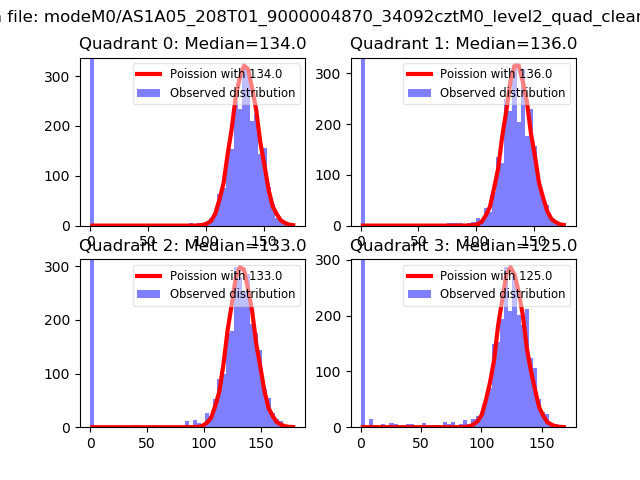 |
 |
| Quadrant-wise count rates Data is divided into 100 sec bins |
 |
|
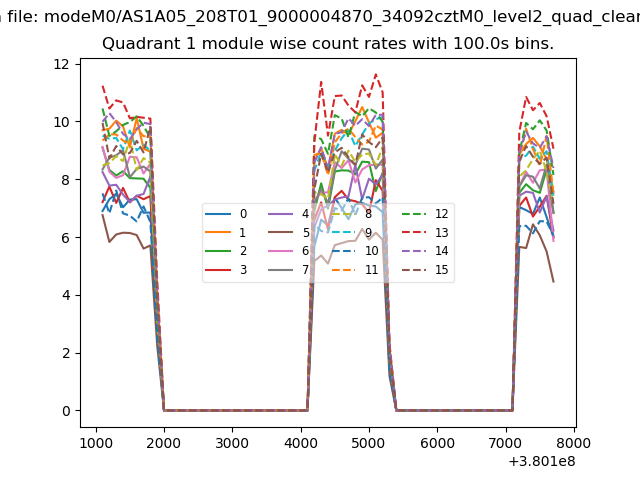
| Module-wise count rates for Quadrant A Data is divided into 100 sec bins |
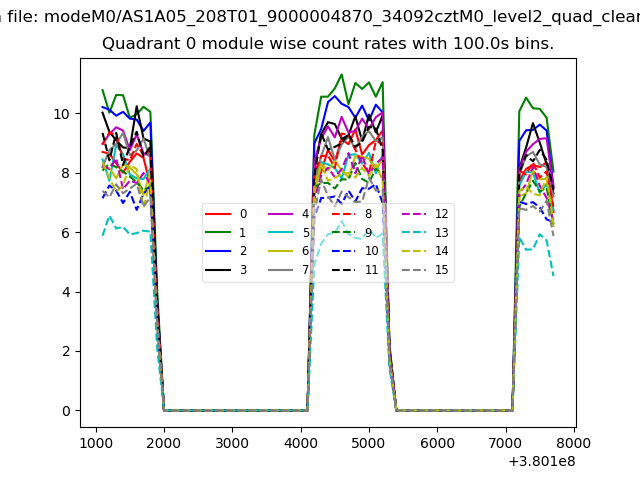 |
 |
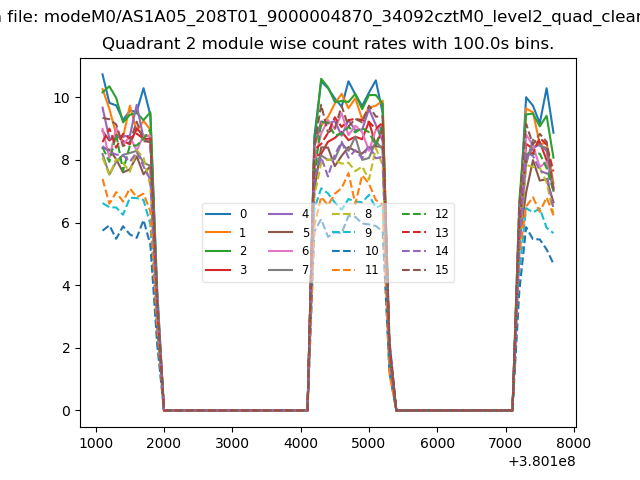
| Module-wise count rates for Quadrant B Data is divided into 100 sec bins |
 |
 |
| Module-wise count rates for Quadrant C Data is divided into 100 sec bins |
 |
 |
| Module-wise count rates for Quadrant D Data is divided into 100 sec bins |
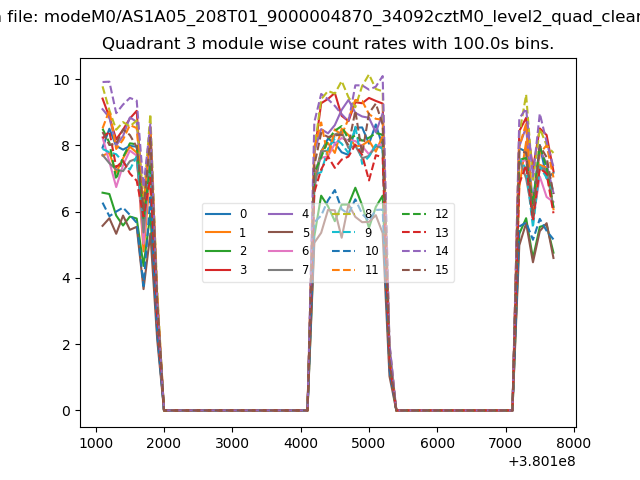 |
 |
| Parameter | Plot |
|---|---|
| CZT HV Monitor | 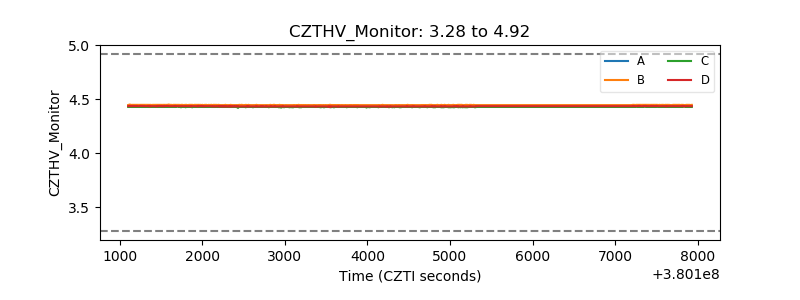 |
| D_VDD | 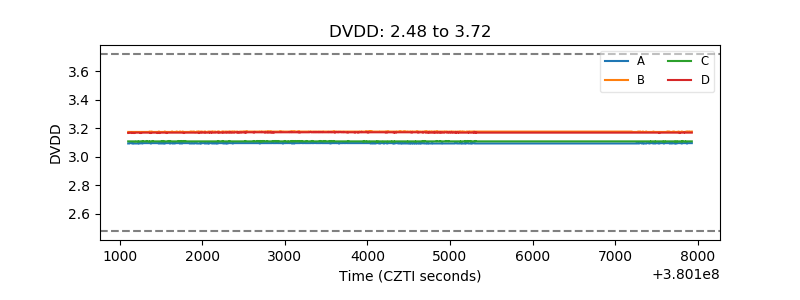 |
| Temperature 1 | 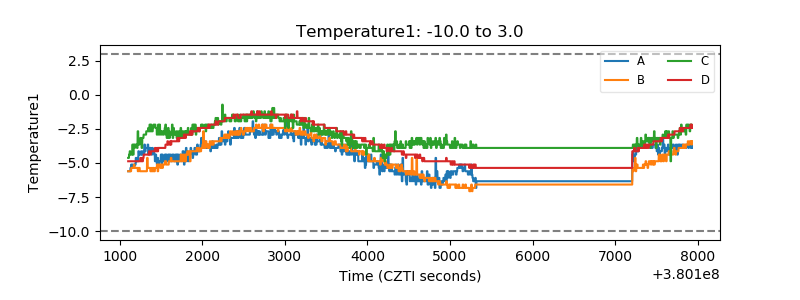 |
| Veto HV Monitor | 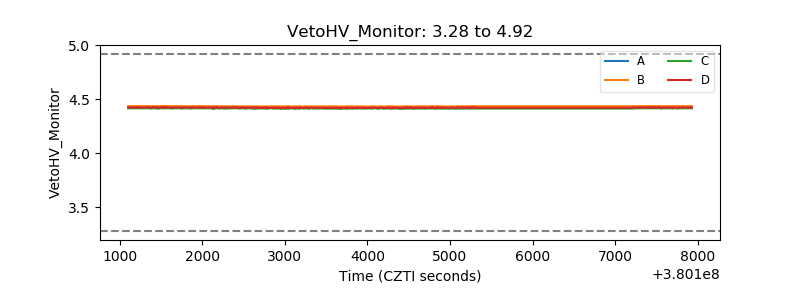 |
| Veto LLD |  |
| Alpha Counter | 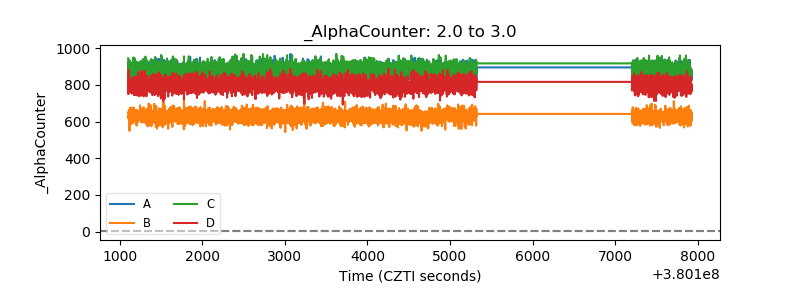 |
| _CPM_Rate | 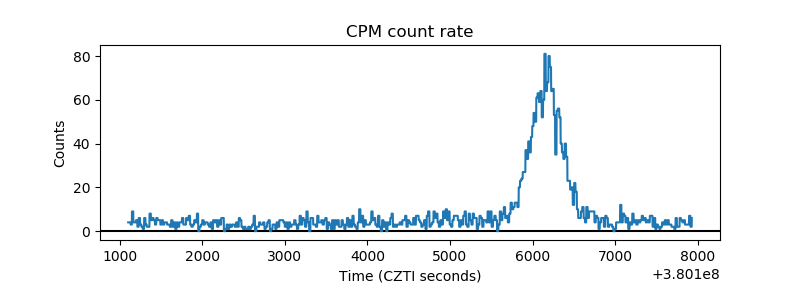 |
| CZT Counter | 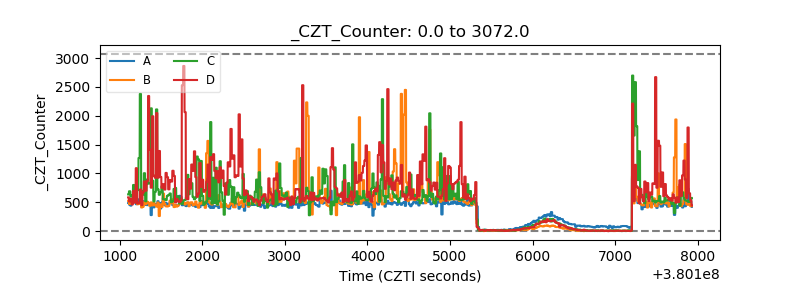 |
| +2.5 Volts monitor |  |
| +5 Volts monitor |  |
| _ROLL_ROT | 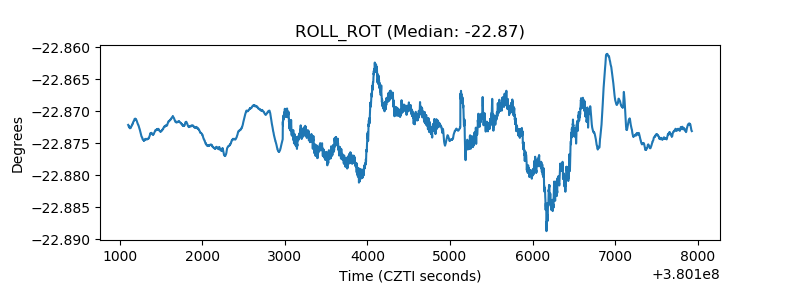 |
| _Roll_DEC | 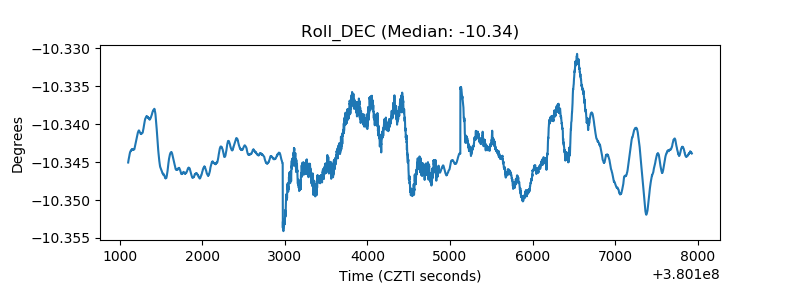 |
| _Roll_RA | 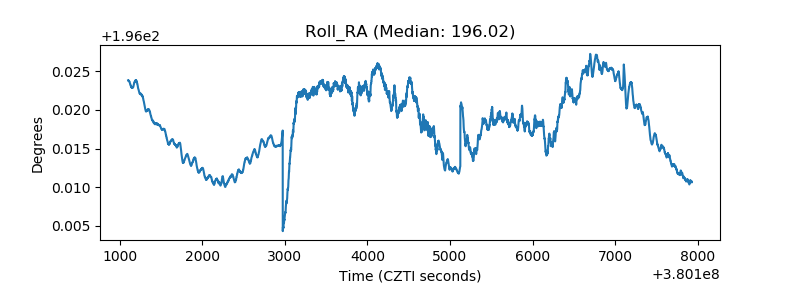 |
| Veto Counter | 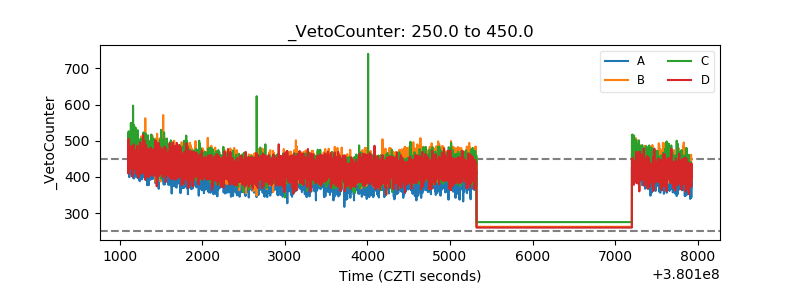 |