| Param | Original file | Final file |
|---|---|---|
| Filename | modeM0/AS1A05_208T01_9000004870_34094cztM0_level2.evt | modeM0/AS1A05_208T01_9000004870_34094cztM0_level2_quad_clean.evt |
| Size (bytes) | 510,180,480 | 57,594,240 |
| Size | 486.5 MB | 54.9 MB |
| Events in quadrant A | 2,701,055 | 342,055 |
| Events in quadrant B | 3,482,615 | 338,902 |
| Events in quadrant C | 3,595,195 | 334,590 |
| Events in quadrant D | 5,275,187 | 318,826 |
| Mode SS | |||
|---|---|---|---|
| Quadrant | BADHDUFLAG | Total packets | Discarded packets |
| A | 0 | 118 | 0 |
| B | 0 | 118 | 0 |
| C | 0 | 118 | 0 |
| D | 0 | 118 | 0 |
| Mode M9 | |||
|---|---|---|---|
| Quadrant | BADHDUFLAG | Total packets | Discarded packets |
| A | 0 | 18 | 0 |
| B | 0 | 18 | 0 |
| C | 0 | 18 | 0 |
| D | 0 | 19 | 0 |
| Mode M0 | |||
|---|---|---|---|
| Quadrant | BADHDUFLAG | Total packets | Discarded packets |
| A | 0 | 11782 | 3 |
| B | 0 | 13915 | 2 |
| C | 0 | 14050 | 2 |
| D | 0 | 19583 | 2 |
| Quadrant | Total seconds | Saturated seconds | Saturation percentage |
|---|---|---|---|
| A | 5858 | 5 | 0.085353% |
| B | 5858 | 170 | 2.902014% |
| C | 5858 | 131 | 2.236258% |
| D | 5858 | 376 | 6.418573% |
Noise dominated data is calculated using 1-second bins in cleaned event files. If a bin has >2000 counts, and if more than 50% of those come from <1% of pixels, then it is considered to be noise-dominated and hence unusable.
| Quadrant | # 1 sec bins | Bins with >0 counts | Bins with >2000 counts | High rate bins dominated by noise | Noise dominated (total time) | Noise dominated (detector-on time) | Marked lightcurve |
|---|---|---|---|---|---|---|---|
| A | 7201 | 5859 | 0 | 0 | 0.00% | 0.00% | 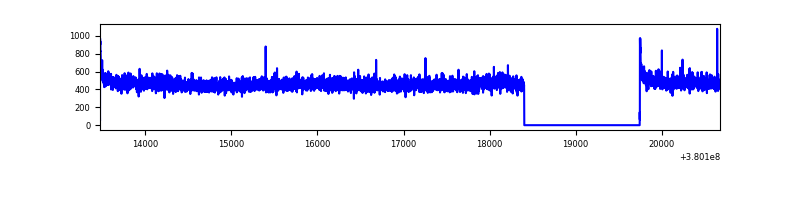 |
| B | 7201 | 5859 | 142 | 142 | 1.97% | 2.42% | 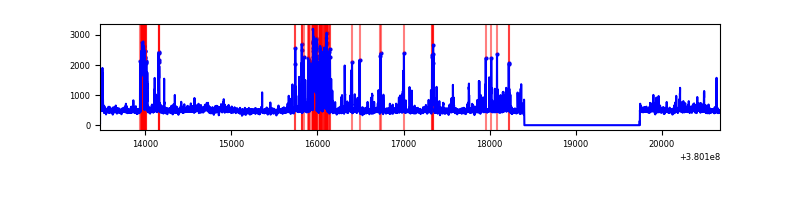 |
| C | 7201 | 5859 | 111 | 111 | 1.54% | 1.89% | 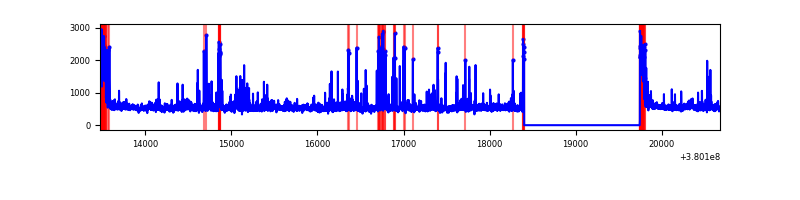 |
| D | 7201 | 5859 | 330 | 330 | 4.58% | 5.63% | 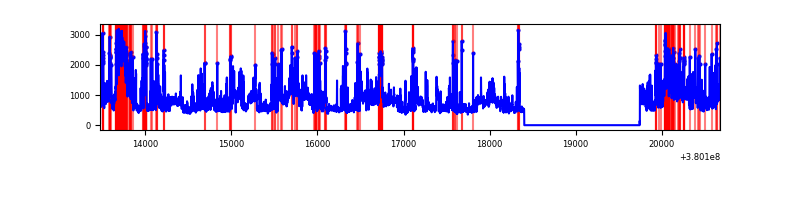 |
Top three noisy pixels from each quadrant. If the there are fewer than three noisy pixels in the level2.evt file, extra rows are filled as -1
| Pixel properties | Quadrant properties | ||||||
|---|---|---|---|---|---|---|---|
| Quadrant | DetID | PixID | Counts | Sigma | Mean | Median | Sigma |
| A | 10 | 83 | 20339 | 140.21 | 690 | 676 | 140.2 |
| A | 13 | 6 | 12561 | 84.75 | 690 | 676 | 140.2 |
| A | 13 | 254 | 10807 | 72.24 | 690 | 676 | 140.2 |
| B | 5 | 172 | 668549 | 5089.8 | 680 | 662 | 131.2 |
| B | 0 | 190 | 42896 | 321.85 | 680 | 662 | 131.2 |
| B | 4 | 232 | 30123 | 224.51 | 680 | 662 | 131.2 |
| C | 0 | 10 | 461866 | 2936.38 | 669 | 674 | 157.1 |
| C | 15 | 214 | 251975 | 1600.02 | 669 | 674 | 157.1 |
| C | 0 | 207 | 216615 | 1374.88 | 669 | 674 | 157.1 |
| D | 8 | 195 | 1079193 | 6635.75 | 656 | 637 | 162.5 |
| D | 2 | 250 | 605359 | 3720.52 | 656 | 637 | 162.5 |
| D | 7 | 223 | 479998 | 2949.24 | 656 | 637 | 162.5 |
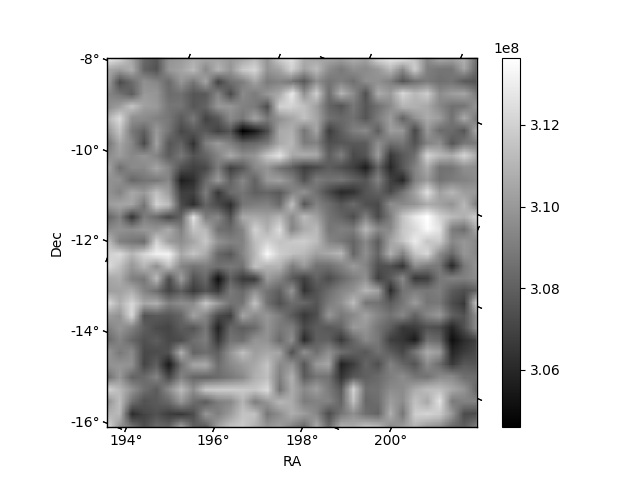
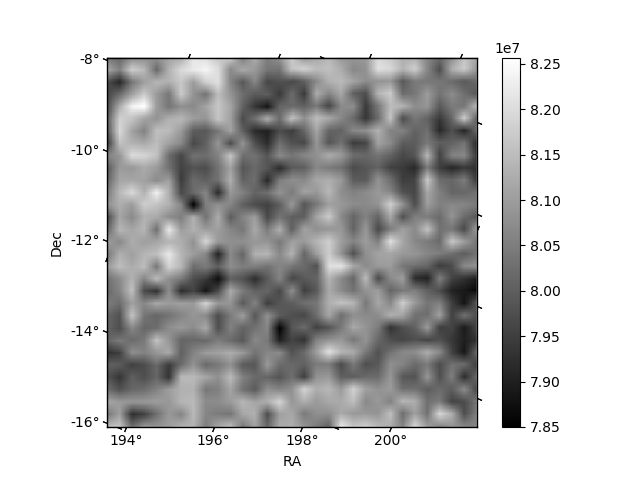
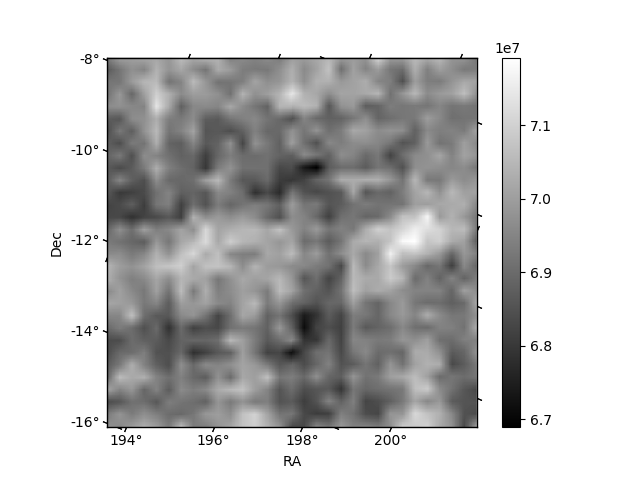
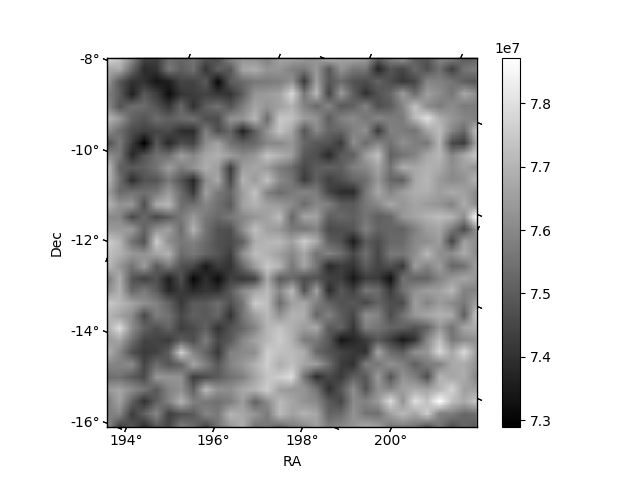
Histogram calculated using DETX and DETY for each event in the final _common_clean file
| Quadrant A |  |
 |
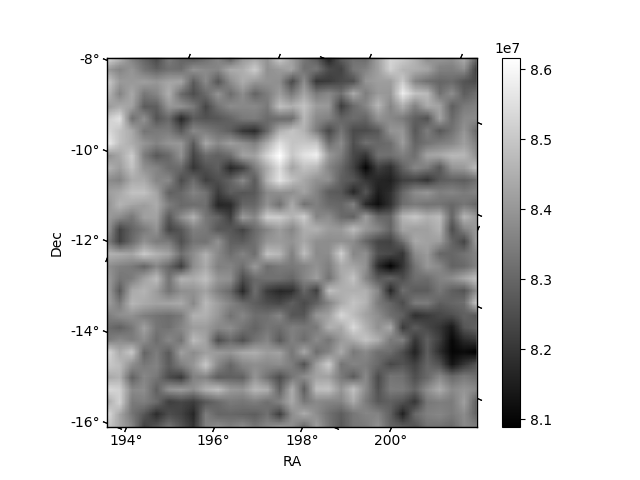
Quadrant B |
|---|---|---|---|
| Quadrant D |  |
 |
Quadrant C |
| Plot type | Count rate plots | Images |
|---|---|---|
| Comparison with Poisson distribution Blue bars denote a histogram of data divided into 1 sec bins. Red curve is a Poisson curve with rate = median count rate of data. |
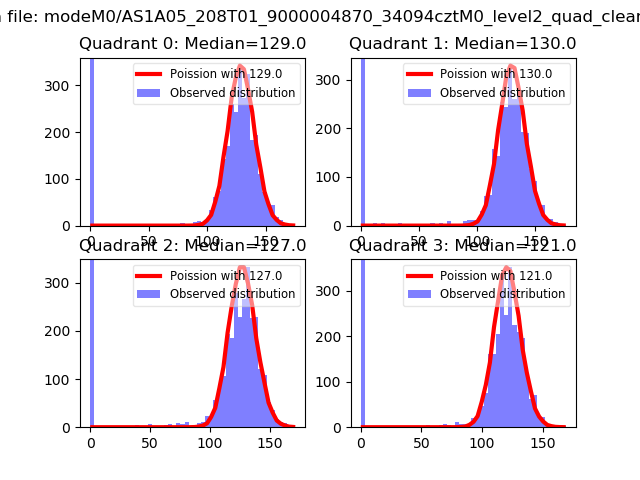 |
 |
| Quadrant-wise count rates Data is divided into 100 sec bins |
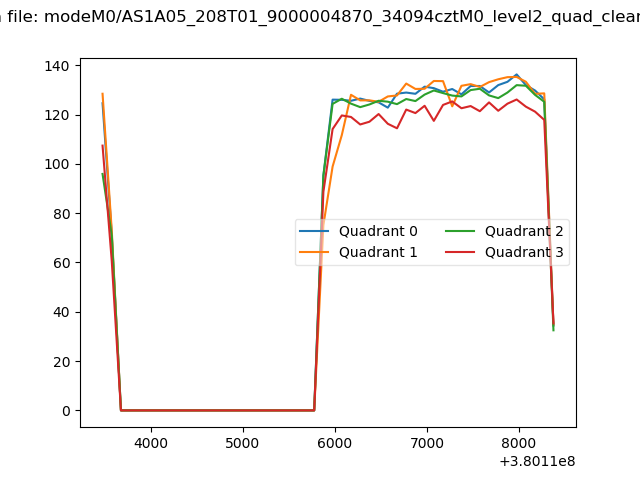 |
|
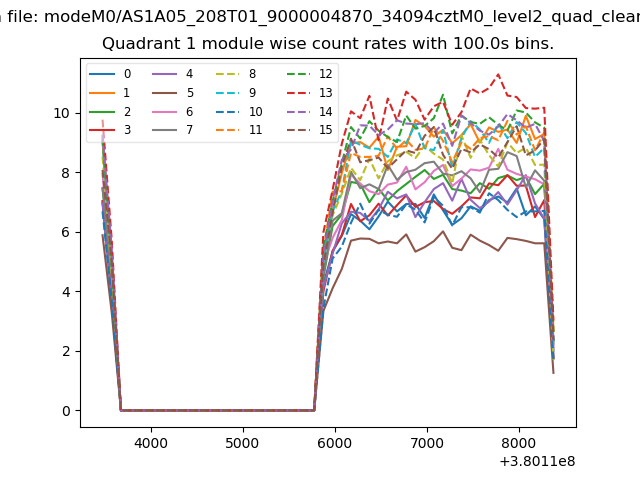
| Module-wise count rates for Quadrant A Data is divided into 100 sec bins |
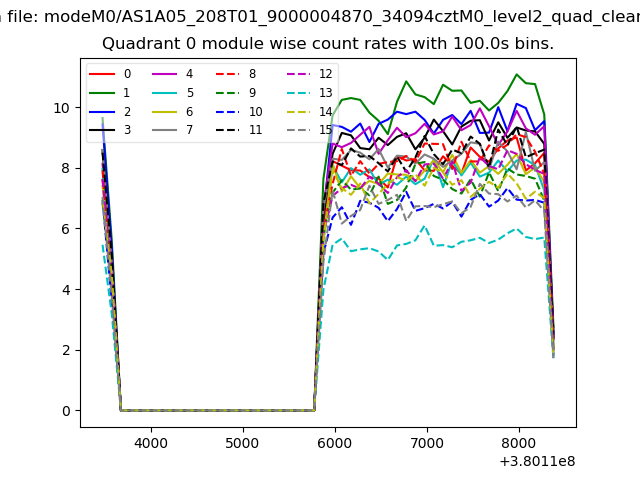 |
 |
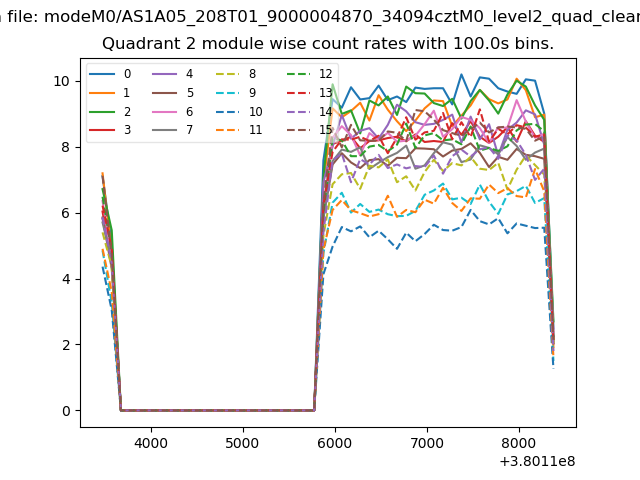
| Module-wise count rates for Quadrant B Data is divided into 100 sec bins |
 |
 |
| Module-wise count rates for Quadrant C Data is divided into 100 sec bins |
 |
 |
| Module-wise count rates for Quadrant D Data is divided into 100 sec bins |
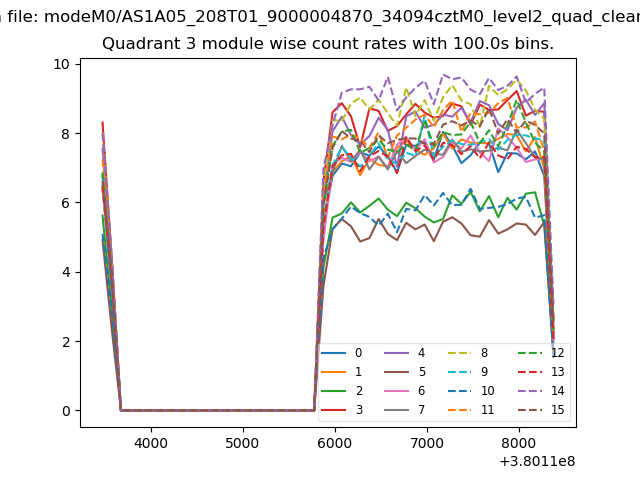 |
 |
| Parameter | Plot |
|---|---|
| CZT HV Monitor | 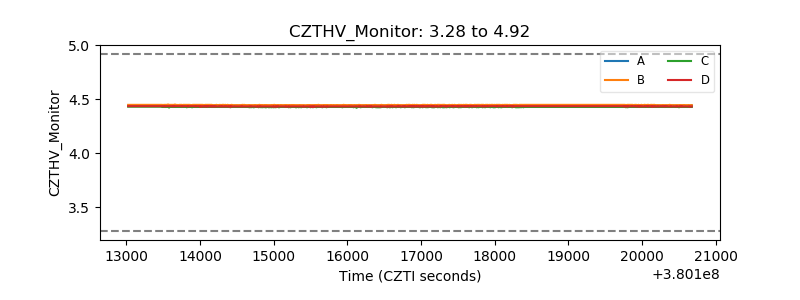 |
| D_VDD | 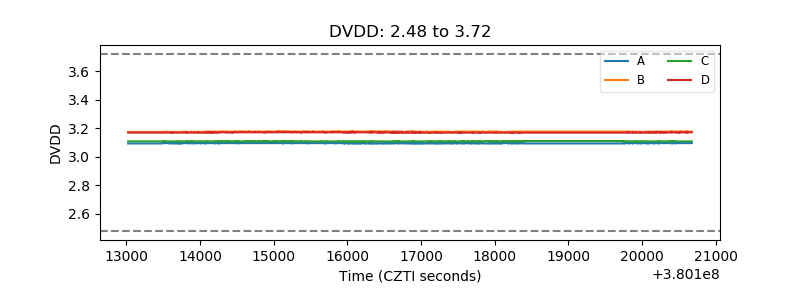 |
| Temperature 1 | 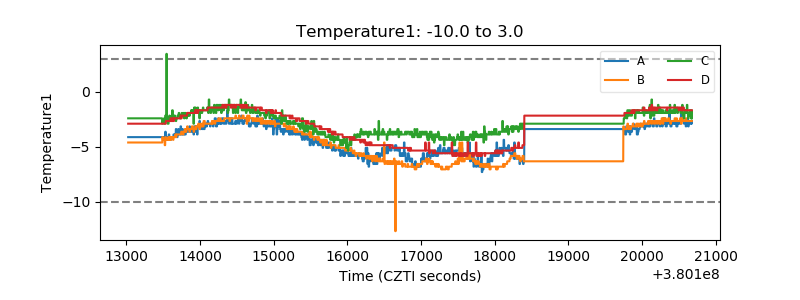 |
| Veto HV Monitor |  |
| Veto LLD | 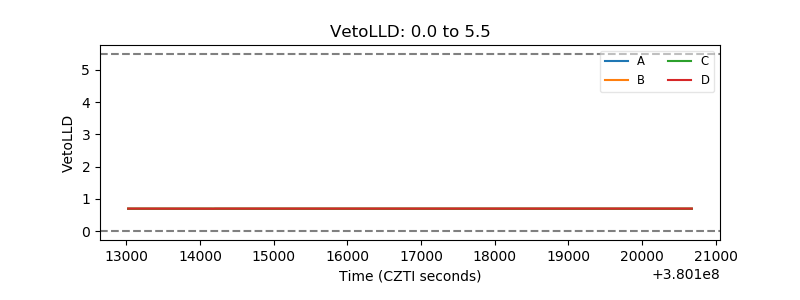 |
| Alpha Counter | 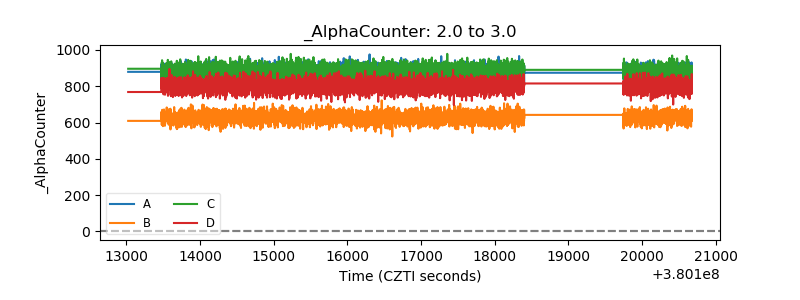 |
| _CPM_Rate | 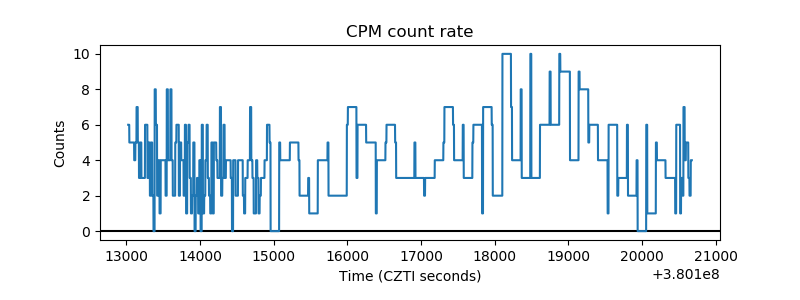 |
| CZT Counter | 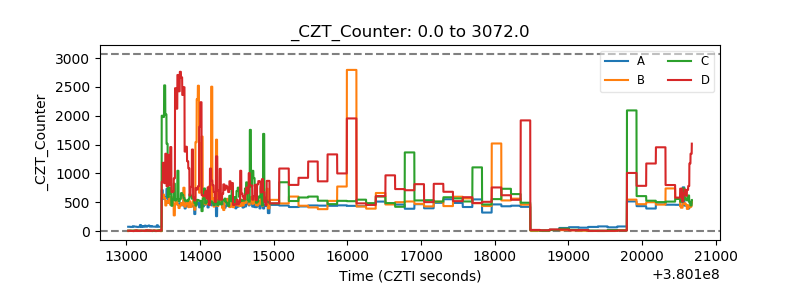 |
| +2.5 Volts monitor |  |
| +5 Volts monitor | 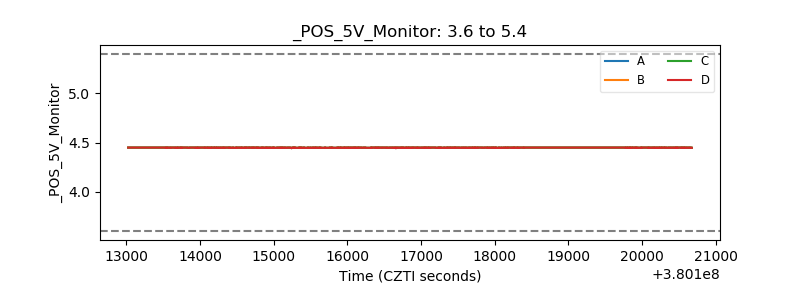 |
| _ROLL_ROT | 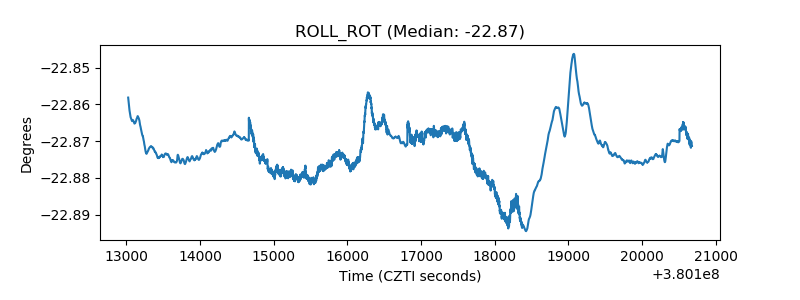 |
| _Roll_DEC |  |
| _Roll_RA | 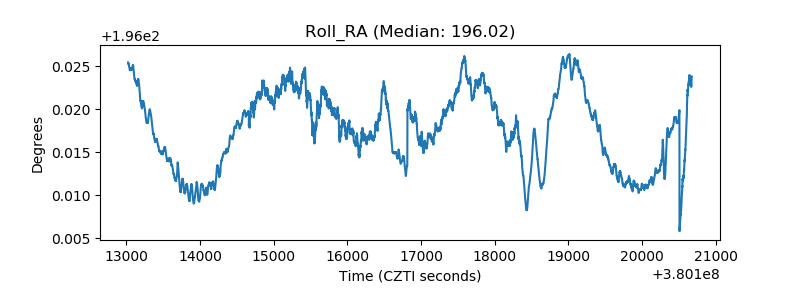 |
| Veto Counter | 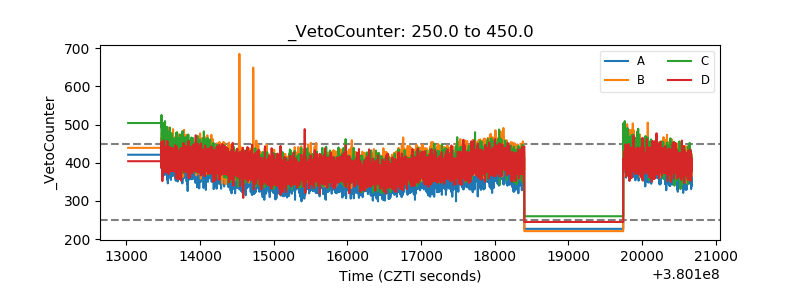 |