| Param | Original file | Final file |
|---|---|---|
| Filename | modeM0/AS1A05_208T01_9000004870_34098cztM0_level2.evt | modeM0/AS1A05_208T01_9000004870_34098cztM0_level2_quad_clean.evt |
| Size (bytes) | 1,285,130,880 | 180,264,960 |
| Size | 1.2 GB | 171.9 MB |
| Events in quadrant A | 5,915,525 | 1,187,120 |
| Events in quadrant B | 9,101,477 | 1,147,799 |
| Events in quadrant C | 7,166,878 | 1,179,176 |
| Events in quadrant D | 15,852,616 | 1,038,466 |
| Mode SS | |||
|---|---|---|---|
| Quadrant | BADHDUFLAG | Total packets | Discarded packets |
| A | 0 | 266 | 0 |
| B | 0 | 266 | 0 |
| C | 0 | 266 | 0 |
| D | 0 | 266 | 0 |
| Mode M9 | |||
|---|---|---|---|
| Quadrant | BADHDUFLAG | Total packets | Discarded packets |
| A | 0 | 29 | 0 |
| B | 0 | 29 | 0 |
| C | 0 | 29 | 0 |
| D | 0 | 30 | 0 |
| Mode M0 | |||
|---|---|---|---|
| Quadrant | BADHDUFLAG | Total packets | Discarded packets |
| A | 0 | 26495 | 4 |
| B | 0 | 35434 | 3 |
| C | 0 | 29048 | 3 |
| D | 0 | 56125 | 3 |
| Quadrant | Total seconds | Saturated seconds | Saturation percentage |
|---|---|---|---|
| A | 13119 | 13 | 0.099093% |
| B | 13119 | 860 | 6.555378% |
| C | 13119 | 207 | 1.577864% |
| D | 13119 | 2421 | 18.454150% |
Noise dominated data is calculated using 1-second bins in cleaned event files. If a bin has >2000 counts, and if more than 50% of those come from <1% of pixels, then it is considered to be noise-dominated and hence unusable.
| Quadrant | # 1 sec bins | Bins with >0 counts | Bins with >2000 counts | High rate bins dominated by noise | Noise dominated (total time) | Noise dominated (detector-on time) | Marked lightcurve |
|---|---|---|---|---|---|---|---|
| A | 15895 | 13121 | 0 | 0 | 0.00% | 0.00% | 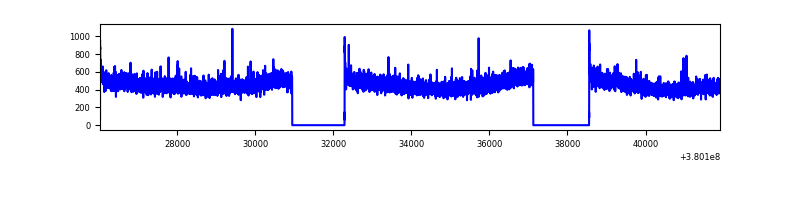 |
| B | 15895 | 13121 | 618 | 618 | 3.89% | 4.71% | 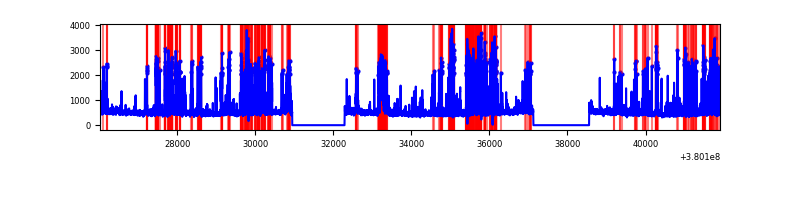 |
| C | 15895 | 13121 | 163 | 163 | 1.03% | 1.24% | 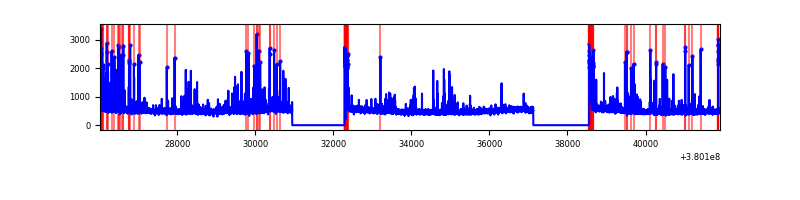 |
| D | 15895 | 13121 | 2411 | 2411 | 15.17% | 18.38% | 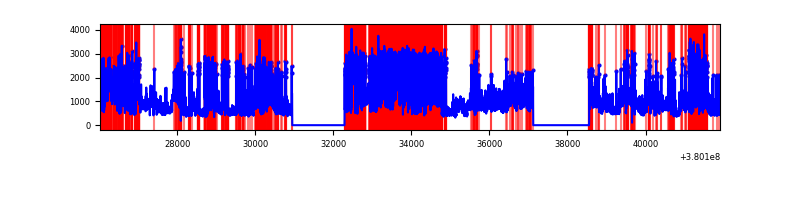 |
Top three noisy pixels from each quadrant. If the there are fewer than three noisy pixels in the level2.evt file, extra rows are filled as -1
| Pixel properties | Quadrant properties | ||||||
|---|---|---|---|---|---|---|---|
| Quadrant | DetID | PixID | Counts | Sigma | Mean | Median | Sigma |
| A | 10 | 83 | 33363 | 105.57 | 1512 | 1482 | 302.0 |
| A | 13 | 254 | 24753 | 77.06 | 1512 | 1482 | 302.0 |
| A | 13 | 6 | 21925 | 67.69 | 1512 | 1482 | 302.0 |
| B | 5 | 172 | 2940402 | 10508.42 | 1465 | 1425 | 279.7 |
| B | 4 | 232 | 171089 | 606.64 | 1465 | 1425 | 279.7 |
| B | 0 | 219 | 64470 | 225.42 | 1465 | 1425 | 279.7 |
| C | 0 | 10 | 705275 | 2048.86 | 1471 | 1482 | 343.5 |
| C | 15 | 214 | 557557 | 1618.83 | 1471 | 1482 | 343.5 |
| C | 0 | 207 | 84331 | 241.19 | 1471 | 1482 | 343.5 |
| D | 7 | 223 | 5193011 | 15593.68 | 1362 | 1327 | 332.9 |
| D | 8 | 195 | 2776843 | 8336.5 | 1362 | 1327 | 332.9 |
| D | 2 | 250 | 745604 | 2235.5 | 1362 | 1327 | 332.9 |
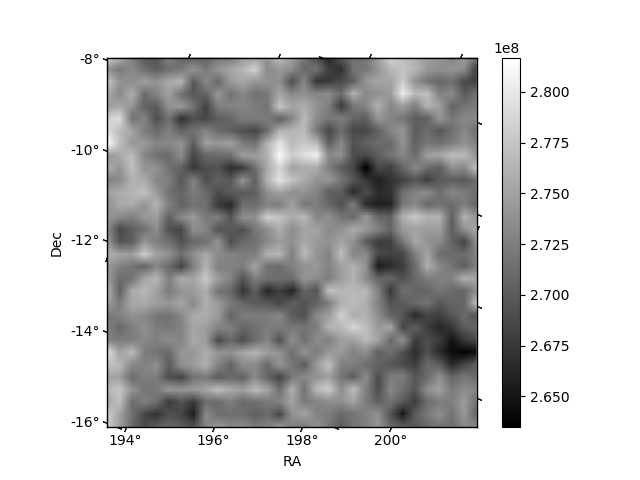
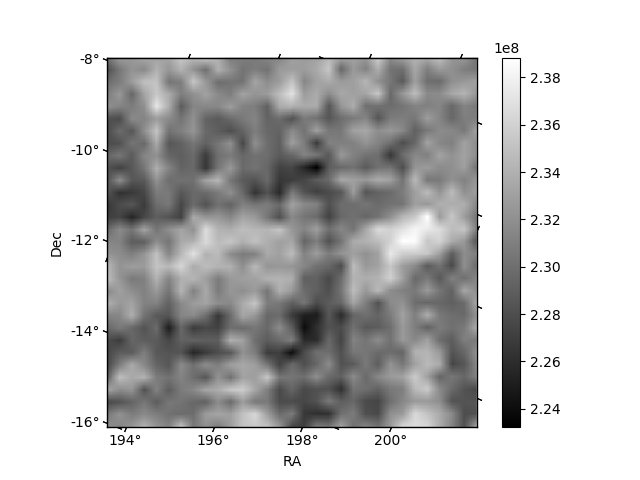
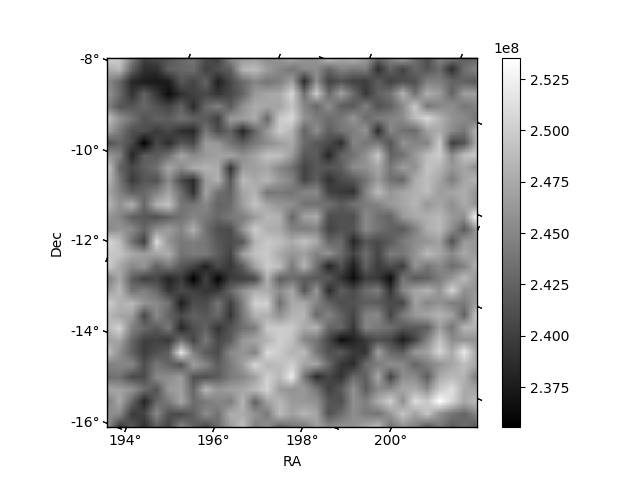
Histogram calculated using DETX and DETY for each event in the final _common_clean file
| Quadrant A |  |
 |
Quadrant B |
|---|---|---|---|
| Quadrant D |  |
 |
Quadrant C |
| Plot type | Count rate plots | Images |
|---|---|---|
| Comparison with Poisson distribution Blue bars denote a histogram of data divided into 1 sec bins. Red curve is a Poisson curve with rate = median count rate of data. |
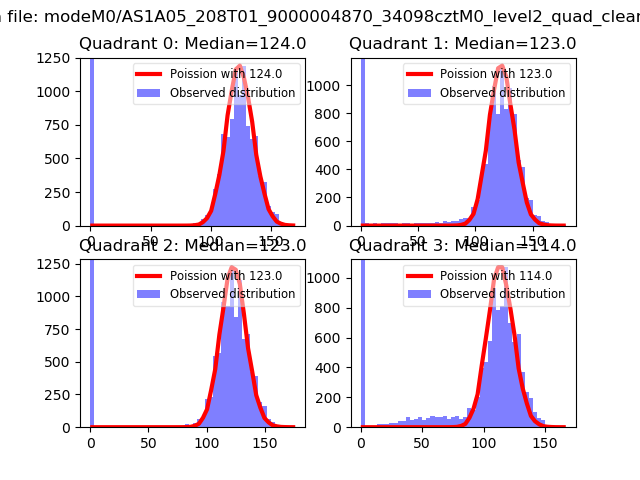 |
 |
| Quadrant-wise count rates Data is divided into 100 sec bins |
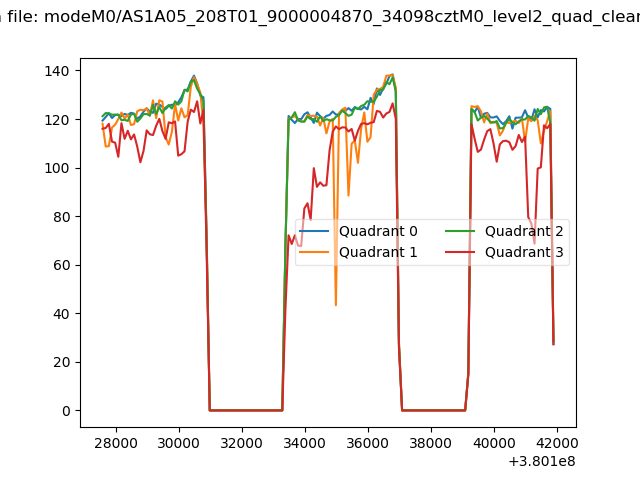 |
|
| Module-wise count rates for Quadrant A Data is divided into 100 sec bins |
 |
 |
| Module-wise count rates for Quadrant B Data is divided into 100 sec bins |
 |
 |
| Module-wise count rates for Quadrant C Data is divided into 100 sec bins |
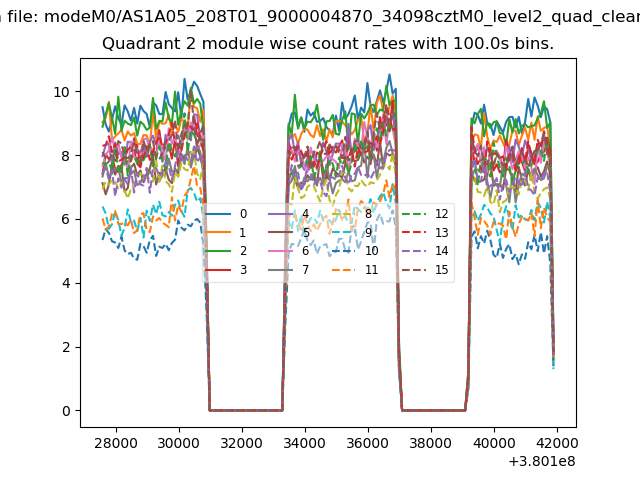 |
 |
| Module-wise count rates for Quadrant D Data is divided into 100 sec bins |
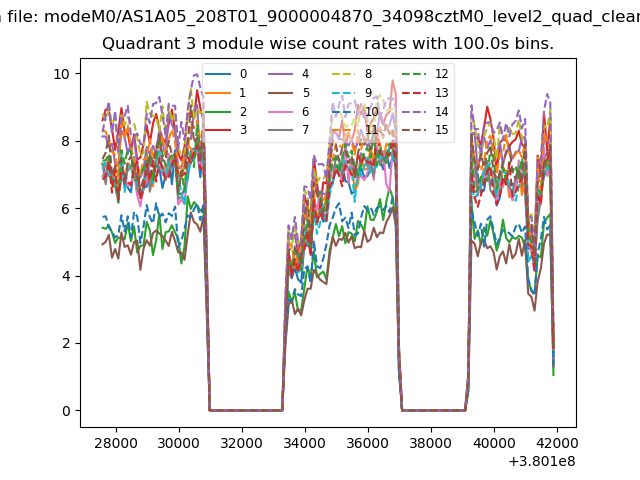 |
 |
| Parameter | Plot |
|---|---|
| CZT HV Monitor | 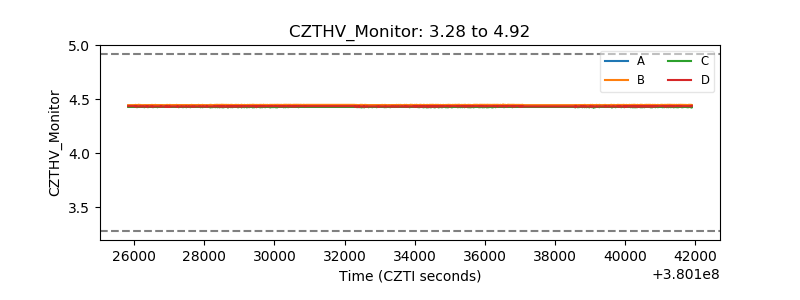 |
| D_VDD | 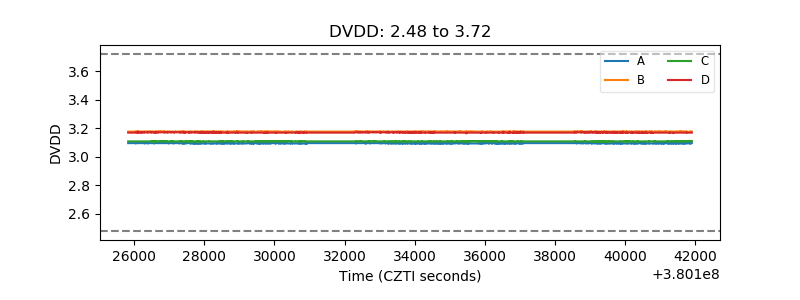 |
| Temperature 1 | 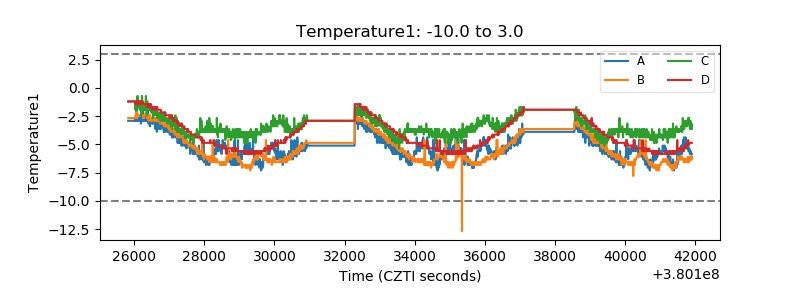 |
| Veto HV Monitor | 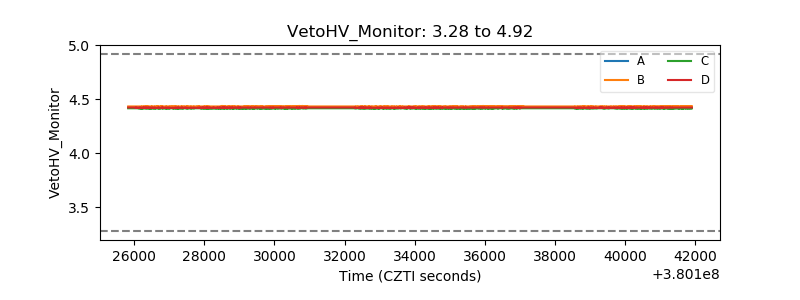 |
| Veto LLD | 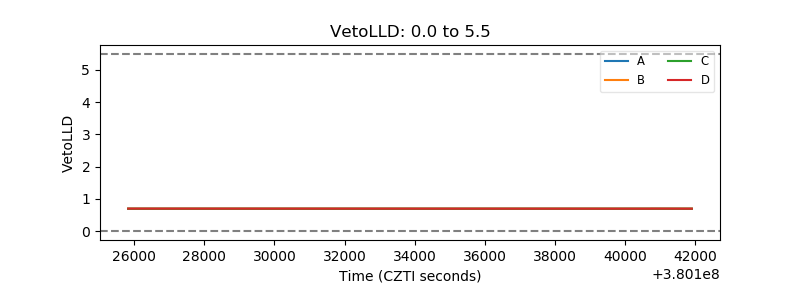 |
| Alpha Counter | 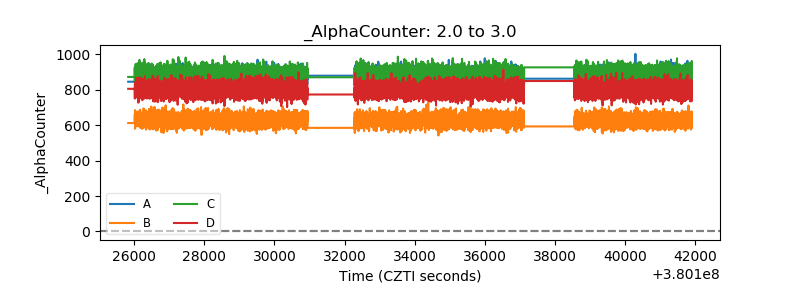 |
| _CPM_Rate | 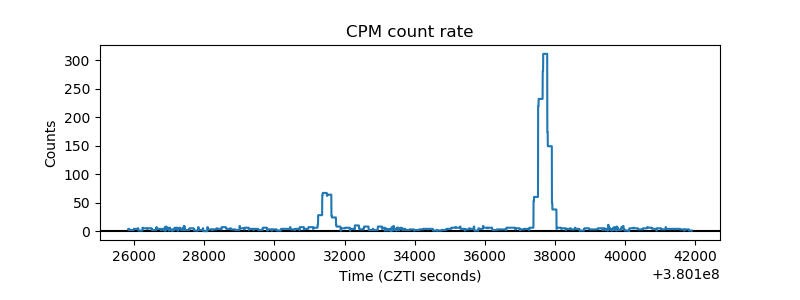 |
| CZT Counter | 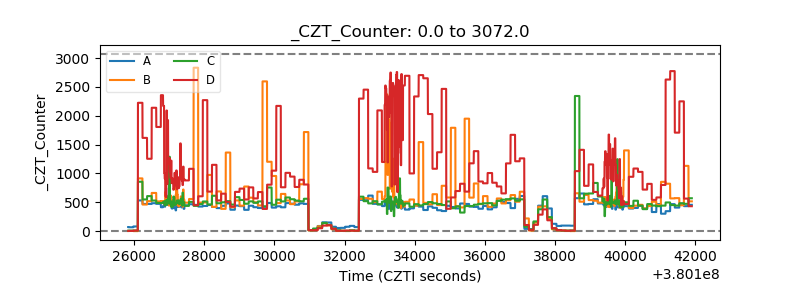 |
| +2.5 Volts monitor |  |
| +5 Volts monitor |  |
| _ROLL_ROT | 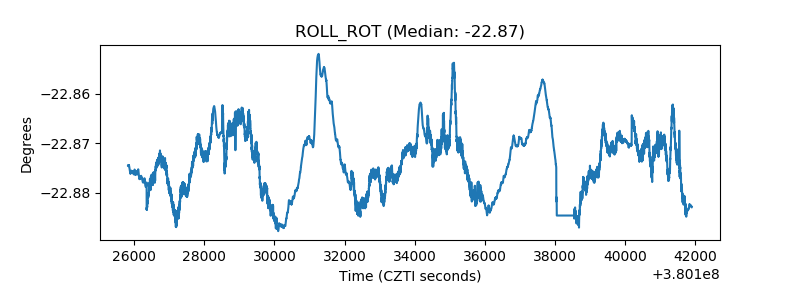 |
| _Roll_DEC | 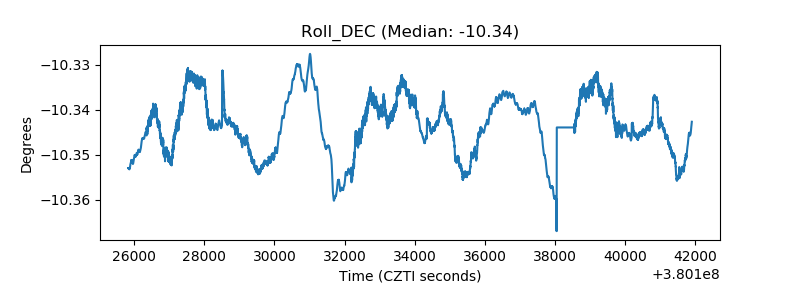 |
| _Roll_RA | 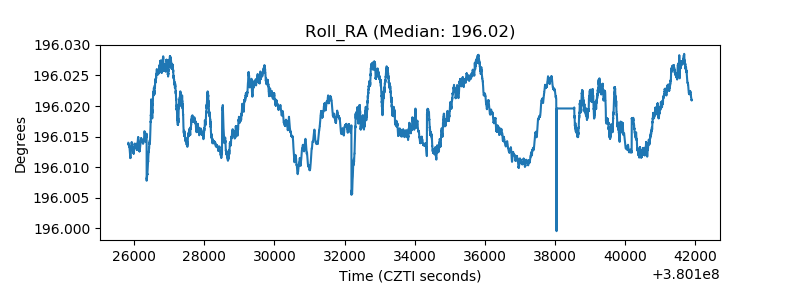 |
| Veto Counter | 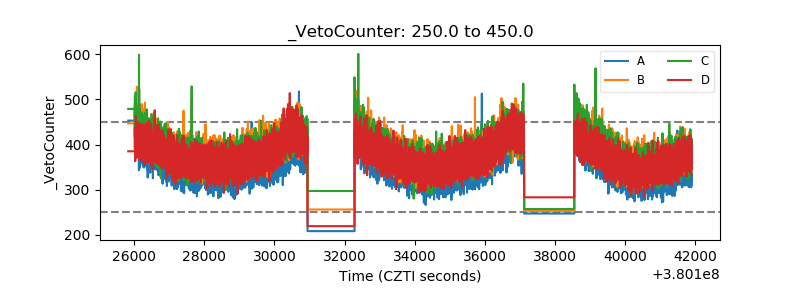 |