| Param | Original file | Final file |
|---|---|---|
| Filename | modeM0/AS1A05_208T01_9000004870_34099cztM0_level2.evt | modeM0/AS1A05_208T01_9000004870_34099cztM0_level2_quad_clean.evt |
| Size (bytes) | 774,475,200 | 118,730,880 |
| Size | 738.6 MB | 113.2 MB |
| Events in quadrant A | 3,569,474 | 794,515 |
| Events in quadrant B | 5,540,018 | 790,275 |
| Events in quadrant C | 5,292,492 | 781,203 |
| Events in quadrant D | 8,533,226 | 693,968 |
| Mode SS | |||
|---|---|---|---|
| Quadrant | BADHDUFLAG | Total packets | Discarded packets |
| A | 0 | 156 | 0 |
| B | 0 | 156 | 0 |
| C | 0 | 156 | 0 |
| D | 0 | 156 | 0 |
| Mode M9 | |||
|---|---|---|---|
| Quadrant | BADHDUFLAG | Total packets | Discarded packets |
| A | 0 | 33 | 0 |
| B | 0 | 33 | 0 |
| C | 0 | 33 | 0 |
| D | 0 | 33 | 0 |
| Mode M0 | |||
|---|---|---|---|
| Quadrant | BADHDUFLAG | Total packets | Discarded packets |
| A | 0 | 15654 | 2 |
| B | 0 | 21480 | 1 |
| C | 0 | 20602 | 1 |
| D | 0 | 30632 | 1 |
| Quadrant | Total seconds | Saturated seconds | Saturation percentage |
|---|---|---|---|
| A | 7705 | 6 | 0.077872% |
| B | 7705 | 573 | 7.436729% |
| C | 7705 | 346 | 4.490591% |
| D | 7705 | 954 | 12.381570% |
Noise dominated data is calculated using 1-second bins in cleaned event files. If a bin has >2000 counts, and if more than 50% of those come from <1% of pixels, then it is considered to be noise-dominated and hence unusable.
| Quadrant | # 1 sec bins | Bins with >0 counts | Bins with >2000 counts | High rate bins dominated by noise | Noise dominated (total time) | Noise dominated (detector-on time) | Marked lightcurve |
|---|---|---|---|---|---|---|---|
| A | 10931 | 7707 | 0 | 0 | 0.00% | 0.00% | 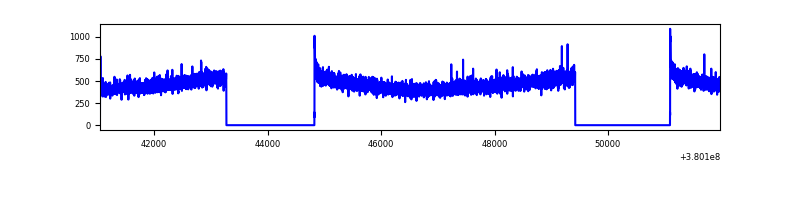 |
| B | 10931 | 7707 | 373 | 373 | 3.41% | 4.84% | 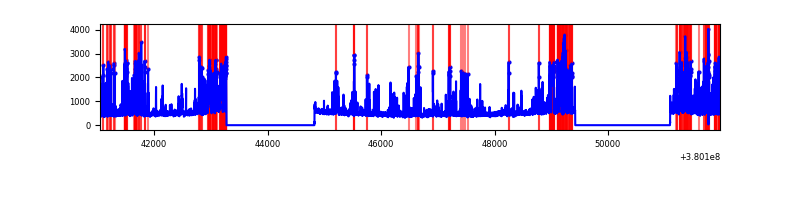 |
| C | 10931 | 7707 | 280 | 280 | 2.56% | 3.63% | 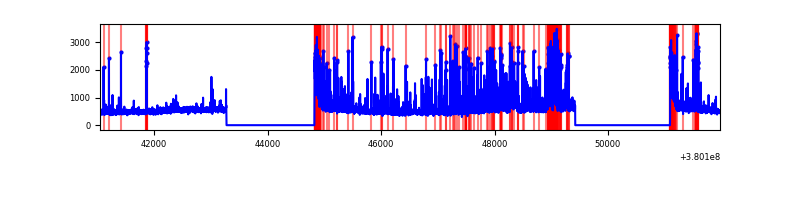 |
| D | 10931 | 7707 | 1006 | 1006 | 9.20% | 13.05% | 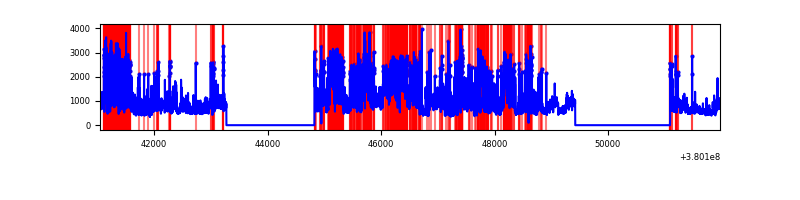 |
Top three noisy pixels from each quadrant. If the there are fewer than three noisy pixels in the level2.evt file, extra rows are filled as -1
| Pixel properties | Quadrant properties | ||||||
|---|---|---|---|---|---|---|---|
| Quadrant | DetID | PixID | Counts | Sigma | Mean | Median | Sigma |
| A | 10 | 83 | 21551 | 113.8 | 915 | 898 | 181.5 |
| A | 13 | 254 | 14299 | 73.84 | 915 | 898 | 181.5 |
| A | 13 | 6 | 11268 | 57.14 | 915 | 898 | 181.5 |
| B | 5 | 172 | 1772696 | 10379.44 | 884 | 864 | 170.7 |
| B | 4 | 232 | 79223 | 459.03 | 884 | 864 | 170.7 |
| B | 0 | 245 | 56474 | 325.76 | 884 | 864 | 170.7 |
| C | 0 | 10 | 1130186 | 5533.22 | 878 | 886 | 204.1 |
| C | 15 | 214 | 324374 | 1584.99 | 878 | 886 | 204.1 |
| C | 14 | 254 | 215199 | 1050.07 | 878 | 886 | 204.1 |
| D | 7 | 223 | 2179500 | 10468.7 | 848 | 827 | 208.1 |
| D | 8 | 195 | 1373266 | 6594.68 | 848 | 827 | 208.1 |
| D | 13 | 249 | 809434 | 3885.42 | 848 | 827 | 208.1 |
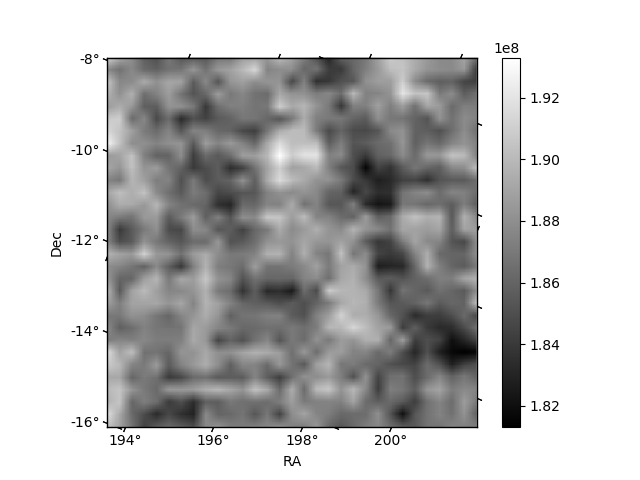
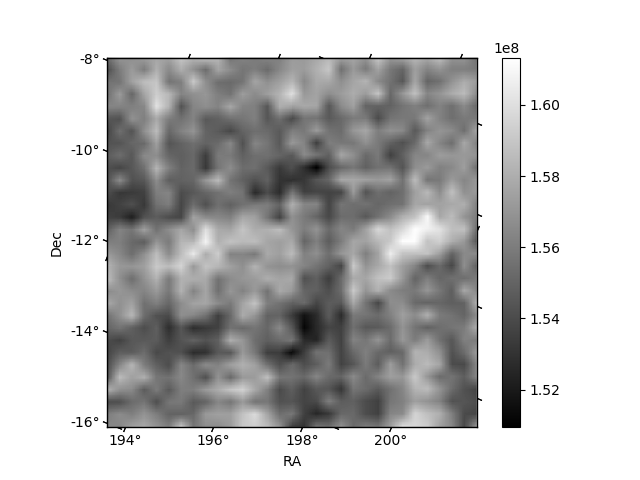
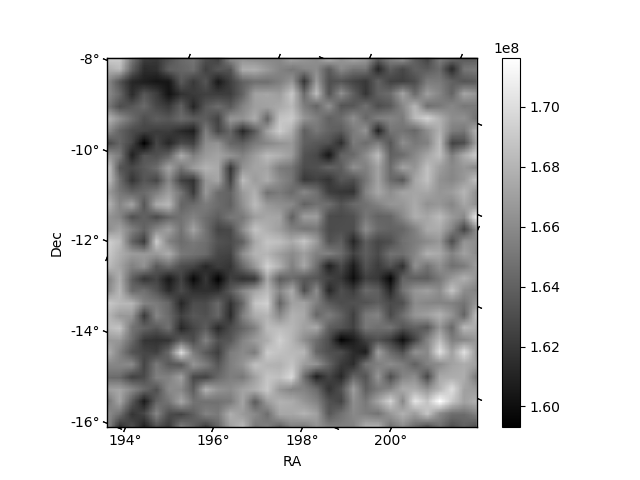
Histogram calculated using DETX and DETY for each event in the final _common_clean file
| Quadrant A | 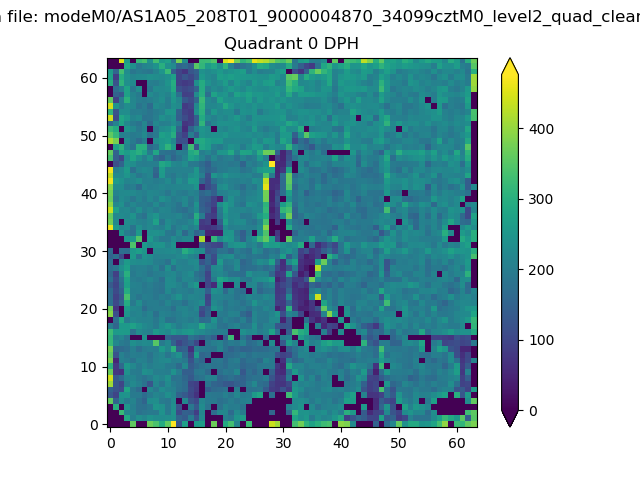 |
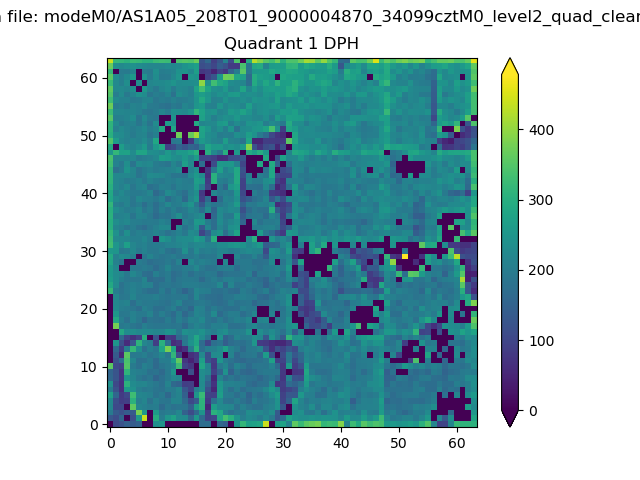 |
Quadrant B |
|---|---|---|---|
| Quadrant D | 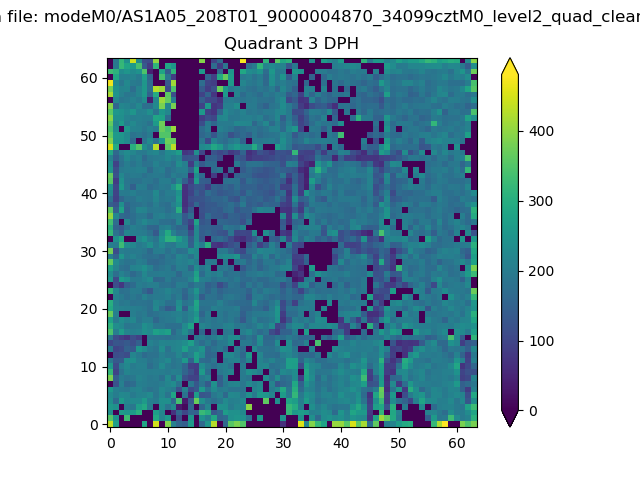 |
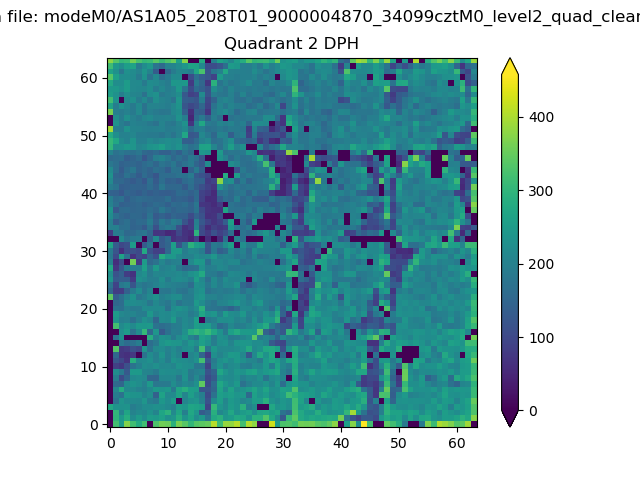 |
Quadrant C |
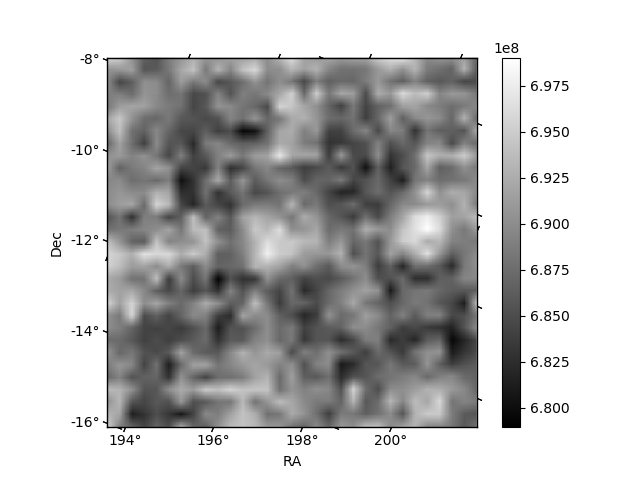
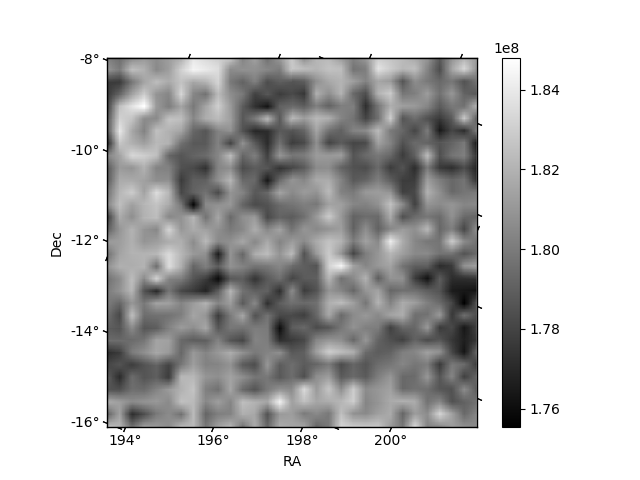
| Plot type | Count rate plots | Images |
|---|---|---|
| Comparison with Poisson distribution Blue bars denote a histogram of data divided into 1 sec bins. Red curve is a Poisson curve with rate = median count rate of data. |
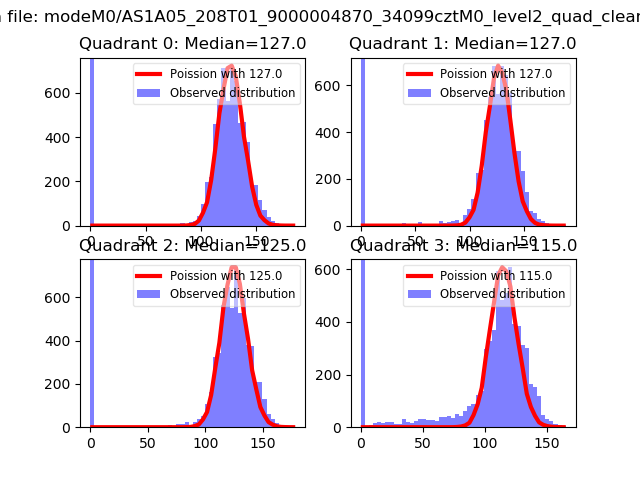 |
 |
| Quadrant-wise count rates Data is divided into 100 sec bins |
 |
|
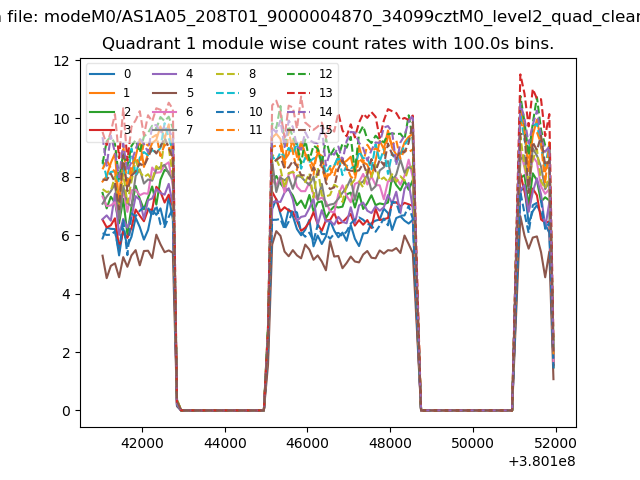
| Module-wise count rates for Quadrant A Data is divided into 100 sec bins |
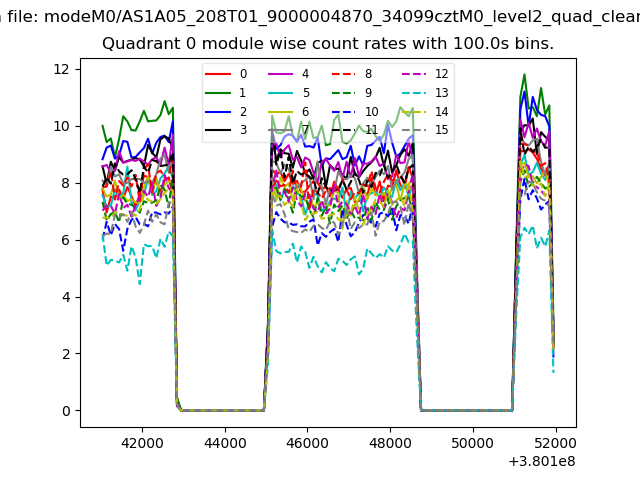 |
 |
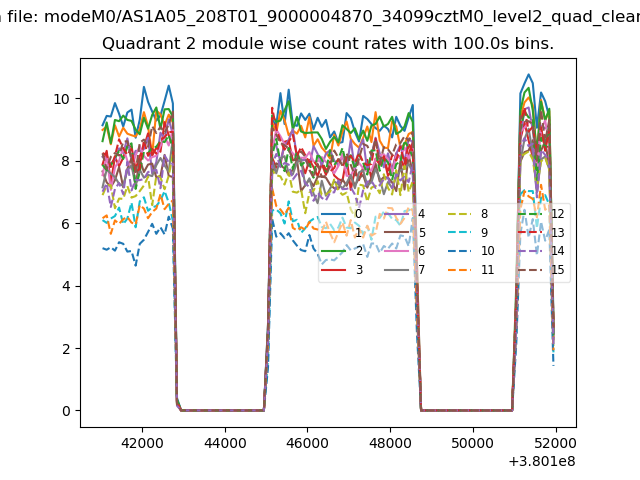
| Module-wise count rates for Quadrant B Data is divided into 100 sec bins |
 |
 |
| Module-wise count rates for Quadrant C Data is divided into 100 sec bins |
 |
 |
| Module-wise count rates for Quadrant D Data is divided into 100 sec bins |
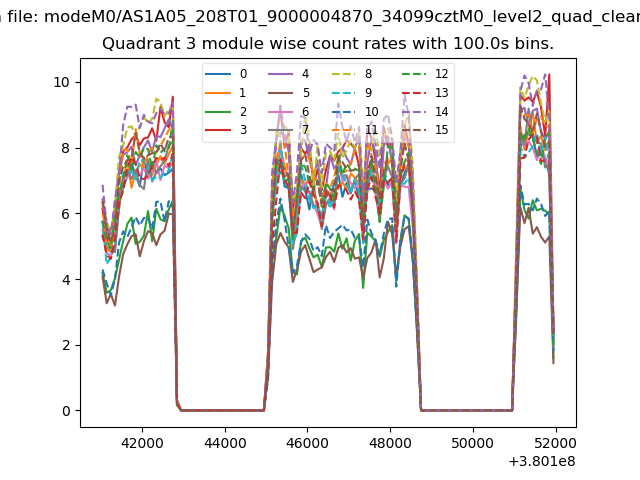 |
 |
| Parameter | Plot |
|---|---|
| CZT HV Monitor | 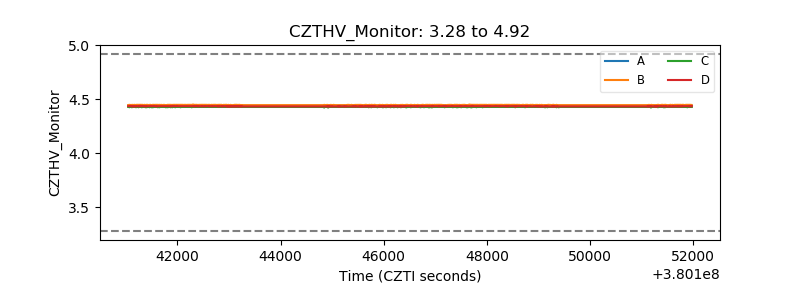 |
| D_VDD | 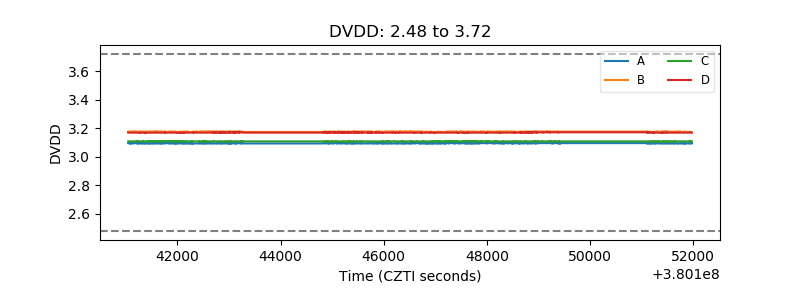 |
| Temperature 1 | 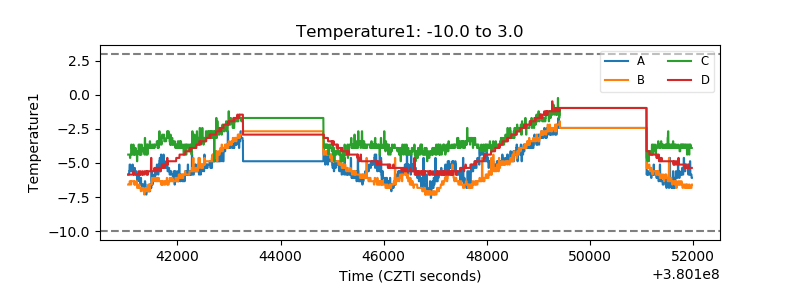 |
| Veto HV Monitor | 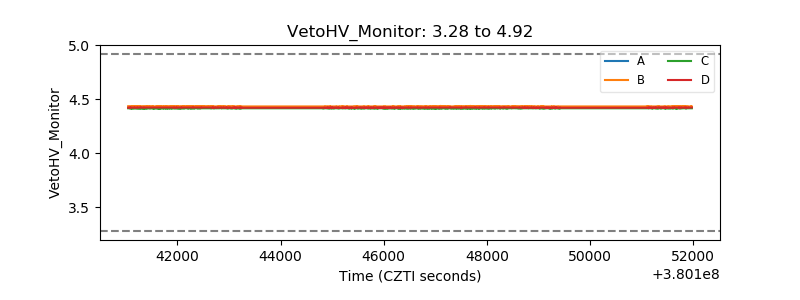 |
| Veto LLD | 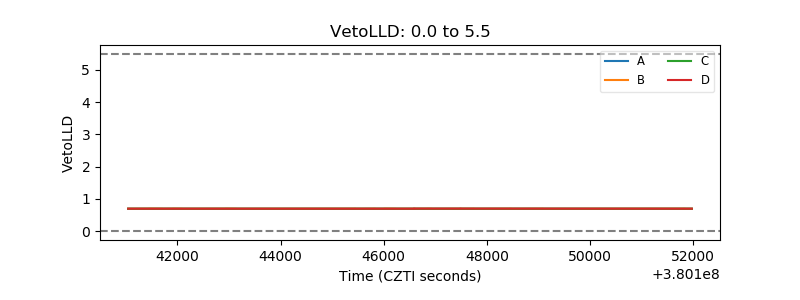 |
| Alpha Counter | 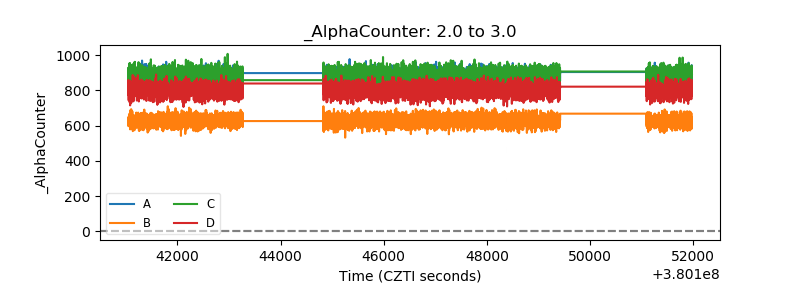 |
| _CPM_Rate | 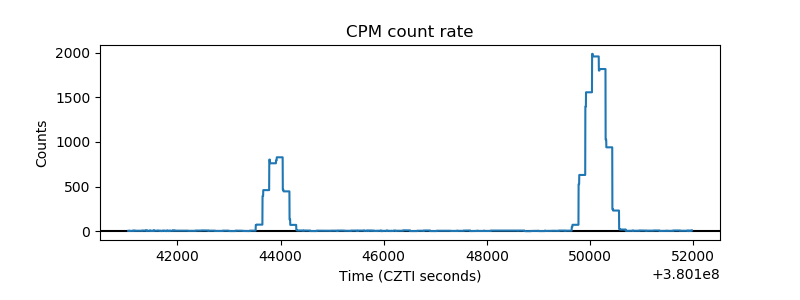 |
| CZT Counter |  |
| +2.5 Volts monitor |  |
| +5 Volts monitor |  |
| _ROLL_ROT | 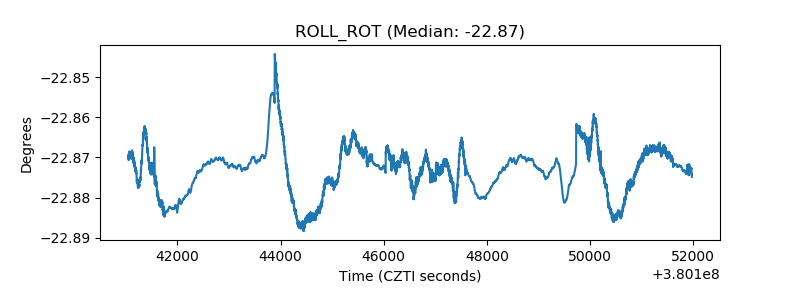 |
| _Roll_DEC | 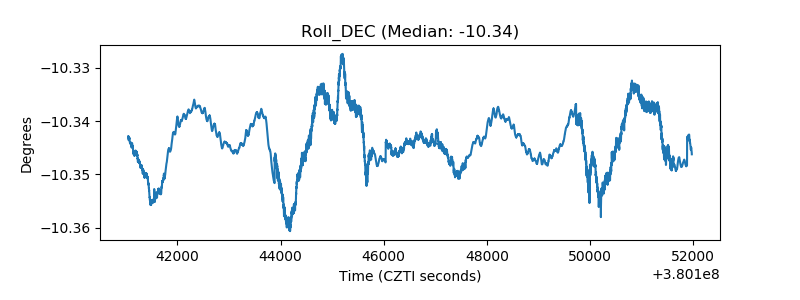 |
| _Roll_RA | 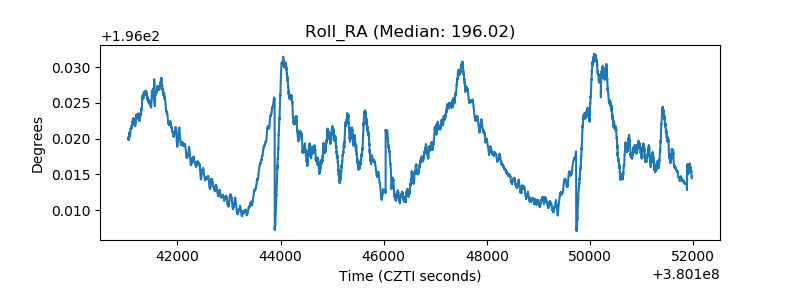 |
| Veto Counter | 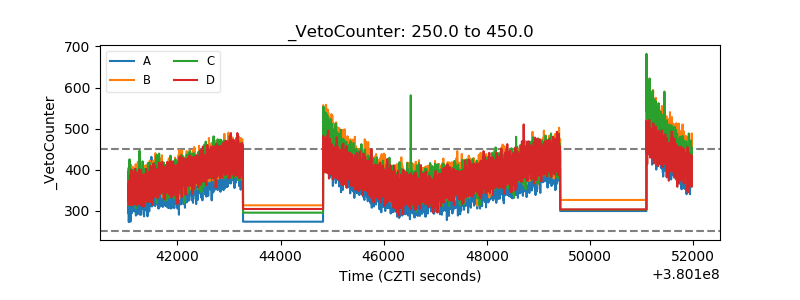 |