| Param | Original file | Final file |
|---|---|---|
| Filename | modeM0/AS1A05_208T01_9000004870_34101cztM0_level2.evt | modeM0/AS1A05_208T01_9000004870_34101cztM0_level2_quad_clean.evt |
| Size (bytes) | 474,048,000 | 83,364,480 |
| Size | 452.1 MB | 79.5 MB |
| Events in quadrant A | 2,445,435 | 557,167 |
| Events in quadrant B | 3,921,481 | 550,538 |
| Events in quadrant C | 3,370,048 | 540,273 |
| Events in quadrant D | 4,267,807 | 512,741 |
| Mode SS | |||
|---|---|---|---|
| Quadrant | BADHDUFLAG | Total packets | Discarded packets |
| A | 0 | 106 | 0 |
| B | 0 | 106 | 0 |
| C | 0 | 106 | 0 |
| D | 0 | 106 | 0 |
| Mode M9 | |||
|---|---|---|---|
| Quadrant | BADHDUFLAG | Total packets | Discarded packets |
| A | 0 | 26 | 0 |
| B | 0 | 26 | 0 |
| C | 0 | 26 | 0 |
| D | 0 | 27 | 0 |
| Mode M0 | |||
|---|---|---|---|
| Quadrant | BADHDUFLAG | Total packets | Discarded packets |
| A | 0 | 10586 | 3 |
| B | 0 | 15077 | 2 |
| C | 0 | 13228 | 2 |
| D | 0 | 16246 | 2 |
| Quadrant | Total seconds | Saturated seconds | Saturation percentage |
|---|---|---|---|
| A | 5186 | 8 | 0.154261% |
| B | 5186 | 415 | 8.002314% |
| C | 5186 | 199 | 3.837254% |
| D | 5186 | 168 | 3.239491% |
Noise dominated data is calculated using 1-second bins in cleaned event files. If a bin has >2000 counts, and if more than 50% of those come from <1% of pixels, then it is considered to be noise-dominated and hence unusable.
| Quadrant | # 1 sec bins | Bins with >0 counts | Bins with >2000 counts | High rate bins dominated by noise | Noise dominated (total time) | Noise dominated (detector-on time) | Marked lightcurve |
|---|---|---|---|---|---|---|---|
| A | 7008 | 5187 | 0 | 0 | 0.00% | 0.00% | 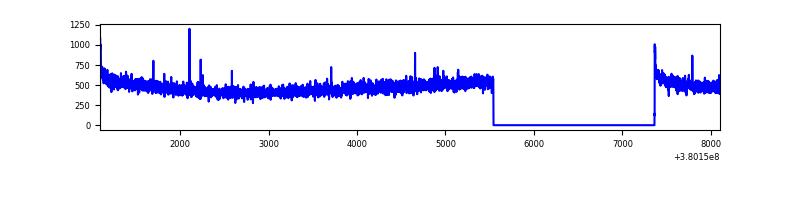 |
| B | 7008 | 5187 | 289 | 289 | 4.12% | 5.57% |  |
| C | 7008 | 5187 | 149 | 149 | 2.13% | 2.87% | 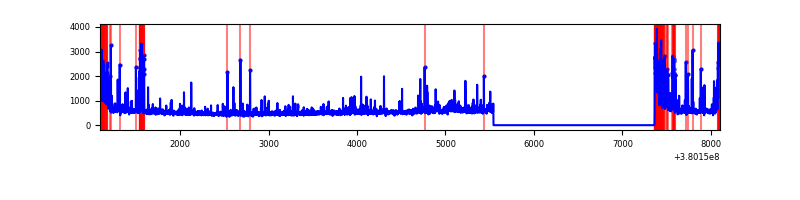 |
| D | 7008 | 5187 | 156 | 156 | 2.23% | 3.01% | 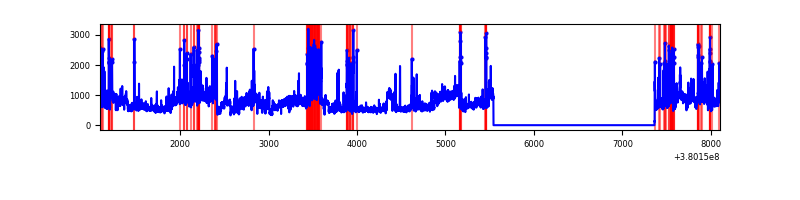 |
Top three noisy pixels from each quadrant. If the there are fewer than three noisy pixels in the level2.evt file, extra rows are filled as -1
| Pixel properties | Quadrant properties | ||||||
|---|---|---|---|---|---|---|---|
| Quadrant | DetID | PixID | Counts | Sigma | Mean | Median | Sigma |
| A | 13 | 6 | 24882 | 194.76 | 621 | 609 | 124.6 |
| A | 10 | 83 | 19528 | 151.8 | 621 | 609 | 124.6 |
| A | 13 | 254 | 8796 | 65.69 | 621 | 609 | 124.6 |
| B | 5 | 172 | 1351741 | 11514.7 | 606 | 592 | 117.3 |
| B | 8 | 128 | 37068 | 310.85 | 606 | 592 | 117.3 |
| B | 0 | 189 | 36928 | 309.66 | 606 | 592 | 117.3 |
| C | 0 | 10 | 442431 | 3159.5 | 599 | 605 | 139.8 |
| C | 14 | 254 | 286902 | 2047.31 | 599 | 605 | 139.8 |
| C | 15 | 214 | 221894 | 1582.44 | 599 | 605 | 139.8 |
| D | 8 | 195 | 1092357 | 7502.74 | 595 | 579 | 145.5 |
| D | 2 | 250 | 459231 | 3151.87 | 595 | 579 | 145.5 |
| D | 13 | 249 | 204264 | 1399.73 | 595 | 579 | 145.5 |
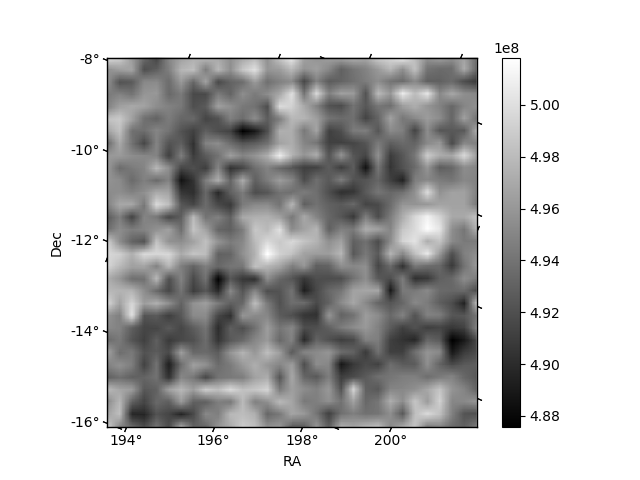
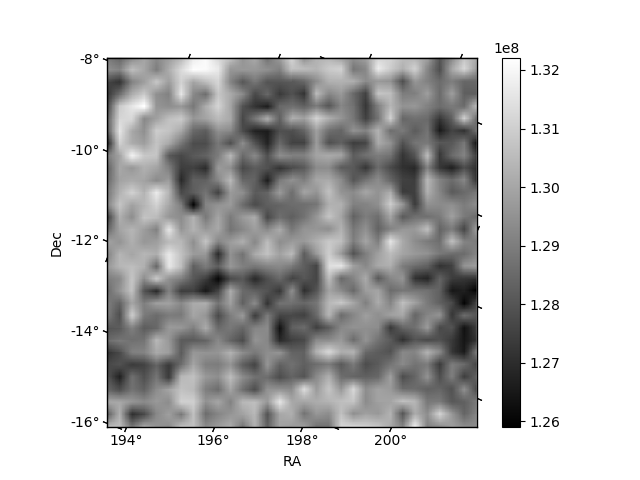
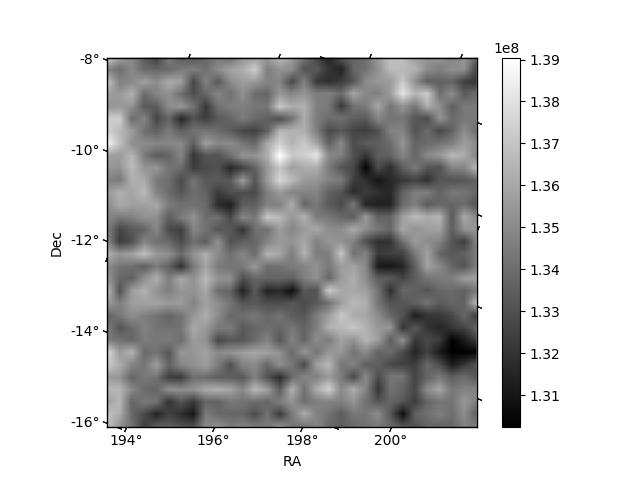
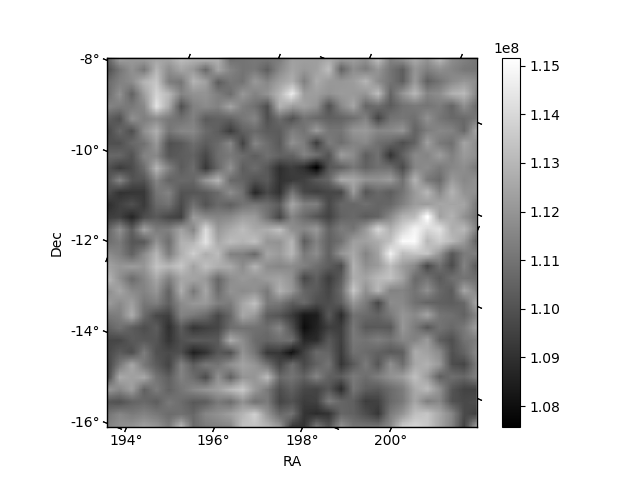
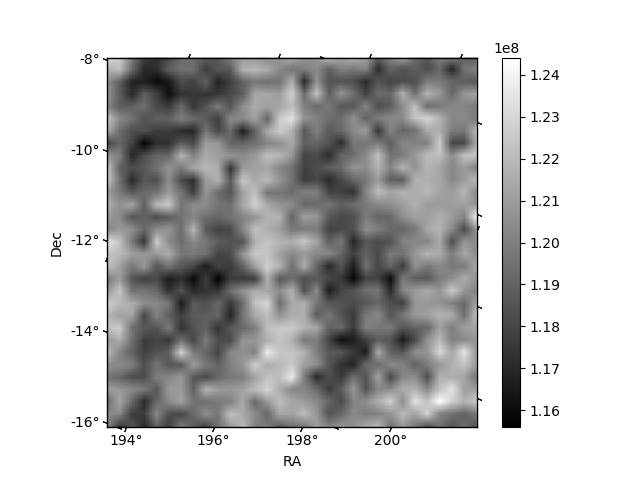
Histogram calculated using DETX and DETY for each event in the final _common_clean file
| Quadrant A | 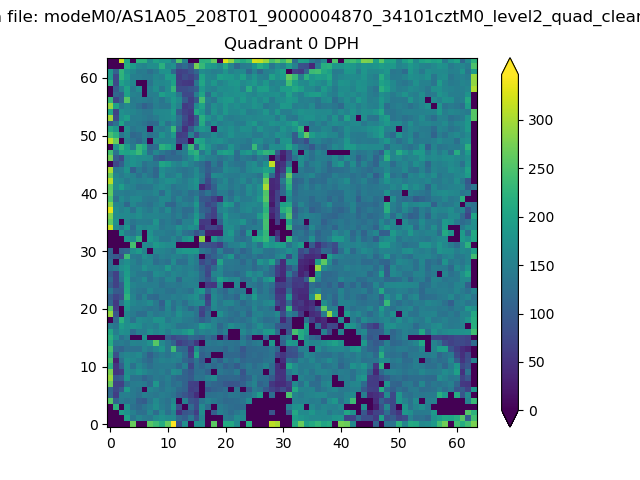 |
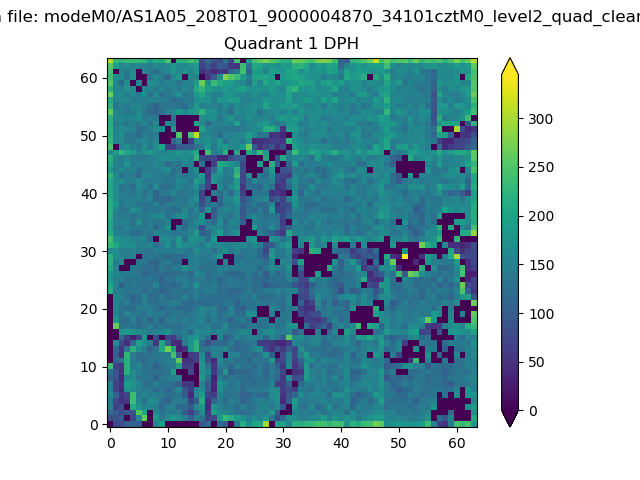 |
Quadrant B |
|---|---|---|---|
| Quadrant D |  |
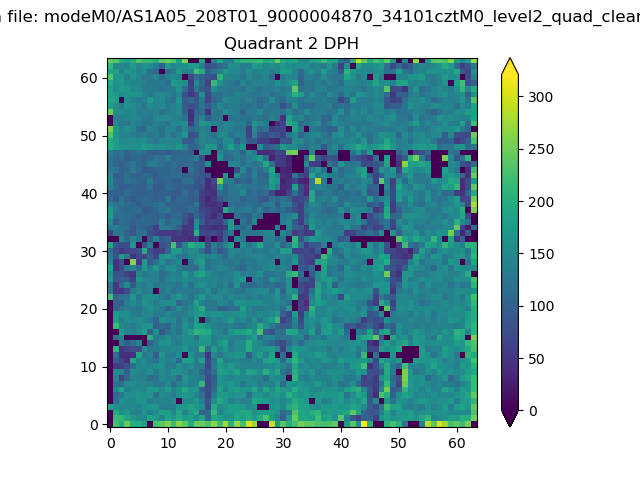 |
Quadrant C |
| Plot type | Count rate plots | Images |
|---|---|---|
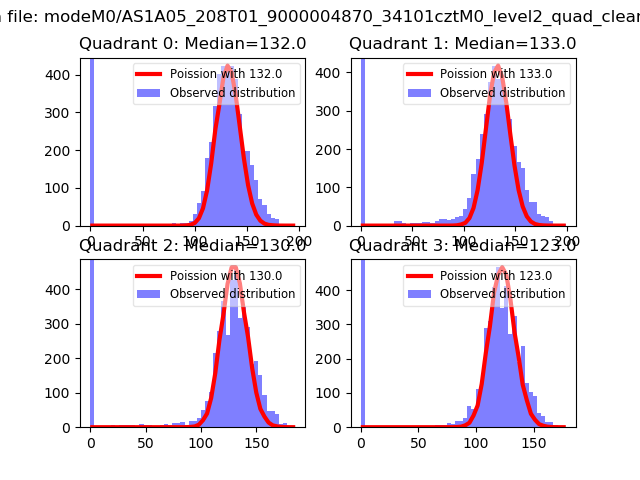
| Comparison with Poisson distribution Blue bars denote a histogram of data divided into 1 sec bins. Red curve is a Poisson curve with rate = median count rate of data. |
 |
 |
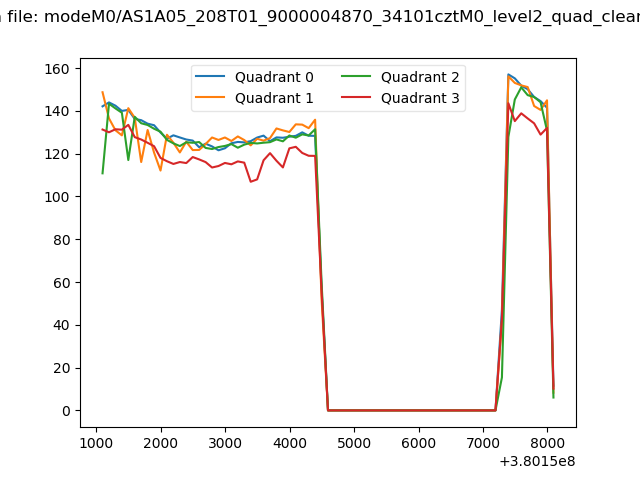
| Quadrant-wise count rates Data is divided into 100 sec bins |
 |
|
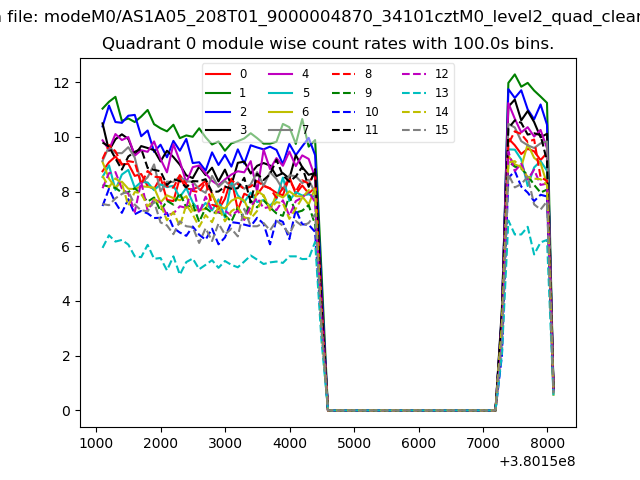
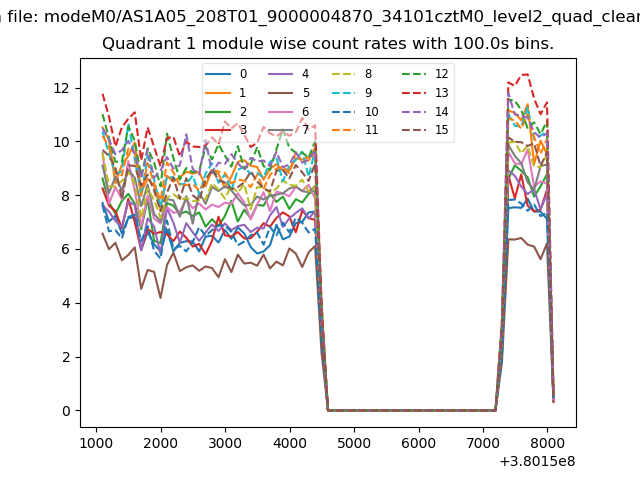
| Module-wise count rates for Quadrant A Data is divided into 100 sec bins |
 |
 |
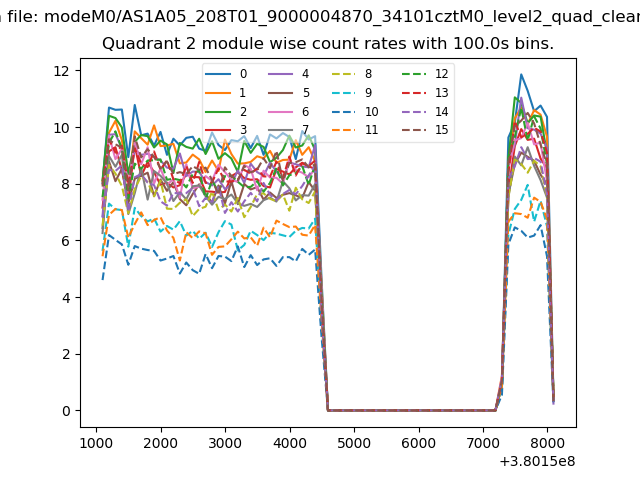
| Module-wise count rates for Quadrant B Data is divided into 100 sec bins |
 |
 |
| Module-wise count rates for Quadrant C Data is divided into 100 sec bins |
 |
 |
| Module-wise count rates for Quadrant D Data is divided into 100 sec bins |
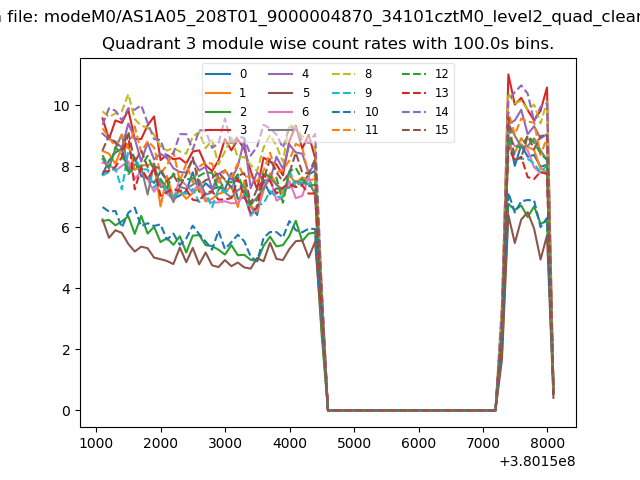 |
 |
| Parameter | Plot |
|---|---|
| CZT HV Monitor | 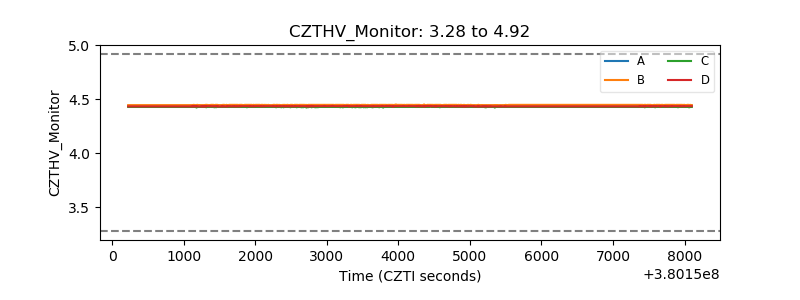 |
| D_VDD | 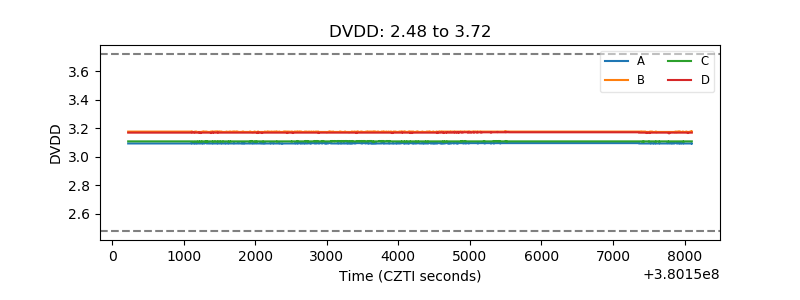 |
| Temperature 1 | 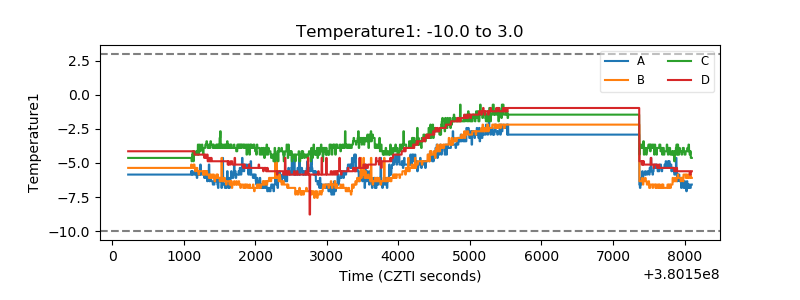 |
| Veto HV Monitor | 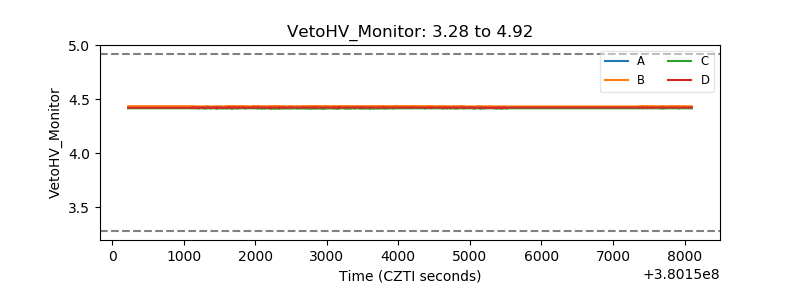 |
| Veto LLD | 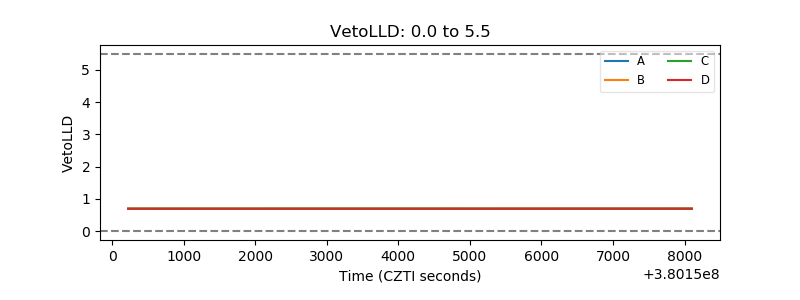 |
| Alpha Counter | 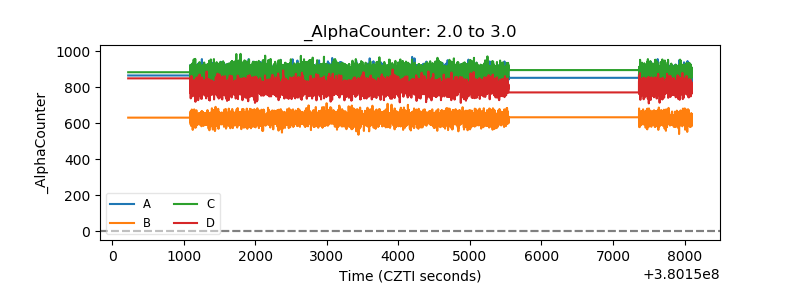 |
| _CPM_Rate |  |
| CZT Counter | 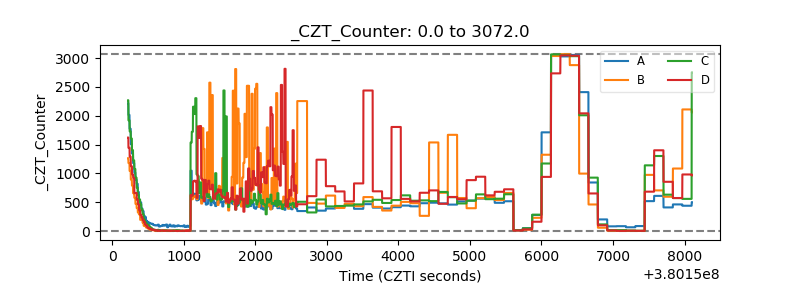 |
| +2.5 Volts monitor | 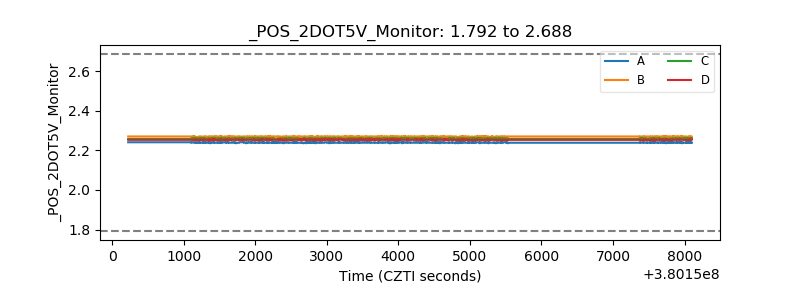 |
| +5 Volts monitor |  |
| _ROLL_ROT | 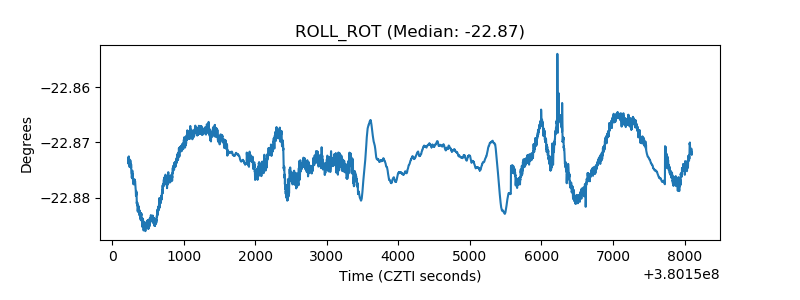 |
| _Roll_DEC | 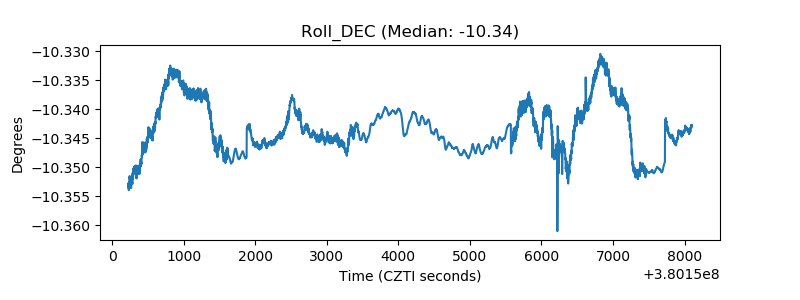 |
| _Roll_RA | 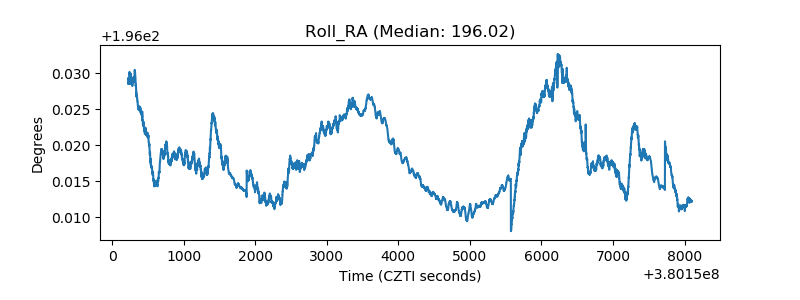 |
| Veto Counter | 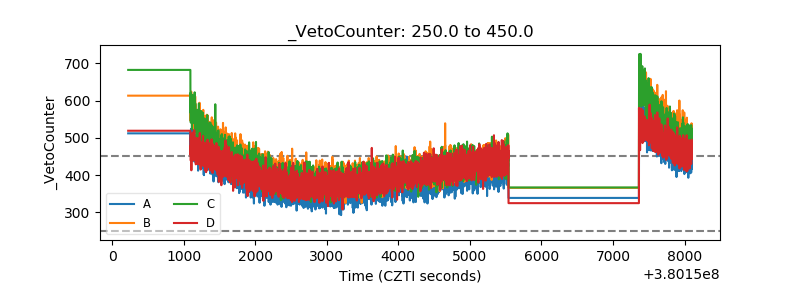 |